Correction to: Scientific Reports 10.1038/s41598-018-37658-5, published online 31 January 2019
This Article contains errors in Tables 2 and 3, where the uncorrected p-values are given rather than the corrected Benjamini-Hochberg adjusted p-values. As a result the Table legends,
“Summary of the effects of age on gray and white matter microstructural indices. *Controlled for intracranial volume, **5% FDR corrected. ISOSF = isotropic signal fraction, MPF = macromolecular proton fraction, ODI = orientation dispersion index, PHC = parahippocampal cingulum.”
should read:
“Summary of the effects of age on gray and white matter microstructural indices. *Controlled for intracranial volume, **5% False Discovery Rate Benjamini-Hochberg adjusted p-values. ISOSF = isotropic signal fraction, MPF = macromolecular proton fraction, ODI = orientation dispersion index, PHC = parahippocampal cingulum.”
and
“Summary of the results of the hierarchical regression models testing for the effects of genetic and lifestyle risk variables on fornix and hippocampus mediator variables. 5% FDR corrected p-values are highlighted in bolds.”
should read:
“Summary of the results of the hierarchical regression models testing for the effects of genetic and lifestyle risk variables on fornix and hippocampus mediator variables. pBHadj, 5% False Discovery Rate Benjamini-Hochberg adjusted p-values (significant p-values are highlighted in bold). BP = blood pressure, FH = family history, ICV = intracranial volume, ISOSF = isotropic signal fraction, MPF = macromolecular proton fraction, WHR = waist-hip-ratio.”
The correct Tables 2 and 3 appear below with their accompanying legends as Tables 1 and 2 respectively.
Table 1.
Summary of the effects of age on gray and white matter microstructural indices. *Controlled for intracranial volume, **5% False Discovery Rate Benjamini-Hochberg adjusted p-values. ISOSF = isotropic signal fraction, MPF = macromolecular proton fraction, ODI = orientation dispersion index, PHC = parahippocampal cingulum.
| MRI index | F(2,152)-value* | Benjamini-Hochberg corrected p-value** | Effect size ηp2 | ||
|---|---|---|---|---|---|
| Fornix | MPF | 11.9 | 0.0002 | 0.14 | |
| k f | 10.0 | 0.0008 | 0.12 | ||
| R1 | 12.4 | 0.00035 | 0.14 | ||
| ISOSF | 8.9 | 0.001 | 0.11 | ||
| ODI | 5.0 | 0.03 | 0.06 | ||
| Left PHC | R2 | 7.5 | 0.005 | 0.09 | |
| Right PHC | R1 | 4.7 | 0.03 | 0.06 | |
| Left hippocampus | k f | 6.7 | 0.008 | 0.08 | |
| R1 | 5.0 | 0.025 | 0.06 | ||
| ISOSF | 12.2 | 0.0002 | 0.14 | ||
| ODI | 9.8 | 0.0007 | 0.12 | ||
| Right hippocampus | ISOSF | 7.5 | 0.004 | 0.09 | |
Table 2.
Summary of the results of the hierarchical regression models testing for the effects of genetic and lifestyle risk variables on fornix and hippocampus mediator variables. pBHadj, 5% False Discovery Rate Benjamini-Hochberg adjusted p-values (significant p-values are highlighted in bold). BP = blood pressure, FH = family history, ICV = intracranial volume, ISOSF = isotropic signal fraction, MPF = macromolecular proton fraction, WHR = waist-hip-ratio.
| Outcome variables | Adjusted R2 | Predictors in final regression model |
|---|---|---|
| Fornix MPF | 0.24 (p < 0.001) |
Age (p BHadj < 0.001) WHR (p BHadj = 0.045) |
| Fornix R1 | 0.28 (p < 0.001) |
Age (p BHadj < 0.001) ICV (p BHadj = 0.026) Alcohol (p BHadj = 0.03) WHR (p BHadj = 0.04) |
| Fornix kf | 0.23 (p < 0.001) |
Age (p BHadj < 0.001) WHR (pBHadj = 0.07) |
| Fornix ISOSF | 0.32 (p < 0.001) |
Age (p BHadj < 0.001) ICV (pBHadj = 0.05) Sex (p BHadj = 0.004) |
| Right hippocampal ISOSF | 0.36 (p < 0.001) |
Age (p BHadj < 0.001) ICV (p BHadj = 0.026) Sex (p BHadj = 0.007) Diastolic BP (pBHadj = 0.07) FH (pBHadj = 0.07) |
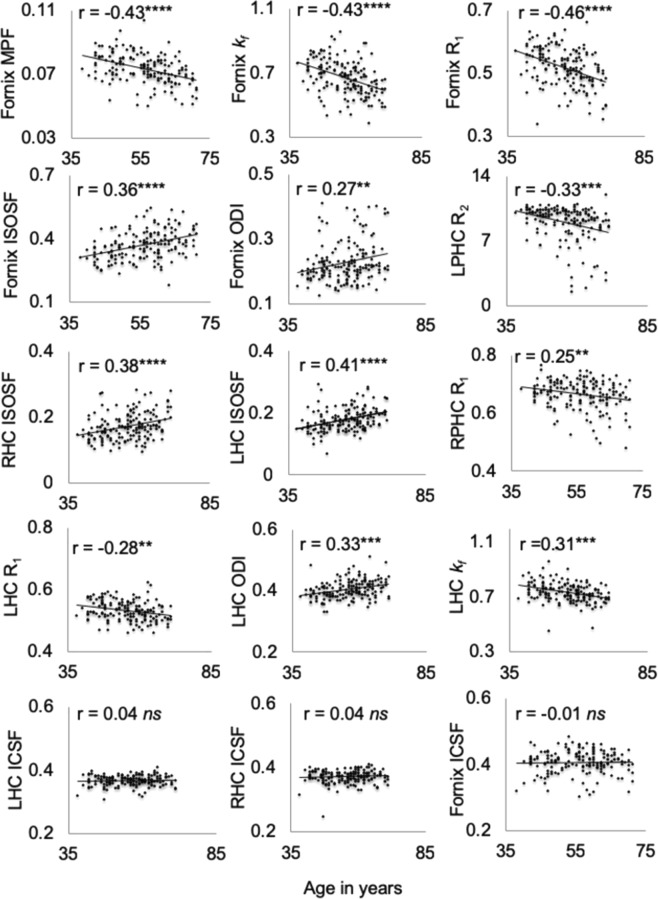
In addition, in Figure 3 the p-values for the following scatterplots are incorrect: Fornix ODI, LPHC R2, RPHC R1, LHC R1, LHC ODI and LHC kf. As a result, the Figure legend,
“Plots the correlations and Pearson coefficients (controlled for intracranial volume) between age and white and gray matter microstructural indices. Abbr.: ICSF = intracellular signal fraction, ISOSF = isotropic signal fraction, kf = forward exchange rate, LHC = left hippocampus, LPHC = left parahippocampal cingulum, MPF = Macromolecular proton fraction, ODI = orientation dispersion index, R = longitudinal relaxation rate, RHC = right hippocampus, RPHC = right parahippocampal cingulum ****p < 0.0001, ***p < 0.001, **p < 0.01, *p < 0.05, 5% False Discovery Rate”
should read:
“Scatterplots of the correlations and Pearson coefficients (controlled for intracranial volume) between age and white and gray matter microstructural indices. Abbr.: ICSF = intracellular signal fraction, ISOSF = isotropic signal fraction, kf = forward exchange rate, LHC = left hippocampus, LPHC = left parahippocampal cingulum, MPF = Macromolecular proton fraction, ODI = orientation dispersion index, R = longitudinal relaxation rate, RHC = right hippocampus, RPHC = right parahippocampal cingulum ****p < 0.0001, ***p < 0.001, **p < 0.01 (5% False Discovery Rate Benjamini-Hochberg adjusted p-values).”
The correct Figure 3 and its accompanying legend appears below as Figure 1.
Figure 1.
Scatterplots of the correlations and Pearson coefficients (controlled for intracranial volume) between age and white and gray matter microstructural indices. Abbr.: ICSF = intracellular signal fraction, ISOSF = isotropic signal fraction, kf = forward exchange rate, LHC = left hippocampus, LPHC = left parahippocampal cingulum, MPF = Macromolecular proton fraction, ODI = orientation dispersion index, R = longitudinal relaxation rate, RHC = right hippocampus, RPHC = right parahippocampal cingulum ****p < 0.0001, ***p < 0.001, **p < 0.01 (5% False Discovery Rate Benjamini-Hochberg adjusted p-values).


