

Abstract
Voltage-gated Ca2+ channels (VGCCs) of the P/Q-type, which are expressed at a majority of mammalian nerve terminals, show two types of Ca2+-dependent feedback regulation—inactivation (CDI) and facilitation (CDF). Because of the nonlinear relationship between Ca2+ influx and transmitter release, CDI and CDF are powerful regulators of synaptic strength. To what extent VGCCs inactivate or facilitate during spike trains depends on the dynamics of free Ca2+ ([Ca2+]i) and the Ca2+ sensitivity of CDI and CDF, which has not been determined in nerve terminals. In this report, we took advantage of the large size of a rat auditory glutamatergic synapse—the calyx of Held—and combined voltage-clamp recordings of presynaptic Ca2+ currents (ICa(V)) with UV-light flash-induced Ca2+ uncaging and presynaptic Ca2+ imaging to study the Ca2+ requirements for CDI and CDF.
We find that nearly half of the presynaptic VGCCs inactivate during 100 ms voltage steps and require several seconds to recover. This inactivation is caused neither by depletion of Ca2+ ions from the synaptic cleft nor by metabotropic feedback inhibition, because it is resistant to blockade of metabotropic and ionotropic glutamate receptors. Facilitation of ICa(V) induced by repetitive depolarizations or preconditioning voltage steps decays within tens of milliseconds. Since Ca2+ buffers only weakly affect CDI and CDF, we conclude that the Ca2+ sensors are closely associated with the channel. CDI and CDF can be induced by intracellular photo release of Ca2+ resulting in [Ca2+]i elevations in the low micromolar range, implying a surprisingly high affinity of the Ca2+ sensors.
Introduction
Beyond being charge carriers, Ca2+ ions serve many additional functions in neuronal tissue, the most prominent being the rapid triggering of neurotransmitter secretion from nerve terminals. P/Q-type Ca2+ channels (CaV2.1) are responsible for Ca2+-dependent vesicle exocytosis from many nerve terminals of the mammalian CNS. Presynaptic CaV2.1 channels undergo a dual feedback regulation by incoming Ca2+ ions, Ca2+-dependent facilitation, and inactivation (Lee et al., 1999; Liang et al., 2003; Inchauspe et al., 2004; Ishikawa et al., 2005). Ca2+-dependent facilitation (CDF) develops rapidly with the first tens of milliseconds of repeated action potential (AP)-like depolarizations. An increased channel open probability (Chaudhuri et al., 2007) and/or a negative shift in the voltage-dependent activation (Borst and Sakmann, 1998a; Cuttle et al., 1998) may underlie the measured increase in presynaptic Ca2+ currents (ICa(V)). Among presynaptic voltage-gated Ca2+ channels (VGCCs), CDF is unique to CaV2.1 channels, whereas Ca2+-dependent inactivation (CDI) is a common property of several VGCC subtypes whereby the entry of Ca2+ enhances channel closure during a maintained depolarization (DeMaria et al., 2001; Liang et al., 2003).
Because transmitter release is highly nonlinearly related to calcium influx, even minute changes in presynaptic Ca2+ flux can strongly impact release (Neher, 1998). Thus, Ca2+-dependent regulation of VGCCs represents an important and powerful mechanism to regulate synaptic strength (Borst and Sakmann, 1998b; Xu and Wu, 2005). Indeed, calyx of Held synapses lacking CaV2.1-dependent CDF also show reduced EPSC facilitation during repetitive synapse activation (Inchauspe et al., 2004; Ishikawa et al., 2005). Likewise, in cultured superior cervical ganglion neurons, Ca2+ channel mutations that block CDI or CDF of CaV2.1 channels substantially affect short-term plasticity of synaptic transmission (Mochida et al., 2008), and a gain-of-function missense mutation of the CaV2.1 channel that occludes CDF correlates with a reduction in short-term synaptic facilitation at the parallel fiber→Purkinje cell synapse (Adams et al., 2010).
Most mammalian nerve terminals are too small to be accessible for electrophysiological recordings. Thus, our knowledge about Ca2+-dependent regulation of presynaptic VGCCs is still limited. Here we took advantage of the large size of a glutamatergic terminal in the mammalian auditory brainstem—the calyx of Held—to study Ca2+-dependent regulation of presynaptic CaV2.1 channels. In particular, we were interested in determining the intracellular Ca2+ requirements for CDI and CDF. To this end, we combined presynaptic whole-cell recordings of ICa(V) with Ca2+ uncaging via flash photolysis while monitoring [Ca2+]i with indicator dyes. Our results indicate that both regulatory pathways, CDI as well as CDF, can be activated by [Ca2+]i elevations of only a few micromoles. Such elevations of the global volume average [Ca2+]i are easily achieved during repetitive AP firing, especially at higher frequencies when individual AP-evoked [Ca2+]i transients start to summate. Since auditory circuits discharge at high rates during sound stimulation and show varying levels of spontaneous AP firing even in the complete absence of sound (Friauf and Ostwald, 1988; Taberner and Liberman, 2005; Tolnai et al., 2008; Sonntag et al., 2009), presynaptic VGCCs at the calyx of Held and presumably also in other auditory terminals predominantly expressing CaV2.1 channels will be subject to strong Ca2+-dependent regulation.
Materials and Methods
Slice preparation.
Juvenile (P8–10) Wistar rats of either sex were used for most experiments. For comparison, some recordings were also obtained from postnatal day (P)9–11 C57BL/6N or α1A-deficient (α1A−/−) mice (Jun et al., 1999), and in some cases from P14–16 rats of either sex (see Figs. 3, 7). Brainstem slices were prepared as described previously (Taschenberger and von Gersdorff, 2000; Erazo-Fischer et al., 2007). After decapitation, the whole brain was immediately immersed into ice-cold low Ca2+ artificial CSF (aCSF) containing the following (in mm): 125 NaCl, 2.5 KCl, 3 MgCl2, 0.1 CaCl2, 10 glucose, 25 NaHCO3, 1.25 NaH2PO4, 0.4 ascorbic acid, 3 myo-inositol, and 2 Na-pyruvate at pH 7.3 when bubbled with carbogen (95% O2, 5% CO2). The brainstem was glued onto the stage of a VT1000S vibratome (Leica), and 200-μm-thick coronal slices containing the medial nucleus of the trapezoid body (MNTB) were cut. Slices were incubated for 30–40 min at 35°C in a chamber containing normal aCSF and kept at room temperature (22–24°C) for up to 4 h thereafter. The composition of normal aCSF was identical to that of low Ca2+ aCSF, except that 1.0 mm MgCl2 and 2.0 mm CaCl2 were used.
Figure 3.
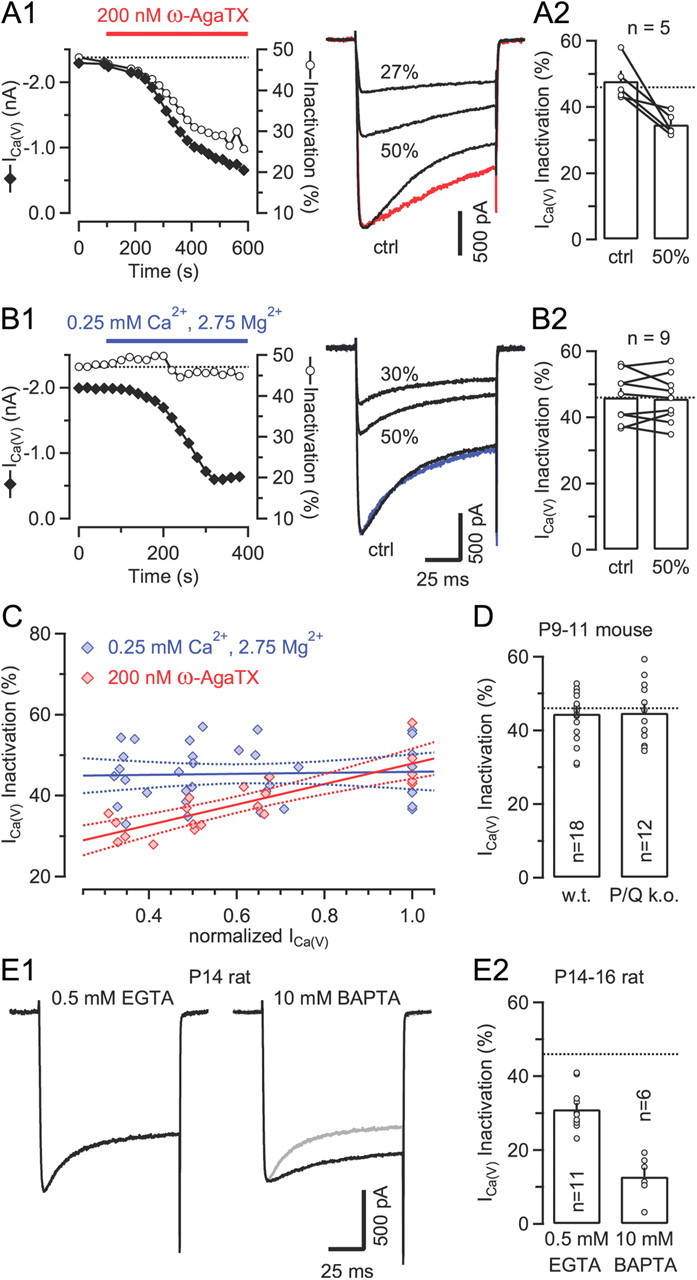
Clustering of presynaptic VGCCs may account for weak sensitivity of Ca2+-dependent inactivation to intracellular Ca2+ chelators. A1, B1, Time course of peak amplitudes and fractional inactivation of ICa(V) during gradual current reduction by either bath application of the CaV2.1 blocker ω-AgaTX (A) or slow bath perfusion with a low Ca2+ solution (B) (left panels). Samples traces representing ICa(V) recorded before (ctrl, control) and after reducing its amplitude by ∼50 and ∼70% are shown superimposed in the right panels. The colored traces represents peak scaled versions of ICa(V) after ∼50% amplitude reduction. A2, B2, Comparison of ICa(V) inactivation before and after reducing ICa(V) by ∼50% by application of either ω-AgaTX (A2) or low Ca2+ solution (B2). C, Line fits to scatter plots of inactivation versus normalized peak amplitudes of ICa(V) at selected degrees of current reduction (0, ∼33, ∼50, and ∼66%) by application of low Ca2+ solution (blue) or ω-AgaTX (red). Dotted lines represent 95% confidence limits. When ω-AgaTX was applied to gradually reduce ICa(V), fractional inactivation and normalized amplitudes were highly correlated (Pearson's r = 0.83, p < 0.001). In contrast, the slope of the regression line was not significantly different from zero (p = 0.79) for the data obtained with low Ca2+ bath perfusion. All data shown in A–C were obtained with 10 mm BAPTA in the pipette solution. D, ICa(V) inactivation is unaltered in calyces of mice lacking CaV2.1 (p = 0.93) (0.5 mm EGTA in the pipette solution). w.t., Wild type; k.o., knockout. Inactivation of ICa(V) is strongly reduced in more mature calyces. Recordings from two P14 terminals with either 0.5 mm EGTA (left) or 10 mm BAPTA (right) in the patch pipette. The gray trace represents a peak scaled version of ICa(V) recorded with 0.5 mm EGTA. E2, Fractional inactivation of ICa(V) in P14–16 calyces is significantly attenuated when recorded with 10 mm BAPTA in the patch-pipette (p < 0.001). The dotted lines in A2, B2, D, and E2 indicate the mean fractional inactivation of ICa(V) in calyces of P8–10 rats with 0.5 mm EGTA in the pipette (see Fig. 1D).
Figure 7.
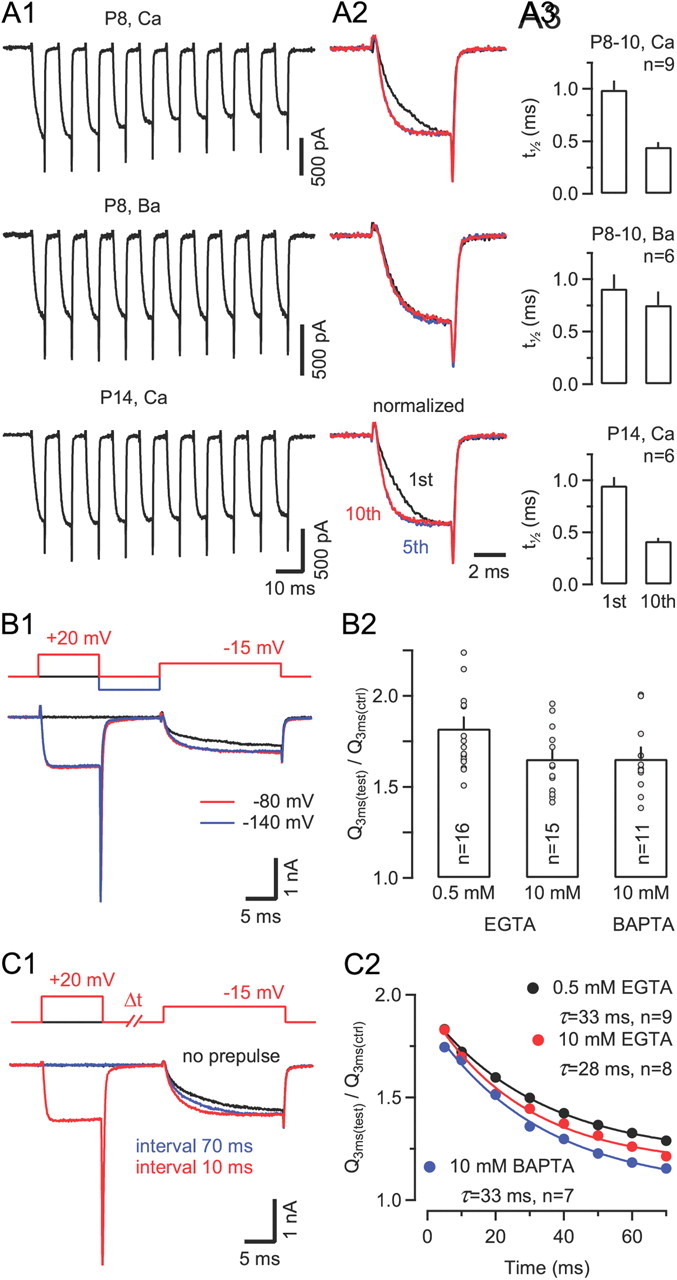
Presynaptic ICa(V) shows robust Ca2+-dependent facilitation during prepulse protocols. A1, ICa(V) elicited by a 100 Hz train of 5 ms steps from Vh = −80 mV to −20 mV in two P8 calyces (top and middle) and in a P14 calyx (bottom). With Ca2+ as the charge carrier (top and bottom), the activation of ICa(V) strongly accelerated from the first to the fifth voltage step and remained fast during later steps. No change in activation kinetics was observed with external Ba2+ (middle). A2, First, fifth, and tenth ICa(V) shown superimposed for comparison after normalizing to the same peak amplitude. A3, ICa(V) facilitation was similar in P8–10 and P14 calyces. Average half-rise times of the first and tenth ICa(V) in the train. B–C, Facilitation of ICa(V) during paired-pulse protocols. B1, Sample traces of ICa(V) elicited by stepping to −15 mV with (red trace) or without (black trace) a preceding prepulse to +20 mV (20 ms interpulse interval). Facilitation was quantified as the ratio of charges transferred during the initial 3 ms of ICa(V) with or without prepulse. Note that a hyperpolarization to −140 between prepulse and test pulse (blue trace) did not alter the amount of current facilitation. B2, Increasing intracellular Ca2+ buffer strength only slightly suppressed facilitation of ICa(V). C1, Sample traces of ICa(V) without (black trace) or with prepulse at 10 ms (red) or 70 ms interval (blue). C2, The relaxation of ICa(V) facilitation is an order of magnitude faster than recovery from inactivation and insensitive to changes in [Ca2+]i buffering strength. Solid lines represent single exponential fits with the decay time constants as indicated.
Electrophysiology and data analysis.
Patch-clamp recordings were made from calyx of Held terminals using an EPC-10 amplifier controlled by Pulse software (HEKA Elektronik). Sampling intervals and filter settings were 20 μs and 4.5 kHz, respectively. Cells were visualized by differential interference contrast microscopy through a 60× water-immersion objective (numerical aperture 1.0; Olympus) using an upright Axioskop FS microscope (Zeiss). All experiments were performed at room temperature.
Patch pipettes were pulled from borosilicate glass (Science Products) on a P-97 micropipette puller (Sutter Instrument). Pipettes were coated with dental wax to reduce stray capacitance. Open tip resistance was 4–5 MΩ. Access resistance (Rs) was ≤20 MΩ and routinely compensated by 50–60% during presynaptic voltage-clamp experiments. The holding potential (Vh) was −80 mV. For measuring presynaptic ICa(V) and changes in membrane capacitance (ΔCm), pipettes were filled with a solution containing the following (in mm): 100 Cs-gluconate, 30 TEA-Cl, 30 CsCl, 10 HEPES, 5 Na2-phosphocreatine, 4 ATP-Mg, 0.3 GTP, pH 7.3, with CsOH. The pipette solution was supplemented with varying concentrations of EGTA or BAPTA as indicated. The bath solution was supplemented with 1 μm TTX, 1 mm 4-AP, and 40 mm TEA-Cl to suppress voltage-gated Na+ and K+ currents. Junction potentials were not corrected. In some experiments a mixture of antagonists (50 μm d-AP5, 5 μm NBQX, 300 μm CPPG, and 5 μm AM251) was applied to study a possible inactivation of presynaptic ICa(V) by mechanisms that involve depletion of Ca2+ ions from the synaptic cleft and/or activation of metabotropic glutamate or cannabinoid receptors (see Fig. 2).
Figure 2.
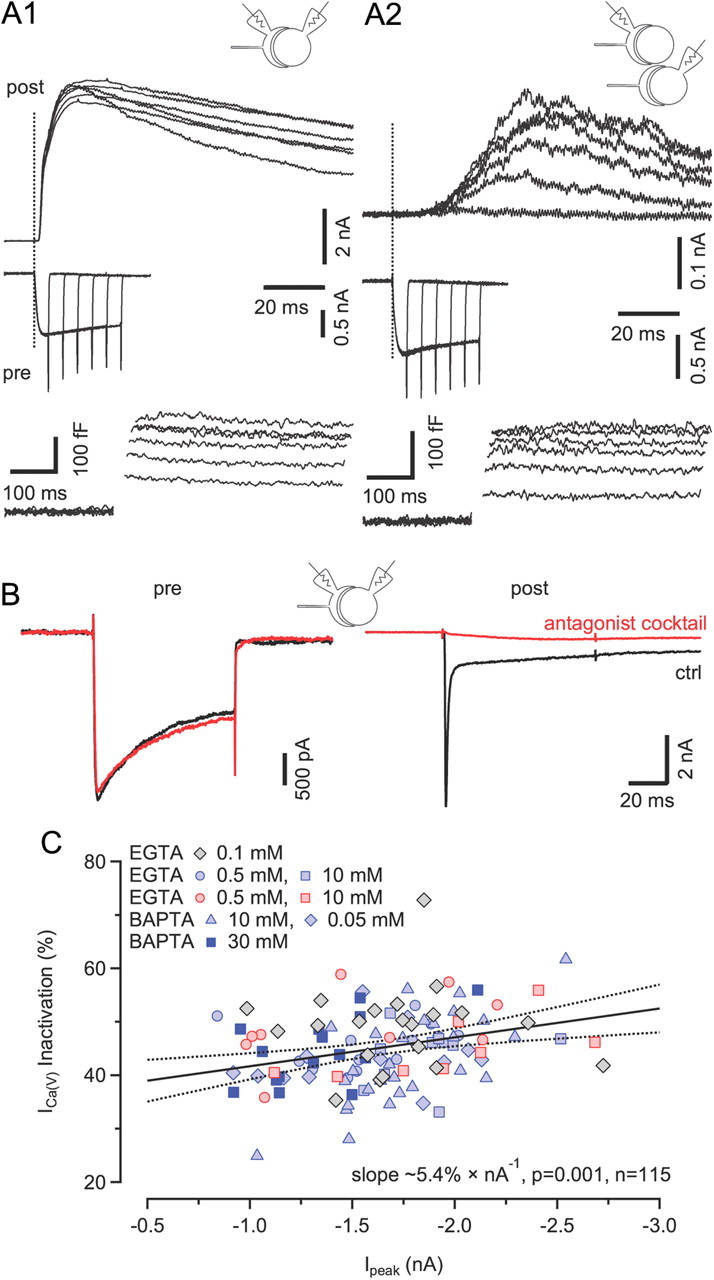
Neither depletion of Ca2+ from the synaptic cleft nor feedback inhibition of VGCCs via metabotropic receptors account for ICa(V) inactivation during sustained 100 ms depolarizations. A, Paired recordings from calyx terminals and synaptically coupled (A1) or neighboring (A2) MNTB principal cell somata. Vesicle exocytosis was elicited by applying step depolarizations from Vh = −80 to 0 mV of various durations (5–30 ms). Dotted lines mark the onset of presynaptic depolarizations. The corresponding ICa(V) and ΔCm responses are shown in the middle and bottom rows, respectively. Postsynaptic neurons were voltage clamped at Vh = +40 mV. Presynaptic depolarizations induced large NMDA EPSCs with short latencies in postsynaptic neurons (A1) and induced spillover NMDA EPSCs in neighboring cells (A2), indicating that synaptically released glutamate can escape the synaptic cleft and activate extrasynaptic receptors. B, Blocking ionotropic and metabotropic receptors pharmacologically does not affect ICa(V) inactivation. Paired recordings of ICa(V) (left) and EPSCs (right) in control solution (black) and after adding a mixture of glutamate and cannabinoid receptor antagonists (red; see Materials and Methods) to suppress Ca2+ influx through GluR channels and feedback inhibition via mGluRs and/or CBRs. C, Scatter plot of fractional inactivation versus peak amplitudes of ICa(V). Pooled results obtained with different intracellular Ca2+ chelator species and concentrations. Data obtained from recordings in the presence of the antagonist mixture are plotted using red symbols. Solid and broken lines represent line fit and 95% confidence limits to the entire dataset, indicating a weak positive correlation (Pearson's r = −0.30, p = 0.001, n = 115) between ICa(V) peak amplitude and degree of inactivation with a slope of ∼5.4% × nA−1.
Changes in membrane capacitance were monitored using the Sine+DC technique (Lindau and Neher, 1988) with a software lock-in amplifier (HEKA Pulse) by adding a 1 kHz sine–wave voltage command (amplitude ±35 mV) to Vh = −80 mV. To block CaV2.1 channels, ω-agatoxin IVA (ω-AgaTX; 200 nm) (Peptide Institute) was dissolved in aCSF containing 0.1 mg/ml cytochrome c and applied via bath perfusion. Off-line analysis was done with Igor Pro (WaveMetrics). All values are given as mean ± SEM. Unless indicated otherwise, significance of difference was evaluated with the two-tailed Student's unpaired t test and p < 0.05 was taken as the level of statistical significance.
Flash photolysis and presynaptic Ca2+ imaging.
A UV flash lamp (Rapp Optoelectronic) was used to uncage Ca2+ from DM-Nitrophen and elicit step-like elevations of the intracellular free Ca2+ concentration ([Ca2+]i) in presynaptic terminals (Schneggenburger and Neher, 2000). Different post-flash amplitudes of [Ca2+]i were obtained by controlling the flash light intensity using neutral density filters and/or by varying the concentration of DM-nitrophen in the pipette solution (0.6–9 mm).
Presynaptic [Ca2+]i was monitored using the ratiometric Ca2+ indicator dyes Fura 4F (Kd = 1 μm) or Fura 2FF (Kd = 10 μm), which were excited at 350 and 380 nm by a monochromator (Polychrome 5; TILL Photonics). Fluorescent images were collected with an interline-transfer 640 × 480 pixel CCD (VGA, TILL Photonics). To allow for brief exposure times, on-chip pixel binning (8 × 15) was used. Monochromator and CCD camera were controlled by the TILLvisION software (TILL Photonics). Presynaptic patch pipettes contained the following (in mm): 100–125 Cs-gluconate, 20 TEA-Cl, 20 HEPES, 0.5 MgCl2, 5 Na2-ATP, 0.3 GTP, 0.5–9 DM-Nitrophen, 0.3–7.8 CaCl2, and 0.2 Fura 2FF or 0.2 Fura 4F, pH 7.3, with CsOH. Time series images were analyzed off-line using Igor Pro software. The background fluorescence of a small area adjacent to the region of interest was subtracted to obtain the background-corrected fluorescence ratio r = F350/F380. That ratio was converted into the [Ca2+]i using the following equation (Grynkiewicz et al., 1985): [Ca2+]i = Keff(R − Rmin)/(Rmax − R). The calibration constants (Keff, Rmax, and Rmin) for each dye species were obtained from in vitro measurements.
Results
Inactivation of presynaptic voltage-gated Ca2+ channels
During long-lasting membrane depolarizations of 1 s duration, the inactivation of ICa(V) in calyx terminals followed a biphasic time course (Fig. 1A) (Forsythe et al., 1998; Ishikawa et al., 2005). To quantify the contribution of the two kinetically distinct components of ICa(V) inactivation during long depolarizations (1 s), we calculated the fractional inactivation during the first 100 ms [(Ipeak − I100 ms)/Ipeak] in comparison to that during the remaining 900 ms [(I100 ms − I1 s)/Ipeak] (Fig. 1A,B). When external Ca2+ was replaced by Ba2+ as a charge carrier, ICa(V) peak amplitudes decreased slightly from −1.61 ± 0.14 nA (n = 10) to −1.33 ± 0.10 nA (n = 10, p = 0.11; Fig. 1B, left). More importantly, the fast component of ICa(V) inactivation was strongly reduced in external Ba2+ (45.6 ± 2.0% vs 24.5 ± 1.9%, p < 0.001; Fig. 1A,B), whereas the slowly inactivating component remained nearly unaltered (24.6 ± 1.1% vs 24.3 ± 1.9%, p = 0.90; Fig. 1B). This observation suggests that the fast but not (or to a lesser extent) the slow component of ICa(V) inactivating is Ca2+ mediated. Because calyces are unlikely to experience long-lasting depolarizations comparable to those shown in Figure 1A, we reasoned that the contribution of the slowly inactivating component to the inactivation of ICa(V) under in vivo conditions is very limited and we did not further characterize it in this study.
Figure 1.
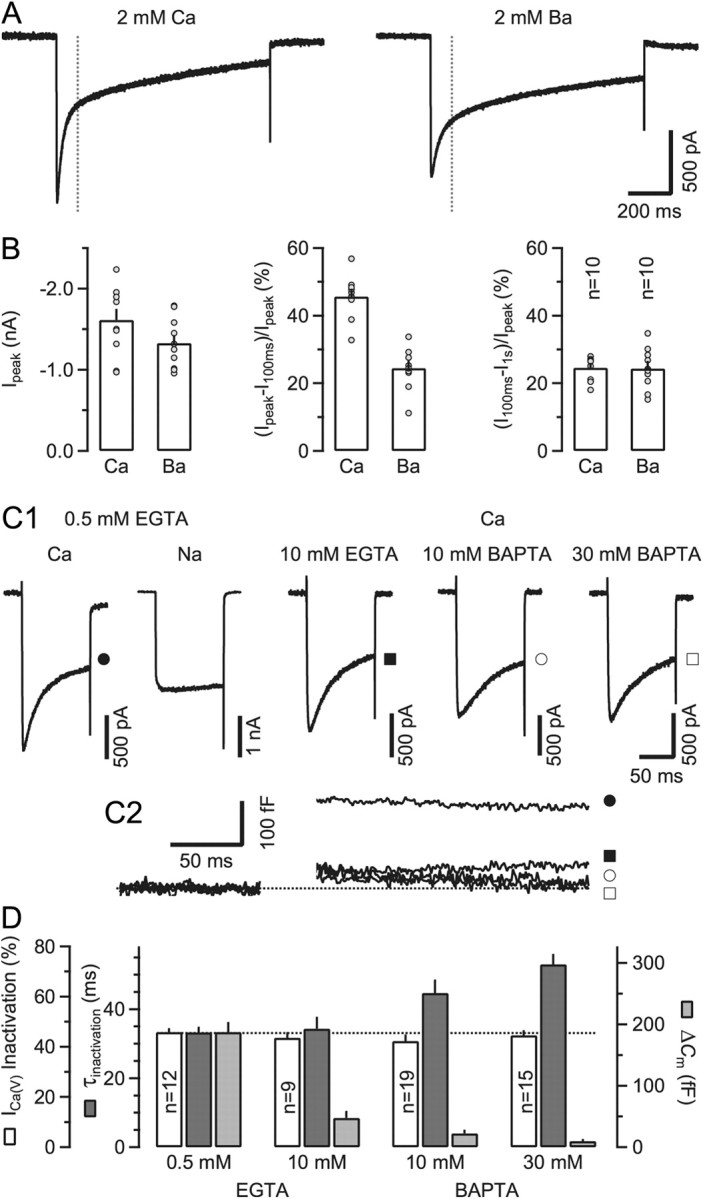
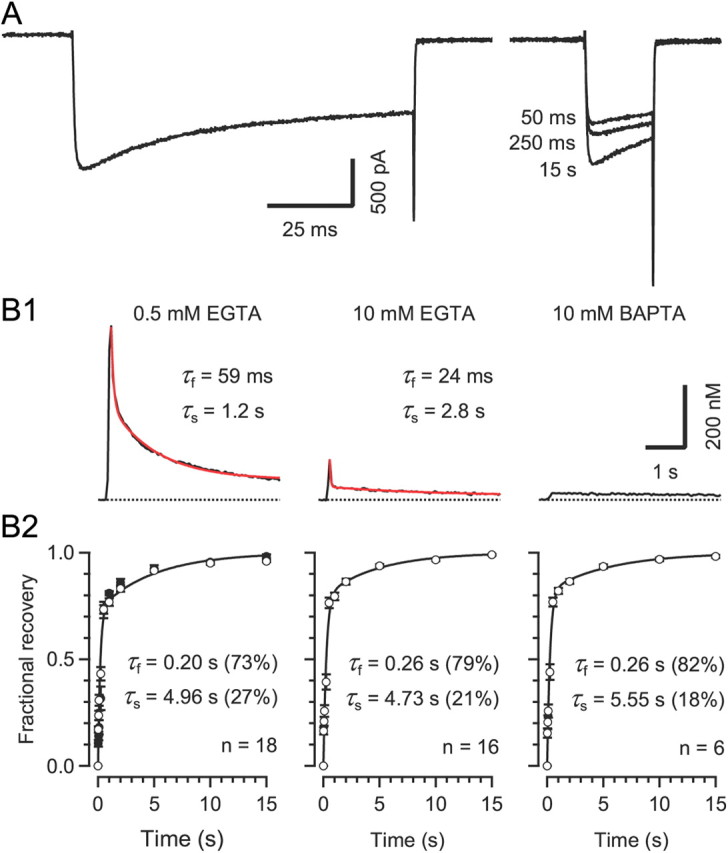
Two kinetically distinct components of ICa(V) inactivation during sustained depolarizations: fast and Ca2+ dependent and slow and Ca2+ independent. A, Presynaptic ICa(V) elicited by 1 s depolarizations from Vh = −80 mV and recorded with either Ca2+ (voltage steps to 0 mV, left) or Ba2+ (voltage steps to –10 mV, right) as the charge carrier. Inactivation of ICa(V) was biphasic under both conditions. However, the rapidly inactivating component was strongly reduced in amplitude when recording in Ba2+. B, Pooled results showing average values of peak amplitudes (left) and normalized fractions of fast (middle) and slowly (right) inactivating components of ICa(V). Average amplitudes of ICa(V) decreased slightly when substituting extracellular Ca2+ with Ba2+ (p = 0.11). External Ba2+ profoundly reduced the amplitude of the fast inactivating component of ICa(V) (p < 0.001) while leaving the slowly inactivating component unaltered (p = 0.9). C, Supplementing the pipette solution with the fast Ca2+ chelator BAPTA at ≥10 mm slowed the inactivation time course but had little effect on the amount of ICa(V) inactivation during 100 ms steps to 0 mV. C1, Presynaptic ICa(V) recorded with either Ca2+ or Na+ as the charge carrier (left) and different concentrations of Ca2+ chelators in the patch pipette (right). For comparison, ICa(V) recorded in divalent free external solution is shown (second trace). C2, Corresponding ΔCm traces. Filled and empty symbols denote the same recordings as in C1. As expected, ΔCm responses were strongly attenuated in the presence of ≥10 mm intracellular Ca2+ chelator. D, Pooled results showing average values for the amount of inactivation, inactivation time constant and vesicle exocytosis. The amount of inactivation during 100 ms depolarizations was similar for all four recording conditions (p = 0.58, ANOVA), while the rate of inactivation of ICa(V) decreased with high concentrations of BAPTA in the pipette solution.
To corroborate that a Ca2+-dependent mechanism is responsible for the fast component of ICa(V) inactivation, we compared ICa(V) recorded in nominally Ca2+-free solution with that obtained under control conditions. Figure 1C1 illustrates that ICa(V) inactivation was nearly absent in Ca2+-free bath solution with Na+ as the charge carrier (Ca2+-free: 4.6 ± 1.1%, n = 7; 2 mm external Ca2+: 45.9 ± 1.1%, n = 12, p < 0.001) (Forsythe et al., 1998). We next tested whether increasing the intracellular Ca2+ buffering strength affects ICa(V) inactivation during 100 ms steps. Figure 1C1 exemplifies ICa(V) recorded with pipette solutions containing variable chelator species and concentrations. Supplementing the pipette solution with high concentrations of the fast Ca2+ buffer BAPTA slowed the time course of current inactivation. When fit with a single exponential function, the time constants of ICa(V) inactivation were 33.3 ± 1.3 (n = 12), 34.4 ± 3.1 (p = 0.99, n = 9), 44.7 ± 3.6 (p = 0.03, n = 19), and 53.0 ± 2.7 (p < 0.001, n = 15) ms for 0. 5 mm EGTA, 10 mm EGTA, 10 mm BAPTA, and 30 mm BAPTA, respectively (Dunnett test) (Fig. 1C1,D). When external Ca2+ was replaced by Ba2+, ICa(V) decayed much slower (time constant 101.2 ± 25.5 ms, n = 13) (compare Fig. 1A). The level of ICa(V) inactivation during 100 ms steps was, however, insensitive to changes in the Ca2+ buffering strength (45.9 ± 1.1% [0.5 mm EGTA, n = 12] vs 43.6 ± 1.9% [10 mm EGTA, n = 9] vs 42.3 ± 2.2% [10 mm BAPTA, n = 19] versus 44.6 ± 1.6% [30 mm BAPTA, n = 15], p = 0.58, ANOVA) (Fig. 1D). Expectedly, ΔCm responses were nearly completely abolished with high concentrations of EGTA or BAPTA in the pipette solution (Fig. 1C2,D) (Borst et al., 1995).
Because even a high concentration (30 mm) of the fast Ca2+ buffer BAPTA was unable to effectively lower the amount of ICa(V) inactivation during 100 ms depolarizations (Fig. 1D), mechanisms other than Ca2+-dependent inactivation of ICa(V) may alternatively or additionally account for the Ca2+ current decline. We therefore considered the following two possibilities: (1) activation of pre- and/or postsynaptic Ca2+-permeable conductances may cause a depletion of Ca2+ ions from the synaptic cleft (Borst and Sakmann, 1999); or (2) metabotropic receptors could be directly [metabotropic glutamate receptors (mGluRs)] or indirectly [cannabinoid receptors (CBRs)] activated by released glutamate and thereby attenuate ICa(V) (Takahashi et al., 1996; Kushmerick et al., 2004). Metabotropic GluRs have been localized synaptically and extrasynaptically in the calyx terminal (Elezgarai et al., 1999, 2001). To test whether released glutamate is able to escape the synaptic cleft and activate extrasynaptic GluRs, we recorded from pairs of calyx terminals and neighboring principal MNTB neurons (Fig. 2A). Upon presynaptic depolarization, spillover NMDA EPSCs with relatively long latency were elicited in neighboring neurons. Thus, synaptically released glutamate can also activate extrasynaptic GluRs beyond the glial sheath, at least those of relatively high affinity. The smaller amplitude, slower rise, and longer latency of these spillover EPSCs (Fig. 2A2) compared to NMDA EPSCs in postsynaptic neurons (Fig. 2A1) is consistent with a longer diffusional distance.
To test for a contribution of metabotropic feedback inhibition and/or Ca2+ depletion from the synaptic cleft to presynaptic ICa(V) inactivation, we applied a mixture of antagonists with the aim of blocking all Ca2+-permeable ionotropic GluRs as well as mGluRs and CBRs (see Materials and Methods for composition). Figure 2B illustrates a paired recording of presynaptic ICa(V) and EPSCs before and after application of the antagonist mixture. While the EPSC is nearly completely abolished, ICa(V) remained virtually unchanged in the presence of antagonists. For recordings with 0.5 mm EGTA in the pipette solution, the fractional inactivation of ICa(V) during 100 ms depolarizations in the presence of antagonists in the bath (49.2 ± 2.6%, n = 8) was statistically not different (p = 0.26) from that in control solution (45.9 ± 1.1%, n = 12). Similar results were obtained with higher EGTA concentration in the pipette (43.6 ± 1.1% [n = 9] vs 44.8 ± 2.0% [n = 8], p = 0.66, 10 mm EGTA). When plotting ICa(V) inactivation as a function of peak amplitude for the entire dataset, a weak but statistically significant correlation was observed (Fig. 2C). The fractional inactivation of ICa(V) during 100 ms steps increased by ∼5.4% per nA current amplitude.
Reducing the number of functional VGCCs attenuates inactivation
In contrast to somatic VGCCs, those expressed in nerve terminals are known to cluster near release sites (Heuser and Reese, 1981; Pawson et al., 1998; Harlow et al., 2001; Nagwaney et al., 2009). Within overlapping [Ca2+]i nanodomains that build up during channel opening, intracellular chelators cannot effectively buffer [Ca2+]i. Even though individual channels transition stochastically between open and closed states during prolonged depolarizations, there may be always some open channels within a cluster. Assuming that the Ca2+ sensor mediating CDI is preassociated with the channel protein (Lee et al., 1999), it may thus be constantly exposed to elevated [Ca2+]i during depolarizations if a channel is part of a larger cluster.
We therefore asked whether a reduction in the number of functional channels would reduce the rate of ICa(V) inactivation (Soong et al., 2002; Kreiner et al., 2010). Figure 3A shows that this is indeed the case. When the irreversible CaV2.1 channel blocker ω-AgaTX was applied to the bath solution, not only did the amplitude of ICa(V) become smaller but its inactivation time constant more than doubled from 43.5 ± 3.5 ms (control) to 92.7 ± 17.7 ms (at ∼50% current block) (p = 0.03, paired t test) and the fractional inactivation decreased notably from 47.8 ± 2.8% (control) to 34.7 ± 1.5% (at ∼50% current block) (p = 0.02, paired t test) (Fig. 3A1,A2). In contrast, gradually reducing ICa(V) by slow bath perfusion with a low Ca2+ solution neither affected fractional inactivation (46.1 ± 2.5% vs 45.6 ± 2.4% for control and 50% current reduction, respectively; p = 0.72, paired t test) nor inactivation rate (49.2 ± 7.3 ms vs 49.9 ± 8.6 ms for control and 50% current reduction, respectively; p = 0.87, paired t test) (Fig. 3B1,B2). Both sets of experiments were performed under conditions that nearly completely prevent a rise in global [Ca2+]i (10 mm BAPTA in the pipette solution; see also Fig. 4B1 below) and thus isolate the effect of the local [Ca2+]i domains on ICa(V) inactivation. Linear regression analysis of scatter plots of ICa(V) inactivation versus normalized peak amplitudes measured after selected degrees of current reduction (0, ∼33, ∼50, and ∼66%) is shown in Figure 3C. When ICa(V) was gradually reduced by application of ω-AgaTX, fractional inactivation and normalized amplitudes were highly correlated, whereas the slope of the regression line was not statistically significantly different from zero for the data obtained with low Ca2+ bath perfusion (Fig. 3C).
Figure 4.
Recovery of ICa(V) from inactivation is intrinsically slow, regardless of the Ca2+ buffering conditions A, Recovery of ICa(V) from inactivation was tested at variable intervals using a paired-pulse protocol consisting of a 100 ms depolarization to 0 mV followed by a 20 ms depolarization to 0 mV at variable interstimulus interval. Pipette solution contained 0.5 mm EGTA. Traces for three different recovery intervals are shown superimposed. B, The time course of recovery from inactivation was biphasic and insensitive to changes in Ca2+ chelator species and/or concentrations in the pipette solution. B1, [Ca2+]i transients evoked by 100 ms step depolarizations. The rise of global [Ca2+]i was nearly completely suppressed when adding 10 mm BAPTA to the pipette solution (right panel).B2, Average time course of recovery from inactivation. Solid lines represent double exponential fits. Fast and slow time constants were similar for the three [Ca2+]i buffering conditions (p ≥ 0.56, ANOVA). Relative amplitudes of fast and slow time constants are given in parentheses. The recovery time course following a shorter (50 ms) conditioning depolarization was virtually unchanged (filled symbols in the left panel).
Since only decreasing the density of functional channels reduced inactivation of ICa(V) notably, we tentatively postulate that presynaptic VGCCs must be arranged in such a geometrical configuration that blocking individual channels reduces the time integral of [Ca2+]i experienced by the Ca2+ sensor for CDI more effectively than decreasing Ca2+ flux by reducing external Ca2+. Alternatively, ICa(V) inactivation may slow down because of a larger relative contribution of ω-AgaTX-resistant channels with possibly different inactivation properties to the whole-cell current. However, this seems unlikely because the fractional inactivation of presynaptic ICa(V) in CaV2.1 deficient mice was essentially equal to that measured in wild-type terminals (44.5 ± 1.8% [n = 18] vs 44.8 ± 2.4% [n = 12], p = 0.93; Fig. 3D).
During postnatal maturation of the calyx synapse, larger active zones seem to disappear in favor of smaller ones (Taschenberger et al., 2002), and the number of VGCCs associated with individual docked vesicles seems to decrease (Fedchyshyn and Wang, 2005; Wang et al., 2008). These developmental changes may result in smaller VGCC clusters in more mature calyces compared to P8–10 calyces. We therefore asked whether ICa(V) inactivation may decline with age. Indeed, the fractional inactivation of ICa(V) was strongly reduced in P14–16 calyces (31.0 ± 1.7%, τ = 49.0 ± 5.3 ms, n = 11) compared to younger terminals, and it was further attenuated when recording with a pipette solution supplemented with high concentration of BAPTA (12.8 ± 2.4%, τ = 125.7 ± 51.8 ms, n = 6, p < 0.001) (Fig. 3E1,E2).Together, these results support the notion that a tight clustering of presynaptic VGCCs in the calyx terminal may promote the relative insensitivity of ICa(V) inactivation to Ca2+ chelators. The developmental or experimental decrease in the number of channels per cluster may allow fast chelators such as BAPTA to more effectively antagonize inactivation.
Recovery of ICa(V) from inactivation
During repetitive AP firing, the modulation of AP-evoked presynaptic Ca2+ influx by VGCC inactivation critically depends on the rate of recovery of ICa(V) from inactivation. To measure the recovery time course of calyceal VGCCs, we used a paired-pulse protocol consisting of a 100 ms depolarization to 0 mV followed by 20 ms steps at various recovery time intervals between 25 ms and 15 s (Fig. 4). The recovery of ICa(V) from inactivation was surprisingly slow and followed a biphasic time course with a fast recovery time constant of ∼0.2 s and a slow recovery time constant of ∼5 s (Fig. 4B). The time course of the fractional recovery was fit with a double exponential function 1 − a × e−t/τf − (1 − a) × e−t/τs, where τf and τs represent the fast and slow time constants, and a is the fraction of the fast recovery (Fig. 4B2). To exclude the possibility that this slow recovery was caused by a delayed clearance of Ca2+ entering the terminals during the 100 ms depolarization, we repeated the experiments with elevated intracellular Ca2+ chelator concentrations. As expected, the rise of global [Ca2+]i was strongly attenuated with 10 mm EGTA and nearly completely abolished with 10 mm BAPTA in the pipette solution (Fig. 4B1). In contrast, the time course of recovery from inactivation was nearly unaffected (Fig. 4B2). It is unlikely that the slow component of recovery can be attributed to the slow component of ICa(V) inactivation (see Fig. 1A), because the time course of recovery was unchanged when the duration of the conditioning depolarization was shortened from 100 to 50 ms (Fig. 4B2, left). The slow ‘intrinsic’ recovery of calyceal ICa(V) from inactivation leads to cumulative inactivation of VGCCs during repetitive stimulation and may account for the strong reduction of presynaptic Ca2+ influx observed during high-frequency stimulation (Forsythe et al., 1998; Nakamura et al., 2008).
Probing the [Ca2+]i sensitivity of ICa(V) inactivation by flash photolysis of caged Ca2+
To directly examine the Ca2+ requirements for inducing ICa(V) inactivation, we used Ca2+ uncaging while monitoring [Ca2+]i. In a first set of experiments, a UV-light flash was delivered during a 100 ms depolarization to 0 mV to produce a rapid, step-like elevation of the global, volume-averaged [Ca2+]i. (Fig. 5). To monitor [Ca2+]i, either Fura 4F (low-intensity flashes) or Fura 2FF (high-intensity flashes) were included in the pipette solution. In the absence of the UV-light flash, 100 ms depolarizations resulted in an maximum elevation of [Ca2+]i to ∼15 ± 2 μm (n = 26). As illustrated in Figure 5A, increasing [Ca2+]i via Ca2+ uncaging by a few micromoles did not result in a noticeable acceleration of ICa(V) inactivation (Fig. 5A). This suggests that the Ca2+ sensor is either already saturated or ‘sees’ a significantly higher, possibly local [Ca2+]i signal such that a small increase in global [Ca2+]i has little further effect on the inactivation rate. To differentiate between these two possibilities, we applied a strong UV-light flash that induced an elevation of global [Ca2+]i to ∼100 μm, which resulted in a substantial acceleration of the inactivation (Fig. 5B). Three conclusions may be drawn from these experiments: (1) the accelerated decay of ICa(V) after Ca2+ uncaging directly demonstrates that ICa(V) inactivation is Ca2+-dependent; (2) the immediate change in inactivation time course following high post-flash [Ca2+]i without any noticeable delay is incompatible with a mechanism that involves a diffusible molecule and rather suggests that the Ca2+ sensor for CDI must be located on a molecule that is preassociated with VGCCs; and (3) because only large elevations in post-flash [Ca2+]i accelerated the inactivation kinetics, we postulate that during depolarizations the Ca2+ sensor experiences high [Ca2+]i, further supporting the notion that the Ca2+ sensor responsible for triggering CDI must be located within molecular distance to the channel itself.
Figure 5.
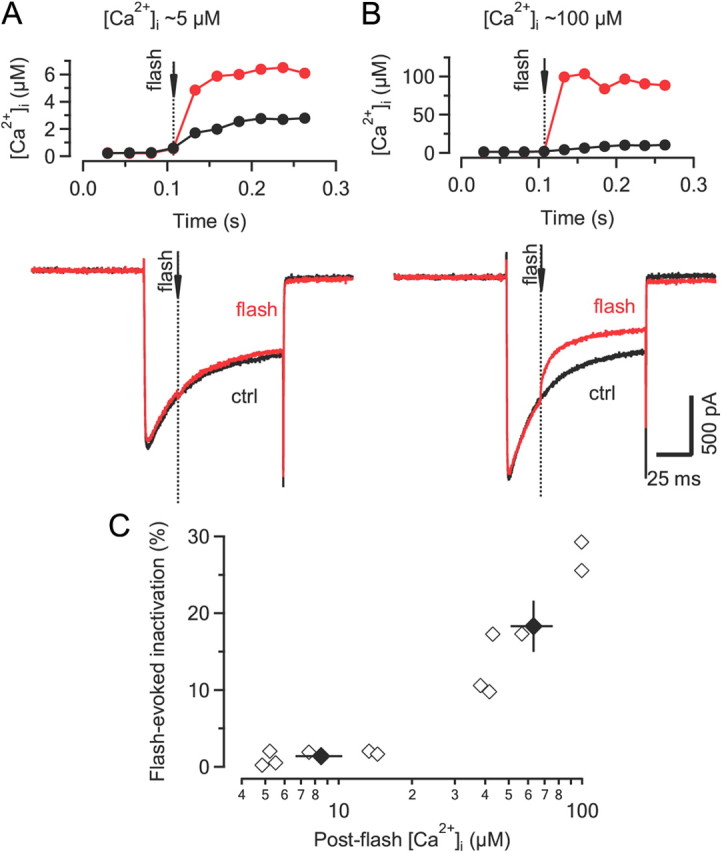
The sensor mediating Ca2+-dependent inactivation ‘sees’ high [Ca2+]i and therefore must be located within molecular distance from the channel mouth. A, ICa(V) (bottom) elicited by step depolarizations to 0 mV with (red) and without (black) a UV-light flash (dotted line) delivered ∼25 ms after current onset. Changes in [Ca2+]i are illustrated in the top panel. The rate of ICa(V) inactivation was unaltered after UV-flash uncaging despite a ∼3-fold elevation of volume-averaged global [Ca2+]i relative to control conditions (without flash). B, Similar experiment as illustrated in A except that the post-flash [Ca2+]i increased to ∼100 μm. Note the immediate acceleration of the inactivation time course after Ca2+ uncaging. ctrl, Control. C, Scatter plot of flash-evoked ICa(V) inactivation as a function of global [Ca2+]i. Flash-evoked ICa(V) inactivation was quantified as the ratio of the final ICa(V) amplitude measured after a flash compared to that of a control current. Black symbols represent mean ± SEM. for post-flash [Ca2+]i of ≤15 μm and ≥40 μm. Note that for [Ca2+]i. of ≤15 μm, inactivation of ICa(V) after Ca2+ uncaging was nearly indistinguishable from that under control conditions.
In a second set of experiments, we quantified the fractional inactivation induced by Ca2+ uncaging 56 ms before measuring ICa(V) with the principal aim of establishing the apparent dose–response relationship between ICa(V) inactivation and [Ca2+]i (Fig. 6). We elicited elevations of [Ca2+]i between 0.6 and 100 μm by adjusting flash intensity and/or DM-Nitrophen concentration in the patch pipette while monitoring [Ca2+]i. Inactivation was measured as the ratio of peak amplitudes of post-flash ICa(V) relative to a control current measured ∼20 s before the flash. The 20 s interval was long enough to allow full recovery from inactivation induced during the control depolarization (Fig. 6A1). Inactivation of ICa(V) was noticeable for post-flash [Ca2+]i ≥1 μm and severe for post-flash [Ca2+]i ≥10 μm (Fig. 6A2). The amount of inactivation did not increase when probed with a second test depolarization delivered 112 ms after a flash (twice the interval between flash and the first depolarization) (Fig. 6B). To exclude the possibilities that (1) the measured ICa(V) inactivation merely resulted from a changed driving force due to elevated cytosolic Ca2+ or (2) that the release of intracellular Ca2+ activated an outward current, we compared the I–V relationship after uncaging with that of a control current recorded before the flash by applying voltage ramps (Fig. 6C) (Morad et al., 1988). As with step depolarizations, the post-flash ICa(V) was strongly reduced in amplitude. However, its I–V relationship was virtually unaltered (Fig. 6C, inset) which is the expected behavior for an ion conductance for highly asymmetrically distributed intracellular and extracellular charge carriers. Figure 6D shows pooled data from 75 flashes in 40 terminals. The relationship between [Ca2+]i and the fractional inactivation of ICa(V) was fitted by a Hill function. The apparent half maximal inhibitory concentration (IC50) and maximal inactivation were 6.1 ± 0.8 μm and 38 ± 2%, respectively. The amount of inactivation induced by strong flashes was thus comparable to the amplitude of the fast inactivating component during sustained step depolarizations (compare Fig. 1).
Figure 6.
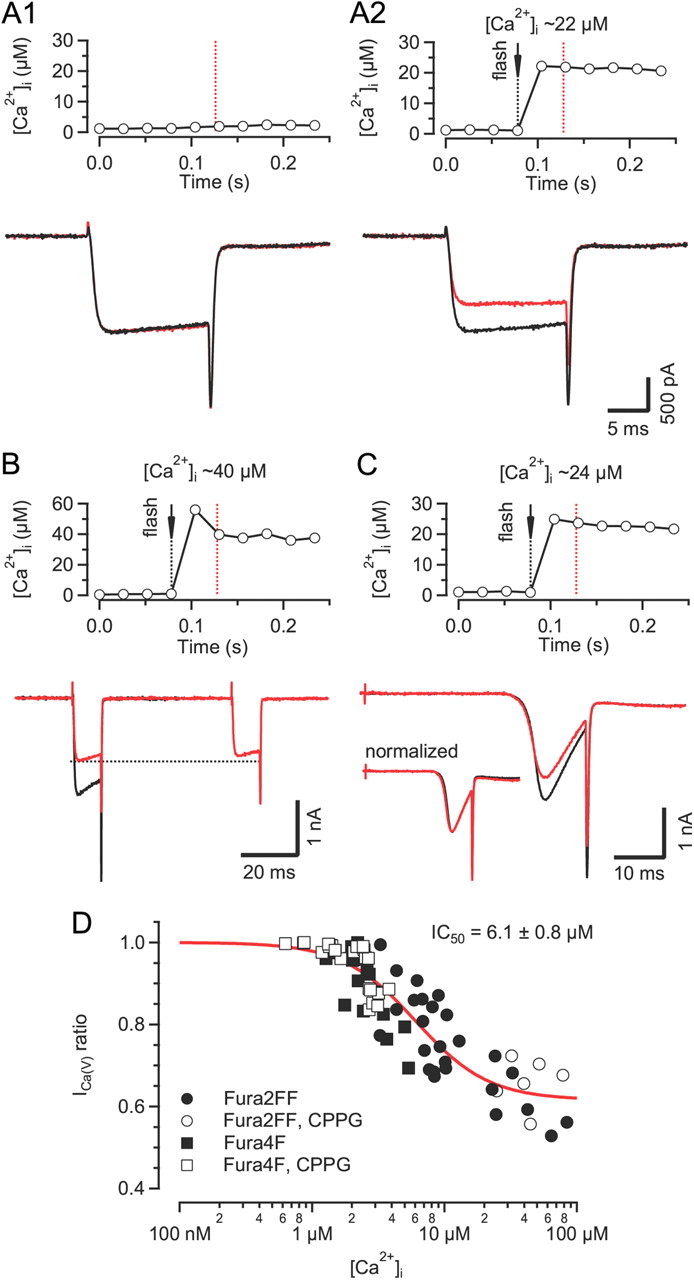
[Ca2+]i sensitivity of ICa(V) inactivation assayed by Ca2+ uncaging via UV-flash photolysis. A, Comparison of ICa(V) elicited by two step depolarizations (20 ms to 0 mV), separated by a 20 s interval, without (A1) or with (A2) a UV-light flash delivered 50 ms before the second ICa(V) (red traces). The time course of [Ca2+]i shortly before and during the second depolarization (red dotted line) is shown in the top panel. In the absence of the UV-light flash the two currents were nearly identical, indicating that a 20 s interval was sufficient to allow full recovery from the small amount of inactivation induced during the first depolarization (A1, bottom). In contrast, a global elevation of [Ca2+]i by UV-flash photolysis induced a pronounced reduction of the second current in the same terminal (A2). B, No further reduction of ICa(V) was observed when probed with an additional depolarization 112 ms after the UV-light flash. C, Similar experiment as illustrated in A except that ICa(V) was elicited by ramping Vm from −80 to +40 mV. Note the reduced current amplitude (bottom panel) but similar I–V relationship (bottom panel inset) of the second ICa(V) (red trace) following the UV-light flash. D, Dose–response relationship of Ca2+-dependent inactivation versus global [Ca2+]i. Pooled data obtained from 75 flashes in 40 terminals. Solid line represents a Hill function fitted to the data.
Characterization of ICa(V) facilitation
Among presynaptically expressed VGCCs, CaV2.1 channels are unique in that they can exhibit strong Ca2+-dependent facilitation during repetitive depolarizations (Borst and Sakmann, 1998b; Cuttle et al., 1998). We therefore set out to compare the [Ca2+]i requirements for CDF to those for inducing CDI. During repetitive, mild depolarizations, presynaptic ICa(V) showed robust facilitation. It manifested itself as a gradually accelerated current activation during the first five voltage steps. The half-rise time of ICa(V) decreased by >50% from 991 ± 88 μs to 446 ± 47 μs from the first to the 10th voltage step (Fig. 7A, top). CDF was similar in P14 when compared to P8–10 calyces, and it was virtually absent when external Ca2+ was replaced by Ba2+ (Fig. 7A, middle and bottom). To quantify CDF, we compared the charge transfer during the initial 3 ms of ICa(V) (Q3 ms(test)/Q3 ms(ctrl)) elicited by a 10 ms test pulse with and without a preceding 10 ms conditioning pulse to +20 mV (Fig. 7B1). A hyperpolarization of the terminal to −140 mV during the interpulse interval (Fig. 7B1, blue trace) did not affect the amount of facilitation, ruling out the possibility that the latter was voltage dependent rather than Ca2+ dependent (n = 5). The ratio Q3 ms(test)/Q3 ms(ctrl) showed little sensitivity to changes in the intracellular Ca2+ buffering strength (Fig. 7B2; 0.5 mm EGTA: 1.82 ± 0.06 [n = 16]; 10 mm EGTA: 1.65 ± 0.05 [n = 15]; 10 mm BAPTA: 1.65 ± 0.06 [n = 15], p = 0.6, ANOVA) and, unlike CDI (compare Fig. 4), CDF decayed very quickly with a mean time constant of ∼30 ms regardless of the type and concentration of Ca2+ chelator (Fig. 7C).
To assay the [Ca2+]i sensitivity of CDF, we elicited step-like elevations of [Ca2+]i by flash photolysis. The degree of CDF of ICa(V) elicited by Ca2+ uncaging was comparable to that elicited by conditioning prepulses (Fig. 8A). The scatter plot in Figure 8B illustrates the relationship between CDF and post-flash [Ca2+]i in the concentration range between ∼1 μm to ∼100 μm. CDF was first observed for [Ca2+]i values ≥2 μm and peaked between ∼5 μm to 10 μm. With higher [Ca2+]i, CDF was difficult to elicit because ICa(V) tended to decrease relative to control. Because we were not able to completely separate CDF from CDI, estimating its [Ca2+]i sensitivity is more difficult. To cope with these confounding effects of CDI, we fitted the data with the product of two Hill functions with the parameters for CDI fixed to the values obtained earlier (Fig. 6D) and obtained an apparent half maximum [Ca2+]i for CDF of 2.4 ± 0.7 μm (maximum CDF = 1.6 ± 0.3). The [Ca2+]i sensitivity for CDF was thus surprisingly similar to that of CDI.
Figure 8.
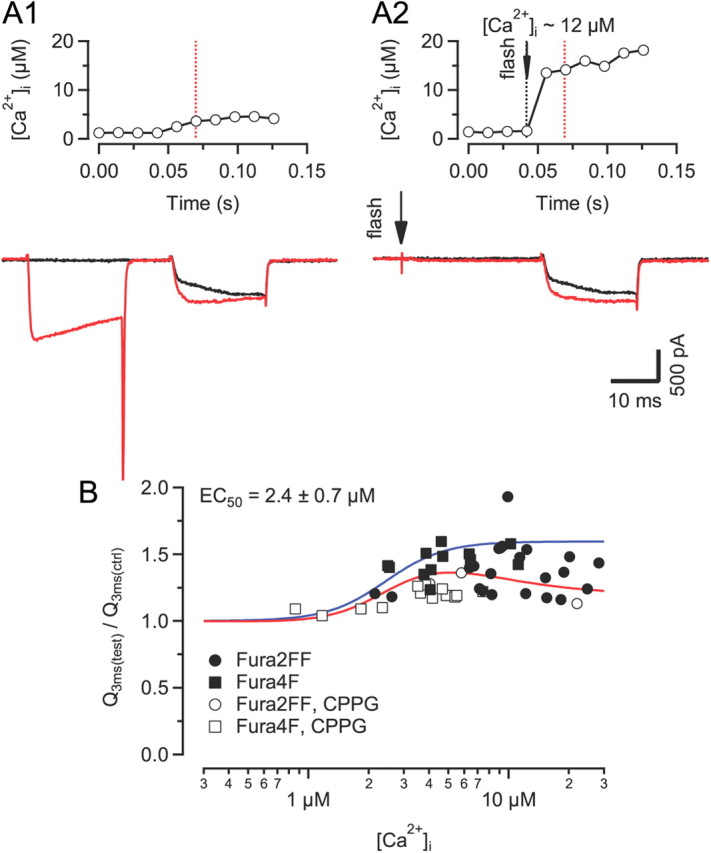
[Ca2+]i sensitivity of ICa(V) facilitation assayed by Ca2+ uncaging via UV-flash photolysis. A, Comparison of ICa(V) facilitation elicited by either prepulse (A1) or Ca2+ uncaging (A2) (red traces). The interval between the UV-light flash and the test depolarization was 20 ms. Control current traces without preceding prepulse or without Ca2+ uncaging are shown for comparison (black traces). Recordings were obtained from the same terminal. The time course of [Ca2+]i shortly before and during the second depolarization is shown in the top panel. B, Dose–response relationship of ICa(V) facilitation versus [Ca2+]i. Maximum facilitation was observed for [Ca2+]i elevations between 5 and 15 μm. At [Ca2+]i >20 μm, Ca2+-dependent inactivation of ICa(V) was observed. The solid red line represents a product of two Hill functions fitted to the data. The solid blue line represent the simulated dose–response relationship of Ca2+-dependent facilitation in the absence of ICa(V) inactivation.
Discussion
In this study, we combined whole-cell recordings of presynaptic ICa(V) with Ca2+ uncaging via flash photolysis and ratiometric Ca2+ imaging to determine the intracellular Ca2+ requirements for the induction of Ca2+-dependent inactivation and facilitation of presynaptic VGCCs. Our results indicate that (1) the sensors for CDI and CDF must be closely associated with the channel protein, (2) relative low elevations in [Ca2+]i by only a few micromoles are sufficient to induce CDI and CDF, and (3) the recovery from CDI is an order of magnitude slower than the relaxation of CDF suggesting different Ca2+ binding/unbinding kinetics. There are a number of functional implications of these findings. During sustained channel opening, we expect the Ca2+ sensors for CDI and CDF to be close to saturation. Single APs increase the global, volume averaged [Ca2+]i by ∼0.3–0.4 μm (Helmchen et al., 1997; Müller et al., 2007) at the calyx of Held, but several micromoles free Ca2+ were measured during high-frequency stimulation (Korogod et al., 2005). Thus, presynaptic Ca2+ influx can be expected to be subject to regulation by CDF and CDI during physiological spike activity. Because of its slow recovery, CDI is favored during low-frequency AP firing whereas net facilitation of ICa(V) can only be achieved by high-frequency AP bursts.
Two kinetically distinct components of inactivation
During long-lasting depolarizations the amplitude of the calyceal ICa(V) declines biexponentially (Fig. 1; Forsythe et al., 1998). Inactivation is absent in Ca2+-free bath solution and intracellular Ca2+ uncaging causes a similar inactivation of ICa(V) in the absence of channel opening. The maximum inactivation observed after flash photolysis was comparable to that seen during 100 ms depolarizations. These results directly demonstrate that elevated [Ca2+]i causes ICa(V) inactivation and suggest that CDI accounts for the majority of the fast component of inactivation. Because substituting external Ca2+ by Ba2+ had little effect on the slow inactivation, we assume that voltage-dependent inactivation (Cox and Dunlap, 1994; Patil et al., 1998) accounts for a majority of the slow inactivation.
Glutamate release-dependent decrease of ICa(V)?
Since presynaptic depolarization can trigger the release of large amounts of glutamate from the calyx, we had to consider a negative regulation of ICa(V) by activation of mGluRs (Takahashi et al., 1996) or via retroinhibition by cannabinoids acting on CB1Rs (Kushmerick et al., 2004). Additionally or alternatively, a decrease in ICa(V) amplitude could be caused by depletion of Ca2+ ions from the synaptic cleft because of concomitant activation of postsynaptic Ca2+-permeable GluR channels (Borst and Sakmann, 1999). All of the aforementioned mechanisms of ICa(V) inactivation are ‘release-dependent’, i.e., they require activation of pre- and/or postsynaptic GluRs by synaptically released glutamate. Given that high concentrations of intracellular Ca2+ chelators which strongly attenuate transmitter release in the young calyx of Held (Borst et al., 1995) did not notably change the amount of CDI, we conclude that glutamate release-dependent mechanisms do not prominently contribute to the fast inactivation of ICa(V). This conclusion was further substantiated by paired recordings of ICa(V) and EPSCs which revealed no change in the inactivation kinetics of ICa(V) in the presence of a mixture of antagonists blocking both Ca2+ entry through ionotropic GluRs and metabotropic feedback inhibition of ICa(V).
Little sensitivity of ICa(V) inactivation to intracellular chelators
In some neurons (Kasai and Aosaki, 1988; Cox and Dunlap, 1994; Grant and Fuchs, 2008; Benton and Raman, 2009) and for certain subunit combinations of heterologously expressed VGCCs (Lee et al., 2000; Kreiner and Lee, 2006), CDI can be effectively antagonized by high concentrations of intracellular Ca2+ buffers. In the calyx of Held, a high intracellular Ca2+ buffering strength slows its time course but has little effect on the amount of CDI (Fig. 1, see also Forsythe et al., 1998; Borst and Sakmann, 1999). We speculate that a tight clustering of presynaptic VGCCs may account for this result. This conclusion was based on the following two observations: First, inactivation gradually decreases when reducing the number of functional VGCCs by means of application of the irreversible antagonists ω-AgaTX (Fig. 3A,B). Second, the rate of inactivation is substantially reduced in more mature calyces (Fig. 3C,D) whose active zones tend to have a smaller average diameter (Taschenberger et al., 2002) and possibly harbor fewer VGCCs (Fedchyshyn and Wang, 2005; Wang et al., 2008). Interestingly, somatic CaV2.1 channels in cerebellar Purkinje neurons which presumably exhibit a more homogeneous surface distribution compared to that of presynaptic VGCCs inactivate less in the presence of a high concentration of EGTA (Benton and Raman, 2009).
Because of the rapid onset kinetics of CDI after Ca2+ uncaging (Fig. 5; see also Morad et al., 1988), it is likely that the Ca2+ sensor triggering CDI is located within molecular distance to and presumably preassociated with the Ca2+ channel. If this holds true, the Ca2+ sensor will be exposed to the micro- or nanodomain Ca2+ which builds up during channel opening and which is only weakly affected by buffers. In addition, clustering of presynaptic VGCCs at the active zone may lead to a scenario in which the Ca2+ sensor for inactivation is constantly exposed to high [Ca2+]i during membrane depolarizations regardless of the stochastic opening and closing of individual channels. If the average number of VGCCs in a channel cluster is reduced, either experimentally by applying an open channel blocker or during synapse maturation, Ca2+ chelators with a rapid binding kinetics may become more efficient in attenuating [Ca2+]i at the sensor. This may explain why reducing the number of available VGCCs by applying ω-AgaTX also led to a concomitant decrease of ICa(V) inactivation and also the significantly reduced ICa(V) inactivation in more mature terminals. Additionally, alternative splicing of the pore-forming α12.1 subunit (Soong et al., 2002) as well as changes in expression of auxiliary VGCC subunits may contribute to the developmental decline in CDI at the calyx of Held. For example, expression of the β2a subunit which produces slower inactivation of ICa(V) than other β subunits (Lee et al., 2000) may increase postnatally in the developing calyx.
Similar intracellular Ca2+ requirements for CDI and CDF
When probing their [Ca2+]i sensitivity by Ca2+ uncaging, we found that both regulatory pathways, CDI as well as CDF, could be activated by relatively low elevations of [Ca2+]i (<10 μm) implying a high affinity of the corresponding Ca2+ sensors. The high Ca2+ sensitivity of CDF is consistent with the finding that the calyceal ICa(V) facilitates strongly after conditioning sustained presynaptic depolarizations of small amplitude that do not trigger appreciable whole-cell Ca2+ currents (Hori and Takahashi, 2009). Assuming that the effector molecules inducing CDI and CDF are closely associated with VGCCs and thus are exposed to the Ca2+ micro- or nanodomains, the sensors may be nearly saturated during sustained channel opening. The similar affinity of their Ca2+ sensors on the one hand and >10-fold different recovery time constants (compare Figs. 4 and 7C) on the other hand suggest very different Ca2+ binding and unbinding kinetic for CDI and CDF. If the Ca2+ sensor for CDI binds Ca2+ much more slowly than that for CDF, its occupancy will remain low during very brief, AP-like Ca2+ transients. Short high-frequency AP trains therefore favor CDF that may be followed by CDI during prolonged AP trains. In contrast, its rapid relaxation prevents accumulation of CDF during low-frequency trains.
Physiological implications of CDI and CDF at the calyx of Held
Auditory brainstem circuits discharge at high rates during sound stimulation and show varying levels of spontaneous AP firing even in the complete absence of sound (Friauf and Ostwald, 1988; Taberner and Liberman, 2005; Tolnai et al., 2008; Sonntag et al., 2009). Within the MNTB of adult rats, spontaneous discharge rates vary between zero and 133 Hz (mean 29 Hz, Tolnai et al., 2008). Similar values have been reported for gerbils (mean 25 Hz, Hermann et al., 2007). Even higher spontaneous rates were measured in adult mice (mean 71 Hz, range 0.4–174 Hz, Lorteije et al., 2009). Such presynaptic firing rates will lead to a significant increase in presynaptic resting [Ca2+]i levels because individual AP-evoked [Ca2+]i transients summate (Korogod et al., 2005; Habets and Borst, 2006; Müller et al., 2007) and residual [Ca2+]i will equilibrate with endogenous buffers and prevent them from binding incoming Ca2+ (Felmy et al., 2003). Therefore, presynaptic VGCCs in some calyces may be permanently in a partially inactivated state which may contribute to the lower release probability under in vivo compared to slice conditions (Lorteije et al., 2009). Surprisingly though, in recordings of trains of AP-like presynaptic ICa(V) in mouse endbulb of Held terminals which like calyces of Held predominantly express CaV2.1 VGCCs, inactivation was completely absent (Lin et al., 2011, their Fig. 9). Facilitation of presynaptic Ca2+ influx during brief high-frequency AP bursts may counteract synaptic depression caused by vesicle depletion and/or postsynaptic desensitization. On the other hand, clearance of Ca2+ accelerates with development (Chuhma and Ohmori, 2001) and the expression of calcium-binding proteins strongly increases (Lohmann and Friauf, 1996; Felmy and Schneggenburger, 2004) which may significantly limit the impact of CDI in the mature calyx of Held.
Footnotes
We thank Dr. H.-S. Shin for providing the α1A−/− mice. We are grateful to Erwin Neher for continuous support and advice and for critically reading an earlier version of this manuscript. We also thank I-Wen Chen, Dmitry Bibichkov, and Andrew Woehler for valuable discussions, F. Würriehausen for expert advice on programming, and S. Schmidt and I. Herfort for excellent technical assistance.
References
- Adams PJ, Rungta RL, Garcia E, van den Maagdenberg AM, MacVicar BA, Snutch TP. Contribution of calcium-dependent facilitation to synaptic plasticity revealed by migraine mutations in the P/Q-type calcium channel. Proc Natl Acad Sci U S A. 2010;107:18694–18699. doi: 10.1073/pnas.1009500107. [DOI] [PMC free article] [PubMed] [Google Scholar]
- Benton MD, Raman IM. Stabilization of Ca current in Purkinje neurons during high-frequency firing by a balance of Ca-dependent facilitation and inactivation. Channels (Austin) 2009;3:393–401. doi: 10.4161/chan.3.6.9838. [DOI] [PMC free article] [PubMed] [Google Scholar]
- Borst JG, Sakmann B. Calcium current during a single action potential in a large presynaptic terminal of the rat brainstem. J Physiol. 1998a;506:143–157. doi: 10.1111/j.1469-7793.1998.143bx.x. [DOI] [PMC free article] [PubMed] [Google Scholar]
- Borst JG, Sakmann B. Facilitation of presynaptic calcium currents in the rat brainstem. J Physiol. 1998b;513:149–155. doi: 10.1111/j.1469-7793.1998.149by.x. [DOI] [PMC free article] [PubMed] [Google Scholar]
- Borst JG, Sakmann B. Depletion of calcium in the synaptic cleft of a calyx-type synapse in the rat brainstem. J Physiol. 1999;521:123–133. doi: 10.1111/j.1469-7793.1999.00123.x. [DOI] [PMC free article] [PubMed] [Google Scholar]
- Borst JG, Helmchen F, Sakmann B. Pre- and postsynaptic whole-cell recordings in the medial nucleus of the trapezoid body of the rat. J Physiol. 1995;489:825–840. doi: 10.1113/jphysiol.1995.sp021095. [DOI] [PMC free article] [PubMed] [Google Scholar]
- Chaudhuri D, Issa JB, Yue DT. Elementary mechanisms producing facilitation of Cav2.1 (P/Q-type) channels. J Gen Physiol. 2007;129:385–401. doi: 10.1085/jgp.200709749. [DOI] [PMC free article] [PubMed] [Google Scholar]
- Chuhma N, Ohmori H. Differential development of Ca2+ dynamics in presynaptic terminal and postsynaptic neuron of the rat auditory synapse. Brain Res. 2001;904:341–344. doi: 10.1016/s0006-8993(01)02506-9. [DOI] [PubMed] [Google Scholar]
- Cox DH, Dunlap K. Inactivation of N-type calcium current in chick sensory neurons: calcium and voltage dependence. J Gen Physiol. 1994;104:311–336. doi: 10.1085/jgp.104.2.311. [DOI] [PMC free article] [PubMed] [Google Scholar]
- Cuttle MF, Tsujimoto T, Forsythe ID, Takahashi T. Facilitation of the presynaptic calcium current at an auditory synapse in rat brainstem. J Physiol. 1998;512:723–729. doi: 10.1111/j.1469-7793.1998.723bd.x. [DOI] [PMC free article] [PubMed] [Google Scholar]
- DeMaria CD, Soong TW, Alseikhan BA, Alvania RS, Yue DT. Calmodulin bifurcates the local Ca2+ signal that modulates P/Q-type Ca2+ channels. Nature. 2001;411:484–489. doi: 10.1038/35078091. [DOI] [PubMed] [Google Scholar]
- Elezgarai I, Benítez R, Mateos JM, Lázaro E, Osorio A, Azkue JJ, Bilbao A, Lingenhoehl K, Van Der Putten H, Hampson DR, Kuhn R, Knöpfel T, Grandes P. Developmental expression of the group III metabotropic glutamate receptor mGluR4a in the medial nucleus of the trapezoid body of the rat. J Comp Neurol. 1999;411:431–440. doi: 10.1002/(sici)1096-9861(19990830)411:3<431::aid-cne6>3.0.co;2-r. [DOI] [PubMed] [Google Scholar]
- Elezgarai I, Bilbao A, Mateos JM, Azkue JJ, Benítez R, Osorio A, Díez J, Puente N, Doñate-Oliver F, Grandes P. Group II metabotropic glutamate receptors are differentially expressed in the medial nucleus of the trapezoid body in the developing and adult rat. Neuroscience. 2001;104:487–498. doi: 10.1016/s0306-4522(01)00080-x. [DOI] [PubMed] [Google Scholar]
- Erazo-Fischer E, Striessnig J, Taschenberger H. The role of physiological afferent nerve activity during in vivo maturation of the calyx of Held synapse. J Neurosci. 2007;27:1725–1737. doi: 10.1523/JNEUROSCI.4116-06.2007. [DOI] [PMC free article] [PubMed] [Google Scholar]
- Fedchyshyn MJ, Wang LY. Developmental transformation of the release modality at the calyx of held synapse. J Neurosci. 2005;25:4131–4140. doi: 10.1523/JNEUROSCI.0350-05.2005. [DOI] [PMC free article] [PubMed] [Google Scholar]
- Felmy F, Schneggenburger R. Developmental expression of the Ca2+-binding proteins calretinin and parvalbumin at the calyx of Held of rats and mice. Eur J Neurosci. 2004;20:1473–1482. doi: 10.1111/j.1460-9568.2004.03604.x. [DOI] [PubMed] [Google Scholar]
- Felmy F, Neher E, Schneggenburger R. Probing the intracellular calcium sensitivity of transmitter release during synaptic facilitation. Neuron. 2003;37:801–811. doi: 10.1016/s0896-6273(03)00085-0. [DOI] [PubMed] [Google Scholar]
- Forsythe ID, Tsujimoto T, Barnes-Davies M, Cuttle MF, Takahashi T. Inactivation of presynaptic calcium current contributes to synaptic depression at a fast central synapse. Neuron. 1998;20:797–807. doi: 10.1016/s0896-6273(00)81017-x. [DOI] [PubMed] [Google Scholar]
- Friauf E, Ostwald J. Divergent projections of physiologically characterized rat ventral cochlear nucleus neurons as shown by intra-axonal injection of horseradish peroxidase. Exp Brain Res. 1988;73:263–284. doi: 10.1007/BF00248219. [DOI] [PubMed] [Google Scholar]
- Grant L, Fuchs P. Calcium- and calmodulin-dependent inactivation of calcium channels in inner hair cells of the rat cochlea. J Neurophysiol. 2008;99:2183–2193. doi: 10.1152/jn.01174.2007. [DOI] [PubMed] [Google Scholar]
- Grynkiewicz G, Poenie M, Tsien RY. A new generation of Ca2+ indicators with greatly improved fluorescence properties. J Biol Chem. 1985;260:3440–3450. [PubMed] [Google Scholar]
- Habets RL, Borst JG. An increase in calcium influx contributes to post-tetanic potentiation at the rat calyx of Held synapse. J Neurophysiol. 2006;96:2868–2876. doi: 10.1152/jn.00427.2006. [DOI] [PubMed] [Google Scholar]
- Harlow ML, Ress D, Stoschek A, Marshall RM, McMahan UJ. The architecture of active zone material at the frog's neuromuscular junction. Nature. 2001;409:479–484. doi: 10.1038/35054000. [DOI] [PubMed] [Google Scholar]
- Helmchen F, Borst JG, Sakmann B. Calcium dynamics associated with a single action potential in a CNS presynaptic terminal. Biophys J. 1997;72:1458–1471. doi: 10.1016/S0006-3495(97)78792-7. [DOI] [PMC free article] [PubMed] [Google Scholar]
- Hermann J, Pecka M, von Gersdorff H, Grothe B, Klug A. Synaptic transmission at the calyx of held under in vivo like activity levels. J Neurophysiol. 2007;98:807–820. doi: 10.1152/jn.00355.2007. [DOI] [PubMed] [Google Scholar]
- Heuser JE, Reese TS. Structural changes after transmitter release at the frog neuromuscular junction. J Cell Biol. 1981;88:564–580. doi: 10.1083/jcb.88.3.564. [DOI] [PMC free article] [PubMed] [Google Scholar]
- Hori T, Takahashi T. Mechanisms underlying short-term modulation of transmitter release by presynaptic depolarization. J Physiol. 2009;587:2987–3000. doi: 10.1113/jphysiol.2009.168765. [DOI] [PMC free article] [PubMed] [Google Scholar]
- Inchauspe CG, Martini FJ, Forsythe ID, Uchitel OD. Functional compensation of P/Q by N-type channels blocks short-term plasticity at the calyx of Held presynaptic terminal. J Neurosci. 2004;24:10379–10383. doi: 10.1523/JNEUROSCI.2104-04.2004. [DOI] [PMC free article] [PubMed] [Google Scholar]
- Ishikawa T, Kaneko M, Shin HS, Takahashi T. Presynaptic N-type and P/Q-type Ca2+ channels mediating synaptic transmission at the calyx of Held of mice. J Physiol. 2005;568:199–209. doi: 10.1113/jphysiol.2005.089912. [DOI] [PMC free article] [PubMed] [Google Scholar]
- Jun K, Piedras-Rentería ES, Smith SM, Wheeler DB, Lee SB, Lee TG, Chin H, Adams ME, Scheller RH, Tsien RW, Shin HS. Ablation of P/Q-type Ca2+ channel currents, altered synaptic transmission, and progressive ataxia in mice lacking the α1A-subunit. Proc Natl Acad Sci U S A. 1999;96:15245–15250. doi: 10.1073/pnas.96.26.15245. [DOI] [PMC free article] [PubMed] [Google Scholar]
- Kasai H, Aosaki T. Divalent cation dependent inactivation of the high-voltage-activated Ca-channel current in chick sensory neurons. Pflügers Arch. 1988;411:695–697. doi: 10.1007/BF00580869. [DOI] [PubMed] [Google Scholar]
- Korogod N, Lou X, Schneggenburger R. Presynaptic Ca2+ requirements and developmental regulation of posttetanic potentiation at the calyx of Held. J Neurosci. 2005;25:5127–5137. doi: 10.1523/JNEUROSCI.1295-05.2005. [DOI] [PMC free article] [PubMed] [Google Scholar]
- Kreiner L, Lee A. Endogenous and exogenous Ca2+ buffers differentially modulate Ca2+-dependent inactivation of CaV2.1 Ca2+ channels. J Biol Chem. 2006;281:4691–4698. doi: 10.1074/jbc.M511971200. [DOI] [PubMed] [Google Scholar]
- Kreiner L, Christel CJ, Benveniste M, Schwaller B, Lee A. Compensatory regulation of CaV2.1 Ca2+ channels in cerebellar Purkinje neurons lacking parvalbumin and calbindin D-28k. J Neurophysiol. 2010;103:371–381. doi: 10.1152/jn.00635.2009. [DOI] [PMC free article] [PubMed] [Google Scholar]
- Kushmerick C, Price GD, Taschenberger H, Puente N, Renden R, Wadiche JI, Duvoisin RM, Grandes P, von Gersdorff H. Retroinhibition of presynaptic Ca2+ currents by endocannabinoids released via postsynaptic mGluR activation at a calyx synapse. J Neurosci. 2004;24:5955–5965. doi: 10.1523/JNEUROSCI.0768-04.2004. [DOI] [PMC free article] [PubMed] [Google Scholar]
- Lee A, Wong ST, Gallagher D, Li B, Storm DR, Scheuer T, Catterall WA. Ca2+/calmodulin binds to and modulates P/Q-type calcium channels. Nature. 1999;399:155–159. doi: 10.1038/20194. [DOI] [PubMed] [Google Scholar]
- Lee A, Scheuer T, Catterall WA. Ca2+/calmodulin-dependent facilitation and inactivation of P/Q-type Ca2+ channels. J Neurosci. 2000;20:6830–6838. doi: 10.1523/JNEUROSCI.20-18-06830.2000. [DOI] [PMC free article] [PubMed] [Google Scholar]
- Liang H, DeMaria CD, Erickson MG, Mori MX, Alseikhan BA, Yue DT. Unified mechanisms of Ca2+ regulation across the Ca2+ channel family. Neuron. 2003;39:951–960. doi: 10.1016/s0896-6273(03)00560-9. [DOI] [PubMed] [Google Scholar]
- Lin KH, Oleskevich S, Taschenberger H. Presynaptic Ca2+ influx and vesicle exocytosis at the mouse endbulb of Held: a comparison of two auditory nerve terminals. J Physiol. 2011;589:4301–4320. doi: 10.1113/jphysiol.2011.209189. [DOI] [PMC free article] [PubMed] [Google Scholar]
- Lindau M, Neher E. Patch-clamp techniques for time-resolved capacitance measurements in single cells. Pflügers Arch. 1988;411:137–146. doi: 10.1007/BF00582306. [DOI] [PubMed] [Google Scholar]
- Lohmann C, Friauf E. Distribution of the calcium-binding proteins parvalbumin and calretinin in the auditory brainstem of adult and developing rats. J Comp Neurol. 1996;367:90–109. doi: 10.1002/(SICI)1096-9861(19960325)367:1<90::AID-CNE7>3.0.CO;2-E. [DOI] [PubMed] [Google Scholar]
- Lorteije JA, Rusu SI, Kushmerick C, Borst JG. Reliability and precision of the mouse calyx of Held synapse. J Neurosci. 2009;29:13770–13784. doi: 10.1523/JNEUROSCI.3285-09.2009. [DOI] [PMC free article] [PubMed] [Google Scholar]
- Mochida S, Few AP, Scheuer T, Catterall WA. Regulation of presynaptic CaV2.1 channels by Ca2+ sensor proteins mediates short-term synaptic plasticity. Neuron. 2008;57:210–216. doi: 10.1016/j.neuron.2007.11.036. [DOI] [PubMed] [Google Scholar]
- Morad M, Davies NW, Kaplan JH, Lux HD. Inactivation and block of calcium channels by photo-released Ca2+ in dorsal root ganglion neurons. Science. 1988;241:842–844. doi: 10.1126/science.2457253. [DOI] [PubMed] [Google Scholar]
- Müller M, Felmy F, Schwaller B, Schneggenburger R. Parvalbumin is a mobile presynaptic Ca2+ buffer in the calyx of held that accelerates the decay of Ca2+ and short-term facilitation. J Neurosci. 2007;27:2261–2271. doi: 10.1523/JNEUROSCI.5582-06.2007. [DOI] [PMC free article] [PubMed] [Google Scholar]
- Nagwaney S, Harlow ML, Jung JH, Szule JA, Ress D, Xu J, Marshall RM, McMahan UJ. Macromolecular connections of active zone material to docked synaptic vesicles and presynaptic membrane at neuromuscular junctions of mouse. J Comp Neurol. 2009;513:457–468. doi: 10.1002/cne.21975. [DOI] [PMC free article] [PubMed] [Google Scholar]
- Nakamura T, Yamashita T, Saitoh N, Takahashi T. Developmental changes in calcium/calmodulin-dependent inactivation of calcium currents at the rat calyx of Held. J Physiol. 2008;586:2253–2261. doi: 10.1113/jphysiol.2007.142521. [DOI] [PMC free article] [PubMed] [Google Scholar]
- Neher E. Vesicle pools and Ca2+ microdomains: new tools for understanding their roles in neurotransmitter release. Neuron. 1998;20:389–399. doi: 10.1016/s0896-6273(00)80983-6. [DOI] [PubMed] [Google Scholar]
- Patil PG, Brody DL, Yue DT. Preferential closed-state inactivation of neuronal calcium channels. Neuron. 1998;20:1027–1038. doi: 10.1016/s0896-6273(00)80483-3. [DOI] [PubMed] [Google Scholar]
- Pawson PA, Grinnell AD, Wolowske B. Quantitative freeze-fracture analysis of the frog neuromuscular junction synapse–I. Naturally occurring variability in active zone structure. J Neurocytol. 1998;27:361–377. doi: 10.1023/a:1006942909544. [DOI] [PubMed] [Google Scholar]
- Schneggenburger R, Neher E. Intracellular calcium dependence of transmitter release rates at a fast central synapse. Nature. 2000;406:889–893. doi: 10.1038/35022702. [DOI] [PubMed] [Google Scholar]
- Sonntag M, Englitz B, Kopp-Scheinpflug C, Rübsamen R. Early postnatal development of spontaneous and acoustically evoked discharge activity of principal cells of the medial nucleus of the trapezoid body: an in vivo study in mice. J Neurosci. 2009;29:9510–9520. doi: 10.1523/JNEUROSCI.1377-09.2009. [DOI] [PMC free article] [PubMed] [Google Scholar]
- Soong TW, DeMaria CD, Alvania RS, Zweifel LS, Liang MC, Mittman S, Agnew WS, Yue DT. Systematic identification of splice variants in human P/Q-type channel α12.1 subunits: implications for current density and Ca2+-dependent inactivation. J Neurosci. 2002;22:10142–10152. doi: 10.1523/JNEUROSCI.22-23-10142.2002. [DOI] [PMC free article] [PubMed] [Google Scholar]
- Taberner AM, Liberman MC. Response properties of single auditory nerve fibers in the mouse. J Neurophysiol. 2005;93:557–569. doi: 10.1152/jn.00574.2004. [DOI] [PubMed] [Google Scholar]
- Takahashi T, Forsythe ID, Tsujimoto T, Barnes-Davies M, Onodera K. Presynaptic calcium current modulation by a metabotropic glutamate receptor. Science. 1996;274:594–597. doi: 10.1126/science.274.5287.594. [DOI] [PubMed] [Google Scholar]
- Taschenberger H, von Gersdorff H. Fine-tuning an auditory synapse for speed and fidelity: developmental changes in presynaptic waveform, EPSC kinetics, and synaptic plasticity. J Neurosci. 2000;20:9162–9173. doi: 10.1523/JNEUROSCI.20-24-09162.2000. [DOI] [PMC free article] [PubMed] [Google Scholar]
- Taschenberger H, Leão RM, Rowland KC, Spirou GA, von Gersdorff H. Optimizing synaptic architecture and efficiency for high-frequency transmission. Neuron. 2002;36:1127–1143. doi: 10.1016/s0896-6273(02)01137-6. [DOI] [PubMed] [Google Scholar]
- Tolnai S, Hernandez O, Englitz B, Rübsamen R, Malmierca MS. The medial nucleus of the trapezoid body in rat: spectral and temporal properties vary with anatomical location of the units. Eur J Neurosci. 2008;27:2587–2598. doi: 10.1111/j.1460-9568.2008.06228.x. [DOI] [PubMed] [Google Scholar]
- Wang LY, Neher E, Taschenberger H. Synaptic vesicles in mature calyx of Held synapses sense higher nanodomain calcium concentrations during action potential-evoked glutamate release. J Neurosci. 2008;28:14450–14458. doi: 10.1523/JNEUROSCI.4245-08.2008. [DOI] [PMC free article] [PubMed] [Google Scholar]
- Xu J, Wu LG. The decrease in the presynaptic calcium current is a major cause of short-term depression at a calyx-type synapse. Neuron. 2005;46:633–645. doi: 10.1016/j.neuron.2005.03.024. [DOI] [PubMed] [Google Scholar]