

Abstract
Lesion and functional brain imaging studies have suggested that there are two anatomically nonoverlapping attention networks. The dorsal frontoparietal network controls goal-oriented top-down deployment of attention; the ventral frontoparietal network mediates stimulus-driven bottom-up attentional reorienting. The interaction between the two networks and its functional significance has been considered in the past but no direct test has been carried out. We addressed this problem by recording fMRI data from human subjects performing a trial-by-trial cued visual spatial attention task in which the subject had to respond to target stimuli in the attended hemifield and ignore all stimuli in the unattended hemifield. Correlating Granger causal influences between regions of interest with behavioral performance, we report two main results. First, stronger Granger causal influences from the dorsal attention network (DAN) to the ventral attention network (VAN), i.e., DAN→VAN, are generally associated with enhanced performance, with right intraparietal sulcus (IPS), left IPS, and right frontal eye field being the main sources of behavior-enhancing influences. Second, stronger Granger causal influences from VAN to DAN, i.e., VAN→DAN, are generally associated with degraded performance, with right temporal-parietal junction being the main sources of behavior-degrading influences. These results support the hypothesis that signals from DAN to VAN suppress and filter out unimportant distracter information, whereas signals from VAN to DAN break the attentional set maintained by the dorsal attention network to enable attentional reorienting.
Introduction
Human visual attention is thought to be controlled by two frontoparietal networks. The dorsal attention network, comprised of bilateral frontal eye field and bilateral superior parietal lobule/intraparietal sulcus, initiates and maintains goal-directed top-down attentional control (Kastner et al., 1999; Shulman et al., 1999, 2003; Corbetta et al., 2000, 2005; Hopfinger et al., 2000; Astafiev et al., 2003; Giesbrecht et al., 2003). The ventral attention network, which is right-lateralized and contains right ventral frontal cortex and right temporal-parietal junction (rTPJ), enables stimulus-driven bottom-up attentional reorienting (Shulman et al., 1999; Corbetta et al., 2000; Astafiev et al., 2003; Kincade et al., 2005; Astafiev et al., 2006). Although it is generally believed that the effective interaction between the two networks underlies our ability to navigate complex visual environments, the neuronal mechanisms of this interaction remain not well understood. According to one hypothesis, top-down signals from the dorsal attention network to the ventral attention network suppress and filter out unimportant distracter information so that goal-oriented sensorimotor processing can proceed unimpeded, whereas the ventral attention network, upon detecting environmental stimuli not in the attentional focus, shifts attention by sending bottom-up signals to disrupt the sensorimotor processing enabled by the dorsal attention network (Corbetta et al., 2008).
Support for the hypothesis has mainly come from lesion and functional imaging studies. For example, damage to areas within the ventral attention network caused either by permanent lesion (e.g., stroke) or temporary interference (e.g., TMS) adversely impacts the ability to disengage from an existing attentional focus (Meister et al., 2006), suggesting a breakdown in communication from the orienting system to the dorsal frontoparietal structures. Functional neural imaging has shown that reorienting stimuli robustly activate both the ventral attention network and the dorsal attention network (Corbetta et al., 2002; Shulman et al., 2002, 2010; Fox et al., 2005), providing further indirect evidence of interaction. In contrast, in visual search and other demanding visual tasks, blood-oxygen level-dependent (BOLD) activity in some ventral frontoparietal regions, especially the rTPJ (Shulman et al., 2007), was suppressed (Shulman et al., 2003, 2007; Sridharan et al., 2007), and the degree of suppression is proportional to the level of task demand (Todd et al., 2005) and predicts the likelihood of target detection in the attended domain (Shulman et al., 2007).
Lesions techniques, while powerful, require perturbing the nervous system. In naturally occurring lesions such as stroke, the extent of damage is uncontrollable, with damaged tissues often spreading across multiple brain areas, confounding precise functional localization (Rorden and Karnath, 2004). Functional imaging studies have mainly relied on univariate analysis in which different brain areas are evaluated independently. While resting-state fMRI connectivity has revealed correlated BOLD variations in the dorsal and ventral attention networks (Fox et al., 2006), the commonly used measures such as temporal correlation cannot delineate the direction of signal propagation, and it is difficult to relate resting-state connectivity measures directly to behavior. These issues were overcome in this study. Collecting fMRI data from subjects performing a trial-by-trial cued spatial attention experiment, we first applied generalized liner modeling (GLM) to identify regions of interest (ROIs). Directional influences between different ROIs of the ventral and dorsal attention networks were then assessed by Granger causality and correlated with accuracy and reaction time (RT) to assess their functional relevance.
Materials and Methods
Participants.
The experimental protocol was approved by the Institutional Review Board of Beijing Normal University. Thirteen healthy right-handed individuals (aged 20–28 years; 8 females) with normal or corrected-to-normal vision gave informed consent and participated in the experiment. One male subject failed to perform the task according to instructions and his data were not analyzed.
Task.
We used a mixed blocked/event-related design. There were 12 attention blocks and 12 passive-view blocks. The experimental timeline is schematically illustrated in Figure 1A. In attention (A) blocks, the subject performed a trial-by-trial cued visual spatial attention task. At the beginning of each trial, a left- or right-pointing arrow appeared at the fixation point for 200 ms, which directed the subject to initiate and maintain covert attention to the cued hemifield. Following a 2500 ms delay, a standard or a target stimulus of 100 ms in duration appeared either inside the attended hemifield (valid trial) or inside the unattended hemifield on the opposite side (invalid trial). The standard stimulus was a circular checkerboard. The target stimulus was also a circular checkerboard but of a slightly smaller diameter (Rajagovindan and Ding, 2011). The standard stimulus appeared 80% of the time with 50% validity and the target stimulus appeared 20% of the time with 50% validity. The trials were pseudorandomly arranged so that the number of valid trials and the number of invalid trials in each block were evenly matched. Participants were required to make a speedy key-press response only to the valid targets. In passive-view (B) blocks, the schedule of stimulus presentation remained the same, but neither attention nor response was required; the subject simply maintained fixation. The two types of blocks were arranged in an ABBA or BAAB order in each run (session). For each participant, three ABBA runs and three BAAB runs were arranged in an interleaved fashion. Each block lasted ∼60 s (15 trials), with 20 s fixation periods inserted between successive blocks.
Figure 1.
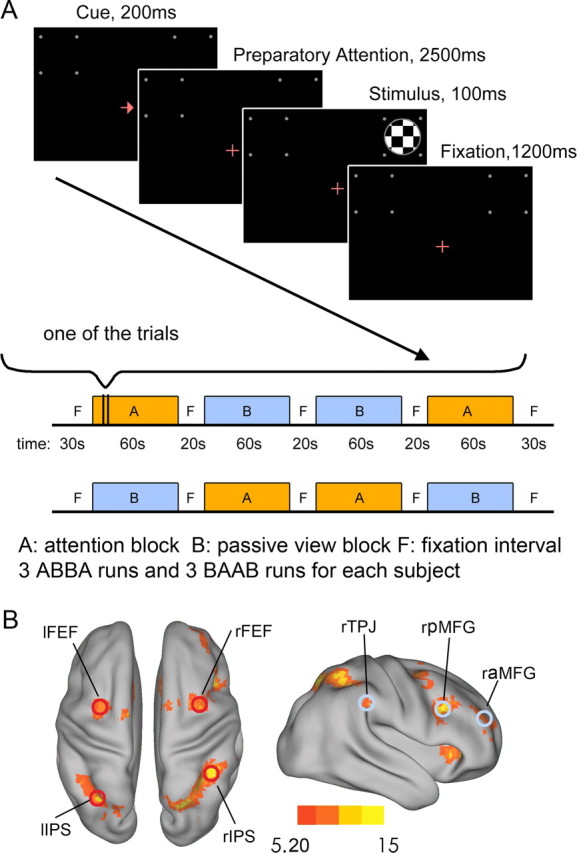
Schematic of the experimental paradigm and definition of ROIs. A, A mixed-block/event-related design was used. In 12 attention blocks (A blocks), the subjects performed a trial-by-trial cued spatial attention task. At the beginning of each trial, the fixation cross was transiently replaced by a left- or right-pointing arrow, which directed the subject to initiate and maintain covert attention to the cued hemifield. Following a delay, standard or target stimuli appeared in either the attended hemifield or unattended hemifield. The subject responded to the small probability target stimuli in the attended hemifield by a button press and ignored all stimuli in the unattended hemifield. In 12 passive-view blocks (B blocks), stimuli were presented in the same way as in attention blocks but the subjects were only required to fixate. F denotes a period of fixation with no visual stimulation. B, Group activation (n = 12) by contrasting spatial attention condition versus passive-view condition (t > 5.20, p < 0.002, FDR-corrected). Bilateral IPS and bilateral FEF, ROIs belonging to the dorsal attention network, are marked by red circles. raMFG, rpMFG, and rTPJ, ROIs belonging to the ventral attention network, are marked by light blue circles.
Data acquisition.
MRI scanning was performed on a 3-tesla Magnetom Trio whole-body MRI system (Siemens) at the Beijing Normal University MRI Center. The functional scans were acquired with a T2*-weighed EPI sequence [echo time (TE), 30 ms; repetition time (TR), 2000 ms; flip angle, 90°], with 33 axial slices in each volume (field of view, 200 × 200 mm2; matrix size, 64 × 64; slice thickness, 3.60 mm; voxel size = 3.13 × 3.13 × 3.60 mm3). There were 180 whole-brain volumes for each of the six runs. High-resolution anatomic images were acquired with a T1-weighted 128 slice MPRAGE sequence (TR, 2530 ms; TE, 3.39 ms; flip angle, 7°; inversion time, 1100 ms; voxel size = 1 × 1.33 × 1 mm3).
GLM analysis and ROI definition.
Data preprocessing was performed using SPM2 (http://www.fil.ion.ucl.ac.uk/spm/), which included slice timing, motion correction, coregistration to individual anatomical image, normalization to the Montreal Neurological Institute (MNI) template (Friston et al., 1995), and resampling into a 3 × 3 × 3 mm3 per voxel resolution. Spatial smoothing of normalized images, which was done with an 8 mm FWHM Gaussian core, was only performed for GLM analysis, not for connectivity analysis. Global scaling was applied to remove the global signal before GLM analysis. Although the removal of global signal is debated (Zarahn et al., 1997; Aguirre et al., 1998; Glover et al., 2000; Gavrilescu et al., 2002; Macey et al., 2004; Wise et al., 2004; Junghöfer et al., 2005; Birn et al., 2006; Lund et al., 2006; Fox et al., 2009), for our data, global scaling appears to give more precisely defined regions of task activation. Two kinds of regressors, one corresponding to the attention condition and one the passive-view condition, were used to fit the GLM. Each regressor was generated by convolving the blocked rectangular function corresponding to a given experimental condition with a hemodynamic response function (HRF). Head motion parameters were not included in the GLM analysis (Johnstone et al., 2006); their inclusion appeared to lead to spurious activation effects (Schreiber and Krekelberg, 2010). In the random-effects analysis, for each subject, from the fitted GLM model, the attend condition and the passive-view condition were compared to produce the contrast image. These contrast images were fed into a GLM that implemented a one-sample t test to yield group-level activations. False discovery rate (FDR) control was applied to correct for multiple comparisons (Bennett et al., 2009; Poldrack and Mumford, 2009). ROIs for functional connectivity analysis were generated by intersecting the group activated regions (t > 5.20, p < 0.002, FDR-corrected) with spheres of 5 mm in radius centered at the voxels with maxima local t values.
Granger causality analysis.
The hypothesis we sought to test required the decomposition of neuronal interaction into its directional components. We chose Granger causality for this purpose. This choice was based on the data-driven nature of the method and our extensive experience with the method (Ding et al., 2006; Bollimunta et al., 2008, 2011). The basic idea of this method is that if the past of one time series can be used to facilitate the prediction of the future of another time series, then we say there is a Granger causal influence from the former to the latter (Granger, 1967). Recent work applying this method to fMRI data has generated insights into the functional organization of both healthy and diseased brain networks (Rypma et al., 2006; Bressler et al., 2008; Liao et al., 2010; Hamilton et al., 2011; Jiao et al., 2011). Our Granger causality analysis protocol had five steps. First, the BOLD time series from the normalized functional images before spatial smoothing was extracted from each voxel in each ROI and global effects were removed (Smith et al., 1999) using SPM2 global mean scaling function (http://www.fil.ion.ucl.ac.uk/spm/). This step makes the BOLD time series more stationary at a session level (Rogers et al., 2007; Sridharan et al., 2007). Second, for each voxel, the mean signal value during the baseline fixation period (Fig. 1A, F) was calculated, and the percentage BOLD signal was obtained by dividing the difference between the fMRI time series and the mean signal value by the mean signal value. While this step is not required for Granger causality analysis, it helps with the visual inspection of the BOLD data. Third, for each attention block, the first five time points (10 s) were discarded (Garrett et al., 2011) to eliminate transient effects, and the remaining data across 12 attention blocks were averaged to obtain the average task-level response. This average task-level response was subtracted from the BOLD signal in each attention block to yield the residual fluctuations, which were treated as realizations of an underlying stochastic process. Fourth, for each attention block, the temporal mean for a given residual time series was computed and removed to meet the zero-mean requirement assumed by the autoregressive (AR) model (Ding et al., 2000, 2006). Fifth, for a given pair of ROIs, Granger causality was calculated on the zero-mean residual time series following Geweke's (1982) formulation (Ding et al., 2006) for all pairwise combinations of voxels and averaged. The order of the AR model was chosen to be 1 based on Bayesian information criterion (Roebroeck et al., 2005; Bressler et al., 2008; Hamilton et al., 2011).
Linking brain activity with behavior.
Behavioral performance was assessed by accuracy and RT. The accuracy for each attention block was defined as the ratio between the number of correctly performed trials and the total number of trials. The RT for each attention block is the mean reaction time to attended targets. For a missed target in the valid hemifield, the RT for that trial was set at 2 times the participant's average RT during the entire experiment, because previous behavioral studies have shown that in visual–motor experiments, RT in target-absent trials is usually twice as long as average RT of hit trials (Chun and Wolfe, 1996; Wolfe, 1998). In addition, very similar results were found if different multiplication factors, including 1.5, 1.75, and 2.25, were selected. This is understandable given that the number of missed valid target trials was very small, accounting only for 6.09% of all valid target trials.
To correlate accuracy and Granger causality, we performed the following procedure, which has proven effective in our previous electrophysiological studies (Zhang et al., 2008; Mo et al., 2011). First, for each subject, the accuracy for each of the 12 attention blocks was converted into a z-score, according to which all attention blocks were sorted in an ascending fashion from low to high. The sorted blocks were segmented into 10 accuracy groups, each consisting of three neighboring blocks. Second, for each ROI pair, Granger causality was estimated for each of three blocks in an accuracy group, averaged within the group and then across all subjects, and z-scored. Third, the population level Granger causality of each accuracy group was plotted as a function of the mean accuracy z-score of that group, and the relation between the two variables was assessed by Spearman's rank correlation.
The correlation between RT and Granger causality was calculated similarly. For each subject, the RT for each of the 12 attention blocks was converted into a z-score, according to which all attention blocks were sorted from fast to slow. Because of the valid target being infrequent and trial randomization, there were attention blocks where no valid target appeared in the attended hemifield even though the valid trials and the invalid trials remained evenly matched. For 10 subjects, there were 11 attention blocks available for correlating Granger causality and RT; for the remaining two subjects, there were 10 such blocks. As a consequence, for the 10 subjects, the sorted blocks were segmented into nine RT groups consisting of three neighboring blocks each. For the remaining two subjects, the sorted groups were also segmented into nine RT groups, with the last group consisting of two neighboring blocks. To be compatible with the convention used for accuracy, we multiplied the RT z-score by −1 so that for both accuracy and RT, larger z-scores mean better performance. Similarly, for each ROI pair, Granger causality of each block were averaged within an RT group and then across all subjects, z-scored, and plotted as a function of the mean RT z-score of that group. The relation between the two variables was assessed by Spearman's rank correlation.
For two given ROIs, A and B, there are two causal influences: A→B and B→A. If the correlation between one causal influence, say A→B, and accuracy or RT or both was significantly positive at p < 0.05, then increased A→B is associated with better behavioral performance. In contrast, if the correlation was significantly negative at p < 0.05, increased A→B is associated with worse behavioral performance. If a correlation was significantly positive for one behavioral measure but significantly negative for the other, the role of this connection would be considered ambiguous. We found no such connections in this study.
To compare methods, we also applied the above procedure to examine (1) the relation between BOLD activity level in individual ROIs and behavioral performance and (2) the relation between temporal correlation between pairs of ROIs and behavioral performance. The level of BOLD activity in each attention block was measured by averaging the percentage change signal of that block with the first five time points discarded (Garrett et al., 2011). The temporal correlation coefficient between ROIs was calculated on the same residual time series used by Granger causality analysis (Fair et al., 2007; He et al., 2007).
Our assessment of brain–behavior relationship involved multiple comparisons. Because BOLD fluctuations in different ROIs are correlated, commonly applied multiple-comparison-correction techniques such as the Bonferroni correction are not directly applicable, as they require independent comparisons. Consequently, the significance level used in our correlation analysis is uncorrected. The extensive literature on visual spatial attention provides the framework for interpreting and validating our results and guarding against false claims.
Results
Twelve subjects performed the experiment according to instructions. For each subject, reaction time and response accuracy varied from block to block. The mean reaction time was 426.80 ± 47.45 ms and the mean accuracy was 82.13 ± 8.76%.
Regions of interest
Attention blocks were contrasted against passive-view blocks to obtain brain areas activated by visual spatial attention. Figure 1B shows voxelwise t values (t > 5.20, p < 0.002, FDR-corrected) projected on a smoothed 3D brain surface template (Caret 5 visualization software; http://brainmap.wustl.edu/caret.html). The task-activated regions included areas of the dorsal attention network (DAN), including bilateral frontal eye field (FEF) and bilateral intraparietal sulcus (IPS), and areas of the ventral attention network (VAN), including rTPJ, right anterior middle frontal gyrus (raMFG), and right posterior middle frontal gyrus (rpMFG). Also activated were bilateral dorsal anterior cingulate cortex and bilateral anterior insula. These areas, variously referred to the core system (Dosenbach et al., 2006) or the task control network (Corbetta et al., 2008), are found to be activated in a wide variety of experimental conditions. Our main focus here is on the interaction between the dorsal and ventral attention networks and its behavioral consequences.
For functional connectivity analysis, the ROIs were defined by intersecting each activated brain region in the dorsal attention and ventral attention networks with a sphere with a 5 mm radius centered at the voxel with the local maximum t value (t > 8.24, p < 0.0002, FDR-corrected; Fig. 1B). Table 1 gives the MNI coordinates of the center of each ROI used in this study.
Table 1.
Center coordinates of the regions of interest in the ventral and dorsal attention networks
| ROI name | t value | p (FDR) | MNI coordinate (mm) |
||
|---|---|---|---|---|---|
| x | y | z | |||
| rIPS | 18.38 | <0.0002 | 42 | −48 | 51 |
| lIPS | 12.90 | <0.0002 | −30 | −63 | 54 |
| rFEF | 10.68 | <0.0002 | 30 | 0 | 57 |
| lFEF | 9.63 | <0.0002 | −30 | −3 | 54 |
| rpMFG | 16.56 | <0.0002 | 45 | 15 | 27 |
| raMFG | 11.48 | <0.0002 | 42 | 51 | 21 |
| rTPJ | 9.88 | <0.0002 | 42 | −48 | 36 |
Interaction between rTPJ–rIPS and behavior
To illustrate our approach, we first considered rTPJ from the ventral attention network and right IPS (rIPS) from the dorsal attention network. For each subject, the accuracy and the mean reaction time of each attention block were converted into z-scores, according to which all attention blocks were sorted in an ascending fashion into accuracy and RT groups (see Materials and Methods, above). Granger causal influences between rTPJ and rIPS were calculated for each accuracy group and for each RT group and plotted as functions of the mean group z-score. As shown in Figure 2, A and B, rTPJ→rIPS is negatively correlated with both performance measures (r = −0.68, p < 0.05 for accuracy and r = −0.67, p = 0.059 for RT), meaning that the stronger the causal driving from rTPJ to rIPS, the worse the behavioral performance. In contrast, the Granger causal influence in the opposite direction, rIPS→rTPJ (Fig. 2C,D), is positively correlated with performance (r = 0.83, p < 0.01 for accuracy and r = 0.37, p = 0.37 for RT), meaning that the stronger the driving from rIPS to rTPJ, the better the behavioral performance. BOLD activity levels in rIPS and in rTPJ were not correlated with either of the two behavioral measures (Table 2). Similarly, the temporal correlation between rIPS and rTPJ were also not correlated with either of the two behavioral measures (Fig. 3B).
Figure 2.
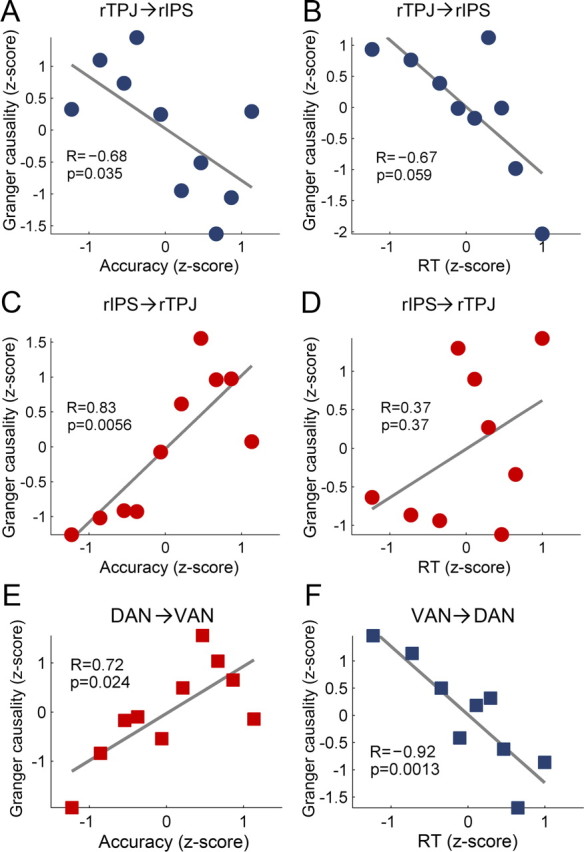
Granger causal influence and behavioral performance. A–D, Granger causal influence between rTPJ and rIPS as functions of accuracy or reaction time. Red indicates that Granger causality is positively correlated with behavioral performance (behavior-enhancing); blue indicates that Granger causality is negatively correlated with behavioral performance (behavior-degrading). Linear fits are shown where R is the Spearman correlation coefficient and p is the significance level. E, F, Granger causal influence between the DAN and the VAN as function of behavioral performance. Conventions are otherwise the same as in A–D.
Table 2.
Correlation between levels of BOLD activity and behavioral performance
| ROI | Accuracy |
Reaction time |
||
|---|---|---|---|---|
| R | p | R | p | |
| rFEF | 0.52727 | 0.1228 | 0.61667 | 0.085725* |
| lFEF | 0.63636 | 0.054445* | 0.68333 | 0.05032* |
| rIPS | 0.078788 | 0.838 | 0.66667 | 0.05889* |
| lIPS | −0.078788 | 0.838 | 0.48333 | 0.1938 |
| rTPJ | 0.090909 | 0.81142 | −0.2 | 0.6134 |
| raMFG | 0.32121 | 0.36768 | −0.35 | 0.35858 |
| rpMFG | 0.44242 | 0.2042 | −0.2 | 0.6134 |
*p < 0.1.
Figure 3.
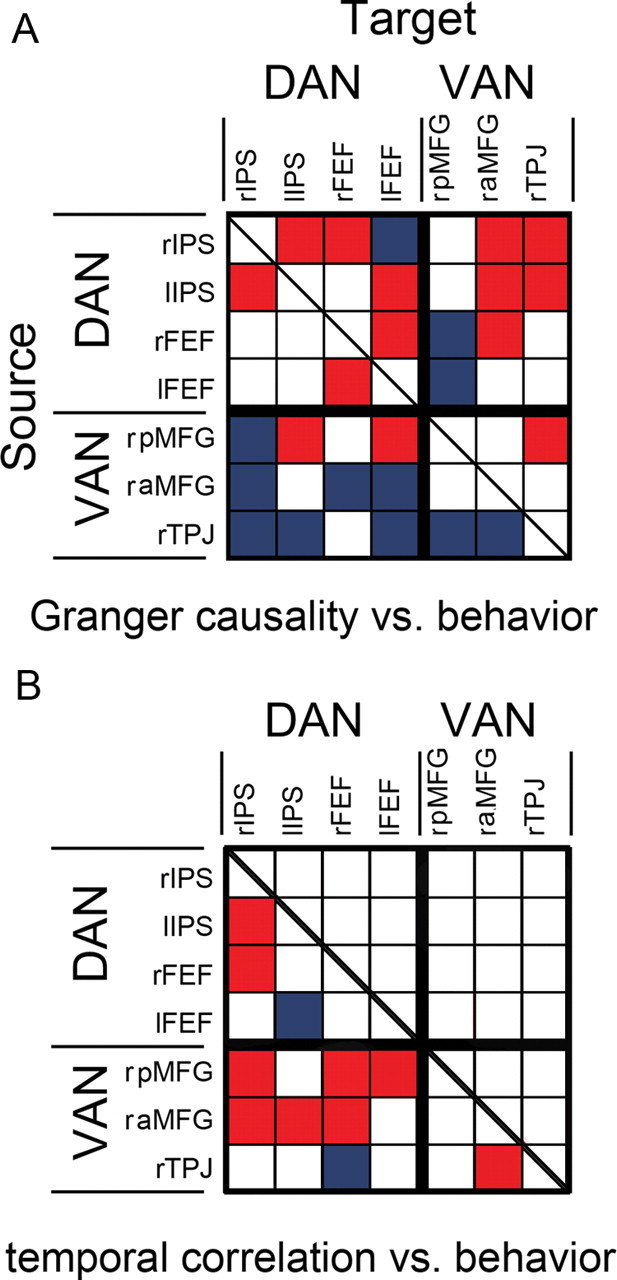
Analysis of all ROI pairs. A, Matrix view of the correlation between Granger causality and behavioral performance. Let i denote the row index and j the column index. If the (i, j) cell is red, the Granger causal influence from i to j, namely, i→j, is positively correlated with performance at p < 0.05; if it is blue, the Granger causal influence is negatively correlated with performance at p < 0.05 (see Materials and Methods). B, Matrix view of the correlation between temporal correlation coefficient and behavioral performance. If a cell is red, the temporal correlation coefficient between the pair of ROIs is positively correlated with performance at p < 0.05; if it is blue, the temporal correlation coefficient is negatively correlated with performance at p < 0.05.
Interaction at the network level
We performed the same analysis for all ROI pairs and averaged the results according to two categories: DAN→VAN and VAN→DAN. As shown in Figure 2, E and F, greater causal influences from DAN to VAN, namely increased DAN→VAN, are associated with better performance; the correlation between Granger causality and accuracy is r = 0.72 (p < 0.05). In contrast, greater causal influences in the opposite direction, namely increased VAN→DAN, are associated with worse behavioral performance; the correlation between Granger causality and RT is r = −0.92 (p < 0.005). The correlation between DAN→VAN and RT and the correlation between VAN→DAN and accuracy did not reach statistical significance. These results extend the observation made earlier for a specific ROI pair, rIPS–rTPJ in Figure 2A–D, to the network level.
Contributions of individual ROIs
We examined the contribution of each ROI by summarizing the behavioral consequences of all ROI–ROI interactions in a matrix form (Fig. 3A). The vertical axis is the source ROIs and the horizontal axis is the target ROIs. The ROI grouping is according to each ROI's putative membership in either DAN or VAN. A cell in the matrix is colored red if the directional influence it represents is significantly positively correlated with either RT or accuracy or both; in other words, red indicates behavior-enhancing influence. Similarly, a cell is colored blue if the corresponding directional influence is significantly negatively correlated with RT or accuracy or both; namely, blue indicates behavior-degrading influence. In this color scheme, the rIPS→rTPJ cell is colored red, whereas the rTPJ→rIPS cell is colored blue. Within the dorsal attention network, six of seven of the intranetwork causal influences are associated with enhanced performance; within the ventral attention network, two of three of the intranetwork causal influences were associated with degraded performance. Causal influences from rIPS, lIPS, and right FEF (rFEF) on other ROIs, including rTPJ and raMFG, are mainly associated with improved behavioral performance, whereas causal influences received by these regions from ROIs belonging to VAN are mainly associated with declined behavioral performance, with rIPS being the most prominent target of the behavior-degrading influences. In contrast, causal influences from rTPJ upon other ROIs, are negatively correlated with performance, and causal influences from raMFG upon rIPS and bilateral FEF are also negatively correlated with behavioral performance.
BOLD activity level and temporal correlation
To compare with the Granger causality results, we correlated performance with (1) levels of BOLD signal in each ROI in both attention networks and (2) temporal correlations between all pairs of ROIs. From Table 2, the levels of BOLD activity in rFEF, lFEF, and rIPS are positively correlated with performance at a relaxed significance level (p < 0.1), but for most ROIs, BOLD activity levels are not significantly correlated with either of the two behavioral measures. In Figure 3B, some temporal correlation coefficients, such as those between bilateral IPS, rFEF, and rIPS, are significantly correlated with performance, with most of these correlations being positive. For rTPJ and rIPS, there is no relationship between their temporal correlation and behavior, reflecting what was found in Figure 2, where rTPJ→rIPS and rIPS→rTPJ are oppositely correlated with performance.
Discussion
Recording fMRI data from subjects performing a trial-by-trial cued spatial visual attention experiment and combining Granger causality analysis with the naturally occurring variability in behavioral performance, we found three results. First, causal influences within the dorsal attention network and from the dorsal attention network to the ventral attention network are generally positively correlated with behavioral performance. Second, causal influences within the ventral attention network and from the ventral attention network to the dorsal attention network are generally negatively correlated with behavioral performance. Third, at the individual ROI level, rIPS, lIPS, and rFEF are the main sources of behavior-enhancing causal influences, whereas rTPJ and raMFG provide the main behavior-degrading causal influences.
Attention networks and regions of interest
During each trial, subjects were instructed to deploy and maintain covert spatial attention during the delay period (2.5 s) in anticipation of the imperative stimulus. The observed activation of bilateral FEF and bilateral IPS in Figure 1B is consistent with the view that such goal-oriented behavior engages the dorsal attention network (Corbetta and Shulman, 2002). For valid trials, the subject discriminated the imperative stimuli appearing in the attended hemifield and responded to the infrequent target. For invalid trials, the imperative stimuli appeared as distracters in the unattended hemifield, which, according to the prevailing model, activates the ventral attention network (Corbetta et al., 2008). Thus, when attention blocks were contrasted with passive-view blocks, the rTPJ and raMFG showed elevated BOLD activity (Fig. 1B). These activation patterns are consistent with previous reports using a variety of visual spatial attention and visual search tasks (Corbetta and Shulman, 2002; Shulman et al., 2003, 2007; Corbetta at al., 2008). We also performed a resting-state connectivity analysis (data not shown) using resting-state data recorded in the same scanning session to further support our choice of these task-activated regions as ROIs for Granger causality analysis.
Interaction of attention networks and behavior
Anticipating the appearance of an object at the attended location or with attended features is thought to simultaneously activate the dorsal attention network (Kastner et al., 1999; Shulman et al., 1999; Corbetta et al., 2000; Hopfinger et al., 2000) and suppress the ventral attention network (Shulman et al., 2003; Todd et al., 2005). Our finding in Figure 2 that stronger DAN→VAN leads to better behavioral performance is consistent with this idea, suggesting a network-level mechanism in which top-down control signals from the DAN, and possibly from other frontal executive structures, play the role of suppressing VAN activity to filter out behaviorally irrelevant input and enhance the efficacy of sensorimotor processing in the attended domain (Shulman et al., 2003; Corbetta et al., 2008). In contrast, the ventral attention network has been postulated as containing mechanisms to reorient the attention system upon activation by stimuli not in the attentional focus, a notion supported by lesion studies where damage to VAN areas leads to spatial hemineglect (Heilman and Van Den Abell, 1980; Vallar and Perani, 1987; Husain and Kennard, 1996; Mort et al., 2003; Karnath et al., 2004). To achieve reorienting, bottom-up signals propagate from the ventral attention network to the dorsal attention network to break the top-down attentional set, which in turn disrupts the sensorimotor processing enabled by the dorsal attention network (Corbetta et al., 2008). Our finding in Figure 2 that stronger VAN→DAN leads to worse behavioral performance is likely to reflect the action of this mechanism.
The role of individual ROIs
Although the importance of the IPS–FEF regions in voluntary attentional control has been well established (Robinson et al., 1995; Corbetta et al., 2000; Hopfinger et al., 2000; Corbetta and Shulman, 2002; Cutrell and Marrocco, 2002; Moore and Armstrong, 2003; Fox et al., 2006; Bressler et al., 2008; Gregoriou et al., 2009), the relative contribution of each area with respect to behavioral performance has not been compared. Our results in Figure 3A demonstrate that relative to bilateral FEFs, both left and right IPS regions, particularly the right IPS, appear to be more consistently exerting behavior-enhancing influences upon the areas within the ventral attention network. This is in agreement with single-unit recordings where damage to posterior parietal regions, including IPS and superior parietal lobule, leads to an impaired ability to filter out irrelevant sensory information (Friedman-Hill et al., 2003). Among the areas of the ventral attention network, the right temporal parietal junction, being situated at the convergence point of visual, auditory, and somatosensory input, is ideally suited for initiating the circuit-breaking signal to enable shifts of attention. Transient disruption of rTPJ with TMS causes deficits in visual target detection and reorienting (Chambers et al., 2004; Ellison et al., 2004; Meister et al., 2006). In contrast, resting-state fMRI connectivity analysis suggests that the right middle frontal gyrus is the key area for mediating the interaction between the two attention networks (Fox et al., 2006). We found that both rTPJ and right middle frontal gyrus exert behavior-degrading influences upon ROIs in the dorsal attention network. Within the ventral attention network, rTPJ further exerts behavior-degrading influences upon rpMFG and raMFG, implying that rTPJ, rather than rMFG, is likely the main source of the bottom-up interrupting signals for attention reorienting.
Within the present experimental and analysis framework, the precise role of rpMFG is difficult to ascertain. Whereas greater rpMFG→rIPS leads to worse performance, consistent with its putative membership in the ventral attention network, increased rpMFG→rFEF, rpMFG→lIPS, and rpMFG→rTPJ are associated with better behavioral performance. This is in contrast with the role of the rTPJ, whose causal influences on the dorsal attention network are strictly behavior-degrading. Anatomically, rpMFG is close to dorsal prefrontal cortex (Dosenbach et al., 2007), which, according to recent resting-state fMRI studies (Dosenbach et al., 2007; Church et al., 2009), is more connected with dorsal frontoparietal rather than ventral frontoparietal regions. We speculate that rpMFG may contain subregions that control different aspects of the present experimental task and these subregions do not have a unitary relationship with areas of the dorsal attention network (Miller, 2000; Tanji and Hoshi, 2008; O'Reilly, 2010).
Methodological considerations
Past work has correlated levels of BOLD activity and behavior as a way to assess the function of a given brain region (Rypma et al., 2002; Hester et al., 2008). Applying this approach, we found that increased activity in the areas of the dorsal attention network tend to be associated with better performance (Table 2), consistent with the role of these areas in mediating goal-oriented attentional control. This approach, however, is not able to attribute functional significance to the areas within the ventral attention network. Likewise, the temporal correlation coefficient as a statistic for assessing the functional roles of the interactions between different ROIs proves to be also not very informative, with most of the ROI pairs in Figure 3B showing a positive correlation between temporal correlation coefficient and behavioral performance.
For a given pair of ROIs, our hypothesis posits different functions for activity traveling along opposite directions. This requires the decomposition of neural interaction into its directional components. Common methods for this purpose include structural equation modeling (SEM) (McIntosh and Gonzalez-Lima, 1994), dynamic causal modeling (DCM) (Friston et al., 2003; Lee et al., 2006), and Granger causality (Ding et al., 2006). Both SEM and DCM are model-based methods and require a preexisting theoretical framework. In contrast, Granger causality, based on time series prediction, is more data-driven and has proven to a powerful tool for analyzing electrophysiological data (Kamiński et al., 2001; Brovelli et al., 2004; Bollimunta et al., 2008, 2011). While the applicability of Granger causality to fMRI data is debated (Smith et al., 2011), it is important to note that from a statistical point of view, if a time series is analyzable by functional connectivity measures such as temporal correlation and coherence (Kuo et al., 2011), it is analyzable by Granger causality. The reason is that these methods make the same set of assumptions (e.g., stationarity) about the time series. Accumulating evidence demonstrates the effectiveness of using Granger causality to characterize fMRI data (Rypma et al., 2006; Bressler et al., 2008; Deshpande et al., 2008; Duann et al., 2009; Rypma and Prabhakaran, 2009; Zhou et al., 2009; Biswal et al., 2010; Hwang et al., 2010; Jiao et al., 2011). Moreover, recent work shows that both resting-state and task-state fMRI data are well described by autoregressive models, which are the basis for deriving Granger causality (Sridharan et al., 2007; Bressler and Seth, 2011; Hamilton et al., 2011).
As with any statistical quantities based on BOLD measurements, how to relate Granger causality estimated at the hemodynamic level with that at the neuronal level is not straightforward. Low sampling rate (Goebel et al., 2003; Deshpande et al., 2010) and variable HRF latency across different brain regions (David et al., 2008) are two often-cited factors for concern. For the first concern, fMRI onset latencies have been shown to correlate well with reaction time and stimulus presentation time (Liu et al., 2004) and can be used to determine the origin of processing delays during cognitive or perceptual tasks with a temporal accuracy of tens of milliseconds (Menon et al., 1998). When applied to simulated fMRI data generated by convolving HRF with local field potentials recorded from the macaque (Deshpande et al., 2010), Granger causality is found to be able to detect delays as short as several hundred milliseconds. For the second concern, we tested whether there were any systematic relative HRF delays in our data by calculating the cross-correlation function between the residual BOLD time series used by our Granger causality analysis (data not shown) and found that the vast majority of cross-correlation peaks appeared at zero lag, indicating that the regional HRF latency effect is not a significant factor in this study. The foregoing notwithstanding, given the complex nature of neurovascular coupling, much work remains to be done to better understand the relation between Granger causality based on hemodynamic variables and that based on neuronal variables. Preliminary simulation results reveal a monotonic relationship between neural-level causal influence and BOLD-level causal influence (Rangarajan et al., 2011), and such a relationship may provide the basis for a neuronal level interpretation of the findings made with BOLD signals.
Footnotes
This work was supported by NIH Grant MH79388. We thank Jia Liu for help with experimental design.
The authors declare no competing financial interests.
References
- Aguirre GK, Zarahn E, D'Esposito M. The variability of human, BOLD hemodynamic responses. Neuroimage. 1998;8:360–369. doi: 10.1006/nimg.1998.0369. [DOI] [PubMed] [Google Scholar]
- Astafiev SV, Shulman GL, Stanley CM, Snyder AZ, Van Essen DC, Corbetta M. Functional organization of human intraparietal and frontal cortex for attending, looking, and pointing. J Neurosci. 2003;23:4689–4699. doi: 10.1523/JNEUROSCI.23-11-04689.2003. [DOI] [PMC free article] [PubMed] [Google Scholar]
- Astafiev SV, Shulman GL, Corbetta M. Visuospatial reorienting signals in the human temporo-parietal junction are independent of response selection. Eur J Neurosci. 2006;23:591–596. doi: 10.1111/j.1460-9568.2005.04573.x. [DOI] [PubMed] [Google Scholar]
- Bennett C, Miller M, Wolford G. Neural correlates of interspecies perspective taking in the post-mortem Atlantic salmon: an argument for multiple comparisons correction. Neuroimage. 2009;47:S125. [Google Scholar]
- Birn RM, Diamond JB, Smith MA, Bandettini PA. Separating respiratory-variation-related fluctuations from neuronal-activity-related fluctuations in fMRI. Neuroimage. 2006;31:1536–1548. doi: 10.1016/j.neuroimage.2006.02.048. [DOI] [PubMed] [Google Scholar]
- Biswal BB, Eldreth DA, Motes MA, Rypma B. Task-dependent individual differences in prefrontal connectivity. Cereb Cortex. 2010;20:2188–2197. doi: 10.1093/cercor/bhp284. [DOI] [PMC free article] [PubMed] [Google Scholar]
- Bollimunta A, Chen Y, Schroeder CE, Ding M. Neuronal mechanisms of cortical alpha oscillations in awake-behaving macaques. J Neurosci. 2008;28:9976–9988. doi: 10.1523/JNEUROSCI.2699-08.2008. [DOI] [PMC free article] [PubMed] [Google Scholar]
- Bollimunta A, Mo J, Schroeder CE, Ding M. Neuronal mechanisms and attentional modulation of corticothalamic alpha oscillations. J Neurosci. 2011;31:4935–4943. doi: 10.1523/JNEUROSCI.5580-10.2011. [DOI] [PMC free article] [PubMed] [Google Scholar]
- Bressler SL, Seth AK. Wiener-Granger causality: a well established methodology. Neuroimage. 2011;58:323–329. doi: 10.1016/j.neuroimage.2010.02.059. [DOI] [PubMed] [Google Scholar]
- Bressler SL, Tang W, Sylvester CM, Shulman GL, Corbetta M. Top-down control of human visual cortex by frontal and parietal cortex in anticipatory visual spatial attention. J Neurosci. 2008;28:10056–10061. doi: 10.1523/JNEUROSCI.1776-08.2008. [DOI] [PMC free article] [PubMed] [Google Scholar]
- Brovelli A, Ding M, Ledberg A, Chen Y, Nakamura R, Bressler SL. Beta oscillations in a large-scale sensorimotor cortical network: directional influences revealed by Granger causality. Proc Natl Acad Sci U S A. 2004;101:9849–9854. doi: 10.1073/pnas.0308538101. [DOI] [PMC free article] [PubMed] [Google Scholar]
- Chambers CD, Payne JM, Stokes MG, Mattingley JB. Fast and slow parietal pathways mediate spatial attention. Nat Neurosci. 2004;7:217–218. doi: 10.1038/nn1203. [DOI] [PubMed] [Google Scholar]
- Chun MM, Wolfe JM. Just say no: how are visual searches terminated when there is no target present? Cognit Psychol. 1996;30:39–78. doi: 10.1006/cogp.1996.0002. [DOI] [PubMed] [Google Scholar]
- Church JA, Fair DA, Dosenbach NU, Cohen AL, Miezin FM, Petersen SE, Schlaggar BL. Control networks in paediatric Tourette syndrome show immature and anomalous patterns of functional connectivity. Brain. 2009;132:225–238. doi: 10.1093/brain/awn223. [DOI] [PMC free article] [PubMed] [Google Scholar]
- Corbetta M, Shulman GL. Control of goal-directed and stimulus-driven attention in the brain. Nat Rev Neurosci. 2002;3:201–215. doi: 10.1038/nrn755. [DOI] [PubMed] [Google Scholar]
- Corbetta M, Kincade JM, Ollinger JM, McAvoy MP, Shulman GL. Voluntary orienting is dissociated from target detection in human posterior parietal cortex. Nat Neurosci. 2000;3:292–297. doi: 10.1038/73009. [DOI] [PubMed] [Google Scholar]
- Corbetta M, Kincade JM, Shulman GL. Neural systems for visual orienting and their relationships to spatial working memory. J Cogn Neurosci. 2002;14:508–523. doi: 10.1162/089892902317362029. [DOI] [PubMed] [Google Scholar]
- Corbetta M, Kincade MJ, Lewis C, Snyder AZ, Sapir A. Neural basis and recovery of spatial attention deficits in spatial neglect. Nat Neurosci. 2005;8:1603–1610. doi: 10.1038/nn1574. [DOI] [PubMed] [Google Scholar]
- Corbetta M, Patel G, Shulman GL. The reorienting system of the human brain: from environment to theory of mind. Neuron. 2008;58:306–324. doi: 10.1016/j.neuron.2008.04.017. [DOI] [PMC free article] [PubMed] [Google Scholar]
- Cutrell EB, Marrocco RT. Electrical microstimulation of primate posterior parietal cortex initiates orienting and alerting components of covert attention. Exp Brain Res. 2002;144:103–113. doi: 10.1007/s00221-002-1032-x. [DOI] [PubMed] [Google Scholar]
- David O, Guillemain I, Saillet S, Reyt S, Deransart C, Segebarth C, Depaulis A. Identifying neural drivers with functional MRI: an electrophysiological validation. PLoS Biol. 2008;6:2683–2697. doi: 10.1371/journal.pbio.0060315. [DOI] [PMC free article] [PubMed] [Google Scholar]
- Deshpande G, Hu X, Stilla R, Sathian K. Effective connectivity during haptic perception: a study using Granger causality analysis of functional magnetic resonance imaging data. Neuroimage. 2008;40:1807–1814. doi: 10.1016/j.neuroimage.2008.01.044. [DOI] [PMC free article] [PubMed] [Google Scholar]
- Deshpande G, Sathian K, Hu X. Effect of hemodynamic variability on Granger causality analysis of fMRI. Neuroimage. 2010;52:884–896. doi: 10.1016/j.neuroimage.2009.11.060. [DOI] [PMC free article] [PubMed] [Google Scholar]
- Ding M, Bressler SL, Yang W, Liang H. Short-window spectral analysis of cortical event-related potentials by adaptive multivariate autoregressive modeling: data preprocessing, model validation, and variability assessment. Biol Cybern. 2000;83:35–45. doi: 10.1007/s004229900137. [DOI] [PubMed] [Google Scholar]
- Ding M, Chen Y, Bressler SL. Granger causality: basic theory and application to neuroscience. In: Schelter B, Winderhalder M, Timmer J, editors. Handbook of time series analysis. Berlin: Wiley-VCH; 2006. pp. 437–460. [Google Scholar]
- Dosenbach NU, Visscher KM, Palmer ED, Miezin FM, Wenger KK, Kang HC, Burgund ED, Grimes AL, Schlaggar BL, Petersen SE. A core system for the implementation of task sets. Neuron. 2006;50:799–812. doi: 10.1016/j.neuron.2006.04.031. [DOI] [PMC free article] [PubMed] [Google Scholar]
- Dosenbach NU, Fair DA, Miezin FM, Cohen AL, Wenger KK, Dosenbach RA, Fox MD, Snyder AZ, Vincent JL, Raichle ME, Schlaggar BL, Petersen SE. Distinct brain networks for adaptive and stable task control in humans. Proc Natl Acad Sci U S A. 2007;104:11073–11078. doi: 10.1073/pnas.0704320104. [DOI] [PMC free article] [PubMed] [Google Scholar]
- Duann JR, Ide JS, Luo X, Li CR. Functional connectivity delineates distinct roles of the inferior frontal cortex and presupplementary motor area in stop signal inhibition. J Neurosci. 2009;29:10171–10179. doi: 10.1523/JNEUROSCI.1300-09.2009. [DOI] [PMC free article] [PubMed] [Google Scholar]
- Ellison A, Schindler I, Pattison LL, Milner AD. An exploration of the role of the superior temporal gyrus in visual search and spatial perception using TMS. Brain. 2004;127:2307–2315. doi: 10.1093/brain/awh244. [DOI] [PubMed] [Google Scholar]
- Fair DA, Schlaggar BL, Cohen AL, Miezin FM, Dosenbach NU, Wenger KK, Fox MD, Snyder AZ, Raichle ME, Petersen SE. A method for using blocked and event-related fMRI data to study “resting state” functional connectivity. Neuroimage. 2007;35:396–405. doi: 10.1016/j.neuroimage.2006.11.051. [DOI] [PMC free article] [PubMed] [Google Scholar]
- Fox MD, Snyder AZ, Barch DM, Gusnard DA, Raichle ME. Transient BOLD responses at block transitions. Neuroimage. 2005;28:956–966. doi: 10.1016/j.neuroimage.2005.06.025. [DOI] [PubMed] [Google Scholar]
- Fox MD, Corbetta M, Snyder AZ, Vincent JL, Raichle ME. Spontaneous neuronal activity distinguishes human dorsal and ventral attention systems. Proc Natl Acad Sci U S. 2006;A103:10046–10051. doi: 10.1073/pnas.0604187103. [DOI] [PMC free article] [PubMed] [Google Scholar]
- Fox MD, Zhang D, Snyder AZ, Raichle ME. The global signal and observed anticorrelated resting state brain networks. J Neurophysiol. 2009;101:3270–3283. doi: 10.1152/jn.90777.2008. [DOI] [PMC free article] [PubMed] [Google Scholar]
- Friedman-Hill SR, Robertson LC, Desimone R, Ungerleider LG. Posterior parietal cortex and the filtering of distractors. Proc Natl Acad Sci U S A. 2003;100:4263–4268. doi: 10.1073/pnas.0730772100. [DOI] [PMC free article] [PubMed] [Google Scholar]
- Friston KJ, Ashburner J, Frith CD, Poline JB, Heather JD, Frackowiak R. Spatial registration and normalization of images. Hum Brain Mapp. 1995;2:165–189. [Google Scholar]
- Friston KJ, Harrison L, Penny W. Dynamic causal modelling. Neuroimage. 2003;19:1273–1302. doi: 10.1016/s1053-8119(03)00202-7. [DOI] [PubMed] [Google Scholar]
- Garrett DD, Kovacevic N, McIntosh AR, Grady CL. The importance of being variable. J Neurosci. 2011;31:4496–4503. doi: 10.1523/JNEUROSCI.5641-10.2011. [DOI] [PMC free article] [PubMed] [Google Scholar]
- Gavrilescu M, Shaw ME, Stuart GW, Eckersley P, Svalbe ID, Egan GF. Simulation of the effects of global normalization procedures in functional MRI. Neuroimage. 2002;17:532–542. [PubMed] [Google Scholar]
- Geweke J. Measurement of linear dependence and feedback between multiple time-series. J Am Stat Assoc. 1982;77:304–313. [Google Scholar]
- Giesbrecht B, Woldorff MG, Song AW, Mangun GR. Neural mechanisms of top-down control during spatial and feature attention. Neuroimage. 2003;19:496–512. doi: 10.1016/s1053-8119(03)00162-9. [DOI] [PubMed] [Google Scholar]
- Glover GH, Li TQ, Ress D. Image-based method for retrospective correction of physiological motion effects in fMRI: RETROICOR. Magn Reson Med. 2000;44:162–167. doi: 10.1002/1522-2594(200007)44:1<162::aid-mrm23>3.0.co;2-e. [DOI] [PubMed] [Google Scholar]
- Goebel R, Roebroeck A, Kim DS, Formisano E. Investigating directed cortical interactions in time-resolved fMRI data using vector autoregressive modeling and Granger causality mapping. Magn Reson Imaging. 2003;21:1251–1261. doi: 10.1016/j.mri.2003.08.026. [DOI] [PubMed] [Google Scholar]
- Granger CW. Investigating causal relations by econometric models and cross-spectral methods. Econometrica. 1967;37:424–443. [Google Scholar]
- Gregoriou GG, Gotts SJ, Zhou H, Desimone R. High-frequency, long-range coupling between prefrontal and visual cortex during attention. Science. 2009;324:1207–1210. doi: 10.1126/science.1171402. [DOI] [PMC free article] [PubMed] [Google Scholar]
- Hamilton JP, Chen G, Thomason ME, Schwartz ME, Gotlib IH. Investigating neural primacy in major depressive disorder: multivariate Granger causality analysis of resting-state fMRI time-series data. Mol Psychiatry. 2011;16:763–772. doi: 10.1038/mp.2010.46. [DOI] [PMC free article] [PubMed] [Google Scholar]
- He BJ, Snyder AZ, Vincent JL, Epstein A, Shulman GL, Corbetta M. Breakdown of functional connectivity in frontoparietal networks underlies behavioral deficits in spatial neglect. Neuron. 2007;53:905–918. doi: 10.1016/j.neuron.2007.02.013. [DOI] [PubMed] [Google Scholar]
- Heilman KM, Van Den Abell T. Right hemisphere dominance for attention: the mechanism underlying hemispheric asymmetries of inattention (neglect) Neurology. 1980;30:327–330. doi: 10.1212/wnl.30.3.327. [DOI] [PubMed] [Google Scholar]
- Hester R, Barre N, Murphy K, Silk TJ, Mattingley JB. Human medial frontal cortex activity predicts learning from errors. Cereb Cortex. 2008;18:1933–1940. doi: 10.1093/cercor/bhm219. [DOI] [PubMed] [Google Scholar]
- Hopfinger JB, Buonocore MH, Mangun GR. The neural mechanisms of top-down attentional control. Nat Neurosci. 2000;3:284–291. doi: 10.1038/72999. [DOI] [PubMed] [Google Scholar]
- Husain M, Kennard C. Visual neglect associated with frontal lobe infarction. J Neurol. 1996;243:652–657. doi: 10.1007/BF00878662. [DOI] [PubMed] [Google Scholar]
- Hwang K, Velanova K, Luna B. Strengthening of top-down frontal cognitive control networks underlying the development of inhibitory control: a functional magnetic resonance imaging effective connectivity study. J Neurosci. 2010;30:15535–15545. doi: 10.1523/JNEUROSCI.2825-10.2010. [DOI] [PMC free article] [PubMed] [Google Scholar]
- Jiao Q, Lu G, Zhang Z, Zhong Y, Wang Z, Guo Y, Li K, Ding M, Liu Y. Granger causal influence predicts BOLD activity levels in the default mode network. Hum Brain Mapp. 2011;32:154–161. doi: 10.1002/hbm.21065. [DOI] [PMC free article] [PubMed] [Google Scholar]
- Johnstone T, Ores Walsh KS, Greischar LL, Alexander AL, Fox AS, Davidson RJ, Oakes TR. Motion correction and the use of motion covariates in multiple-subject fMRI analysis. Hum Brain Mapp. 2006;27:779–788. doi: 10.1002/hbm.20219. [DOI] [PMC free article] [PubMed] [Google Scholar]
- Junghöfer M, Schupp HT, Stark R, Vaitl D. Neuroimaging of emotion: empirical effects of proportional global signal scaling in fMRI data analysis. Neuroimage. 2005;25:520–526. doi: 10.1016/j.neuroimage.2004.12.011. [DOI] [PubMed] [Google Scholar]
- Kamiński M, Ding M, Truccolo WA, Bressler SL. Evaluating causal relations in neural systems: Granger causality, directed transfer function and statistical assessment of significance. Biol Cybern. 2001;85:145–157. doi: 10.1007/s004220000235. [DOI] [PubMed] [Google Scholar]
- Karnath HO, Fruhmann Berger M, Küker W, Rorden C. The anatomy of spatial neglect based on voxelwise statistical analysis: a study of 140 patients. Cereb Cortex. 2004;14:1164–1172. doi: 10.1093/cercor/bhh076. [DOI] [PubMed] [Google Scholar]
- Kastner S, Pinsk MA, De Weerd P, Desimone R, Ungerleider LG. Increased activity in human visual cortex during directed attention in the absence of visual stimulation. Neuron. 1999;22:751–761. doi: 10.1016/s0896-6273(00)80734-5. [DOI] [PubMed] [Google Scholar]
- Kincade JM, Abrams RA, Astafiev SV, Shulman GL, Corbetta M. An event-related functional magnetic resonance imaging study of voluntary and stimulus-driven orienting of attention. J Neurosci. 2005;25:4593–4604. doi: 10.1523/JNEUROSCI.0236-05.2005. [DOI] [PMC free article] [PubMed] [Google Scholar]
- Kuo BC, Yeh YY, Chen AJ, D'Esposito M. Functional connectivity during top-down modulation of visual short-term memory representations. Neuropsychologia. 2011;49:1589–1596. doi: 10.1016/j.neuropsychologia.2010.12.043. [DOI] [PMC free article] [PubMed] [Google Scholar]
- Lee L, Friston K, Horwitz B. Large-scale neural models and dynamic causal modelling. Neuroimage. 2006;30:1243–1254. doi: 10.1016/j.neuroimage.2005.11.007. [DOI] [PubMed] [Google Scholar]
- Liao W, Qiu C, Gentili C, Walter M, Pan Z, Ding J, Zhang W, Gong Q, Chen H. Altered effective connectivity network of the amygdala in social anxiety disorder: a resting-state fMRI study. PLoS One. 2010;5:e15238. doi: 10.1371/journal.pone.0015238. [DOI] [PMC free article] [PubMed] [Google Scholar]
- Liu HL, Liao WT, Fang SY, Chu TC, Tan LH. Correlation between temporal response of fMRI and fast reaction time in a language task. Magn Reson Imaging. 2004;22:451–455. doi: 10.1016/j.mri.2004.01.003. [DOI] [PubMed] [Google Scholar]
- Lund TE, Madsen KH, Sidaros K, Luo WL, Nichols TE. Non-white noise in fMRI: does modelling have an impact? Neuroimage. 2006;29:54–66. doi: 10.1016/j.neuroimage.2005.07.005. [DOI] [PubMed] [Google Scholar]
- Macey PM, Macey KE, Kumar R, Harper RM. A method for the removal of global effects from fMRI time series. Neuroimage. 2004;22:360–366. doi: 10.1016/j.neuroimage.2003.12.042. [DOI] [PubMed] [Google Scholar]
- McIntosh AR, F Gonzalez-Lima F. Structural equation modeling and its application to network analysis in functional brain imaging. Hum Brain Mapp. 1994;2:2–22. [Google Scholar]
- Meister IG, Wienemann M, Buelte D, Grünewald C, Sparing R, Dambeck N, Boroojerdi B. Hemiextinction induced by transcranial magnetic stimulation over the right temporo-parietal junction. Neuroscience. 2006;142:119–123. doi: 10.1016/j.neuroscience.2006.06.023. [DOI] [PubMed] [Google Scholar]
- Menon RS, Luknowsky DC, Gati JS. Mental chronometry using latency-resolved functional MRI. Proc Natl Acad Sci U S A. 1998;95:10902–10907. doi: 10.1073/pnas.95.18.10902. [DOI] [PMC free article] [PubMed] [Google Scholar]
- Miller EK. The prefrontal cortex and cognitive control. Nat Rev Neurosci. 2000;1:59–65. doi: 10.1038/35036228. [DOI] [PubMed] [Google Scholar]
- Mo J, Schroeder CE, Ding M. Attentional modulation of alpha oscillations in macaque inferotemporal cortex. J Neurosci. 2011;31:878–882. doi: 10.1523/JNEUROSCI.5295-10.2011. [DOI] [PMC free article] [PubMed] [Google Scholar]
- Moore T, Armstrong KM. Selective gating of visual signals by microstimulation of frontal cortex. Nature. 2003;421:370–373. doi: 10.1038/nature01341. [DOI] [PubMed] [Google Scholar]
- Mort DJ, Malhotra P, Mannan SK, Rorden C, Pambakian A, Kennard C, Husain M. The anatomy of visual neglect. Brain. 2003;126:1986–1997. doi: 10.1093/brain/awg200. [DOI] [PubMed] [Google Scholar]
- O'Reilly RC. The what and how of prefrontal cortical organization. Trends Neurosci. 2010;33:355–361. doi: 10.1016/j.tins.2010.05.002. [DOI] [PMC free article] [PubMed] [Google Scholar]
- Poldrack RA, Mumford JA. Independence in ROI analysis: where is the voodoo? Soc Cogn Affect Neurosci. 2009;4:208–213. doi: 10.1093/scan/nsp011. [DOI] [PMC free article] [PubMed] [Google Scholar]
- Rajagovindan R, Ding M. From prestimulus alpha oscillation to visual-evoked response: an inverted-U function and its attentional modulation. J Cogn Neurosci. 2011;23:1379–1394. doi: 10.1162/jocn.2010.21478. [DOI] [PubMed] [Google Scholar]
- Rangarajan G, Wen X, Ding M. Linking BOLD-level Granger causality with neural-level Granger causality. Soc Neurosci Abstr. 2011;37:621.03. [Google Scholar]
- Robinson DL, Bowman EM, Kertzman C. Covert orienting of attention in macaques. II. Contributions of parietal cortex. J Neurophysiol. 1995;74:698–712. doi: 10.1152/jn.1995.74.2.698. [DOI] [PubMed] [Google Scholar]
- Roebroeck A, Formisano E, Goebel R. Mapping directed influence over the brain using Granger causality and fMRI. Neuroimage. 2005;25:230–242. doi: 10.1016/j.neuroimage.2004.11.017. [DOI] [PubMed] [Google Scholar]
- Rogers BP, Morgan VL, Newton AT, Gore JC. Assessing functional connectivity in the human brain by fMRI. Magn Reson Imaging. 2007;25:1347–1357. doi: 10.1016/j.mri.2007.03.007. [DOI] [PMC free article] [PubMed] [Google Scholar]
- Rorden C, Karnath HO. Using human brain lesions to infer function: a relic from a past era in the fMRI age? Nat Rev Neurosci. 2004;5:812–819. doi: 10.1038/nrn1521. [DOI] [PubMed] [Google Scholar]
- Rypma B, Prabhakaran V. When less is more and when more is more: the mediating roles of capacity and speed in brain-behavior efficiency. Intelligence. 2009;37:207–222. doi: 10.1016/j.intell.2008.12.004. [DOI] [PMC free article] [PubMed] [Google Scholar]
- Rypma B, Berger JS, D'Esposito M. The influence of working-memory demand and subject performance on prefrontal cortical activity. J Cogn Neurosci. 2002;14:721–731. doi: 10.1162/08989290260138627. [DOI] [PubMed] [Google Scholar]
- Rypma B, Berger JS, Prabhakaran V, Bly BM, Kimberg DY, Biswal BB, D'Esposito M. Neural correlates of cognitive efficiency. Neuroimage. 2006;33:969–979. doi: 10.1016/j.neuroimage.2006.05.065. [DOI] [PubMed] [Google Scholar]
- Schreiber K, Krekelberg B. Detrimental effect of head motion covariates on GLM and multivoxel classification analysis of FMRI data. J Vis. 2010;10:967. [Google Scholar]
- Shulman GL, Ollinger JM, Akbudak E, Conturo TE, Snyder AZ, Petersen SE, Corbetta M. Areas involved in encoding and applying directional expectations to moving objects. J Neurosci. 1999;19:9480–9496. doi: 10.1523/JNEUROSCI.19-21-09480.1999. [DOI] [PMC free article] [PubMed] [Google Scholar]
- Shulman GL, Tansy AP, Kincade M, Petersen SE, McAvoy MP, Corbetta M. Reactivation of networks involved in preparatory states. Cereb Cortex. 2002;12:590–600. doi: 10.1093/cercor/12.6.590. [DOI] [PubMed] [Google Scholar]
- Shulman GL, McAvoy MP, Cowan MC, Astafiev SV, Tansy AP, d'Avossa G, Corbetta M. Quantitative analysis of attention and detection signals during visual search. J Neurophysiol. 2003;90:3384–3397. doi: 10.1152/jn.00343.2003. [DOI] [PubMed] [Google Scholar]
- Shulman GL, Astafiev SV, McAvoy MP, d'Avossa G, Corbetta M. Right TPJ deactivation during visual search: functional significance and support for a filter hypothesis. Cereb Cortex. 2007;17:2625–2633. doi: 10.1093/cercor/bhl170. [DOI] [PubMed] [Google Scholar]
- Shulman GL, Pope DL, Astafiev SV, McAvoy MP, Snyder AZ, Corbetta M. Right hemisphere dominance during spatial selective attention and target detection occurs outside the dorsal frontoparietal network. J Neurosci. 2010;30:3640–3651. doi: 10.1523/JNEUROSCI.4085-09.2010. [DOI] [PMC free article] [PubMed] [Google Scholar]
- Smith AM, Lewis BK, Ruttimann UE, Ye FQ, Sinnwell TM, Yang Y, Duyn JH, Frank JA. Investigation of low frequency drift in fMRI signal. Neuroimage. 1999;9:526–533. doi: 10.1006/nimg.1999.0435. [DOI] [PubMed] [Google Scholar]
- Smith SM, Miller KL, Salimi-Khorshidi G, Webster M, Beckmann CF, Nichols TE, Ramsey JD, Woolrich MW. Network modelling methods for FMRI. Neuroimage. 2011;54:875–891. doi: 10.1016/j.neuroimage.2010.08.063. [DOI] [PubMed] [Google Scholar]
- Sridharan D, Levitin DJ, Chafe CH, Berger J, Menon V. Neural dynamics of event segmentation in music: converging evidence for dissociable ventral and dorsal networks. Neuron. 2007;55:521–532. doi: 10.1016/j.neuron.2007.07.003. [DOI] [PubMed] [Google Scholar]
- Tanji J, Hoshi E. Role of the lateral prefrontal cortex in executive behavioral control. Physiol Rev. 2008;88:37–57. doi: 10.1152/physrev.00014.2007. [DOI] [PubMed] [Google Scholar]
- Todd JJ, Fougnie D, Marois R. Visual short-term memory load suppresses temporo-parietal junction activity and induces inattentional blindness. Psychol Sci. 2005;16:965–972. doi: 10.1111/j.1467-9280.2005.01645.x. [DOI] [PubMed] [Google Scholar]
- Vallar G, Perani D. The anatomy of spatial neglect in humans. In: Jeannerod M, editor. Neurophysiological and neuropsychological aspects of spatial neglect. Amsterdam: Elsevier; 1987. pp. 235–258. [Google Scholar]
- Wise RG, Ide K, Poulin MJ, Tracey I. Resting fluctuations in arterial carbon dioxide induce significant low frequency variations in BOLD signal. Neuroimage. 2004;21:1652–1664. doi: 10.1016/j.neuroimage.2003.11.025. [DOI] [PubMed] [Google Scholar]
- Wolfe JM. What can 1 million trials tell us about visual search? Psychol Sci. 1998;9:33–39. [Google Scholar]
- Zarahn E, Aguirre GK, D'Esposito M. Empirical analyses of BOLD fMRI statistics. I. Spatially unsmoothed data collected under null-hypothesis conditions. Neuroimage. 1997;5:179–197. doi: 10.1006/nimg.1997.0263. [DOI] [PubMed] [Google Scholar]
- Zhang Y, Wang X, Bressler SL, Chen Y, Ding M. Prestimulus cortical activity is correlated with speed of visuomotor processing. J Cogn Neurosci. 2008;20:1915–1925. doi: 10.1162/jocn.2008.20132. [DOI] [PubMed] [Google Scholar]
- Zhou Z, Ding M, Chen Y, Wright P, Lu Z, Liu Y. Detecting directional influence in fMRI connectivity analysis using PCA-based Granger causality. Brain Res. 2009;1289:22–29. doi: 10.1016/j.brainres.2009.06.096. [DOI] [PMC free article] [PubMed] [Google Scholar]