Abstract
Tumor cells proliferate rapidly, and thus are frequently subjected to replication stress and the risk of incomplete duplication of the genome. Fragile sites are replicated late, making them more vulnerable to damage when DNA replication fails to complete. Therefore, genomic alterations at fragile sites are commonly observed in tumors. FRA16D is one of the most common fragile sites in lung cancer, however, the nature of the tumor suppressor genes affected by FRA16D alterations has been controversial. Here, we show that the ATMIN gene, which encodes a cofactor required for activation of ATM kinase by replication stress, is located close to FRA16D and is commonly lost in lung adenocarcinoma (LUAD). Low ATMIN expression was frequently observed in human LUAD tumors and was associated with reduced patient survival, suggesting that ATMIN functions as a tumor suppressor in LUAD. Heterozygous Atmin deletion significantly increased tumor cell proliferation, tumor burden and tumor grade in the LSL-KRasG12D; Trp53 F/F (KP) mouse model of LUAD, identifying ATMIN as a haploinsufficient tumor suppressor. ATMIN-deficient KP lung tumor cells showed increased survival in response to replication stress, and consequently accumulated DNA damage. Thus, our data identify ATMIN as a key gene affected by genomic deletions at FRA16D in LUAD.
Keywords: ATMIN, ATM, replication stress, lung cancer
Introduction
Fragile sites are conserved regions of chromosomal instability that frequently incur problems completing replication (1). These sites may be “expressed” (that is, undergo breakage or rearrangement) in the presence of stresses that impair replication completion, such as the replicative polymerase inhibitor aphidicolin, and appear as gaps or regions of decondensation on metaphase chromosome spreads (2). The common fragile site FRA16D is located on the long arm of chromosome 16 (16q23.2) and undergoes frequent loss of heterozygosity (LOH) or deletion in cancers, including breast and lung cancers (2). The fragile region covers nearly 2Mb of DNA (3) and is associated with several genes. The most well-studied of these is WWOX, a locus shown to be affected by genome alteration in cancer encoding a WW domain-containing oxidoreductase (4). WWOX has been implicated as a tumor suppressor in breast and other cancers (5). However, its tumor suppressor function has long been controversial (6), although WWOX has been shown to function in several cellular processes including survival following DNA damage (7) that affect tumor cells.
Lung adenocarcinomas (LUAD) harbor frequent deletions at chr16q23. Because the affected region on chromosome 16q is large, we reasoned that there may be genes in addition to WWOX at this locus with a potential effect on tumorigenesis. Located adjacent to WWOX is the gene encoding the ATM interactor ATMIN. ATMIN has previously been implicated as a tumor suppressor and as an oncogene in different cancer types (8,9), but its role in LUAD was unknown. In this study we identify ATMIN as a tumor suppressor in LUAD. Low ATMIN expression correlated with poor survival in LUAD patients, and deletion of Atmin in a mouse model of LUAD increased tumor burden and tumor grade. ATMIN-deficient tumor cells show increased survival in response to replication stress, and consequently accumulate increased DNA damage. Thus, our data identify ATMIN as an important tumor suppressor at the FRA16D locus.
Materials and Methods
Ethics statement
All animal experiments were approved by the Francis Crick Institute Animal Ethics Committee and conformed to UK Home Office regulations under the Animals (Scientific Procedures) Act 1986 including Amendment Regulations 2012.
Animal models
AtminF/F, Trp53F/F, AtmF/F, and LSL-KRasG12D mice have been described previously (10–13). Immunocompromised NOD/SCID mice were maintained in-house.
Intra-tracheal virus delivery
6-8-week-old mice were anesthetized using isoflurane 2-2.5% (O2 at 2L/min). Anesthetized mice were intubated via insertion of a catheter into the trachea and administered Ade-Cre virus (2.5×10⁷ PFU per mouse)(14).
μCT image acquisition and processing
The SkyScan-1176, a high-resolution low-dose X-ray scanner, was used for 3D microcomputed tomography (μCT). Mice were anesthetized with isoflurane and μCT images were acquired at a standard resolution (35μm pixel size), with a 0.5mm aluminum filter, using list mode of 8 frames and a rotation step of 0.7°. The raw scan data was sorted using RespGate software (15), based on the position of the diaphragm, into end expiration bins. 3D reconstruction was performed using NRecon software. 3D data sets were examined using Data Viewer software; the volume of individual lung lesions was calculated using CT-Analyser software.
Isolation of primary lung tumor cells
Mice were sacrificed 14 weeks after viral delivery by cervical dislocation followed by exsanguination, according to UK Home Office guidelines. Lung lobes were dissected out and immediately placed in 4 ml of medium A (AdMEM/F12, B27, N2, 2% FCS, 1% Penicillin/Streptomycin, 10μg/ml Insulin, 20ng/ml EGF, 20ng/ml FGF, 100μg/ml Primocin) into GentleMACS™ C tubes and subjected to automated homogenisation using GentleMACS dissociators at Tumor 2 mode, followed by addition of 300U/ml collagenase IV and hyaluronidase 300 U/ml and incubation for 20 minutes at 37°C with constant shaking. Homogenised lungs were subjected to further dissocation at Tumor 3 mode, followed by addition of DMEM (10% FCS, 1% Penicillin/Streptomycin), supplementation with Primocin and centrifugation at 1,000 rpm for 5 minutes. The pellet was resuspended in medium A and cells were plated onto Ultra-low attachment plates and placed in a humidified incubator at 37°C, 5% CO2 and 3% O2. 96 hours later the medium was replaced with medium B (AdMEM/F12, B27, N2, 1% Penicillin/Streptomycin, 20ng/ml EGF, 20ng/ml FGF, 100μg/ml Primocin) and cells were replated on standard tissue culture plates. 3-5 cell clones were isolated per genotype, and 3 clones per genotype were used for experiments. All cell lines were tested Mycoplasma negative by PCR assay.
Cell culture and DNA damage induction
Primary cells were maintained at 37 °C with 5% CO2. All experiments were performed using cells from passages 5–10. All cell culture treatments were performed 24 hours after cell plating. Ionising irradiation (IR) experiments were performed using a Cs137 Gamma Irradiator at the indicated doses followed by a recovery period of 30 min. Aphidicolin and H2O2 were purchased from Sigma. The viability of cells after concentration- or dose-dependent treatments was determined with crystal violet assay.
Protein extracts and immunoblotting
Cells were extracted in cell lysis buffer (NEB) supplemented with protease inhibitors (Sigma) and phosphatase inhibitors (Sigma, NEB). Protein samples were separated by SDS–PAGE, and subsequently transferred onto PVDF membranes. Immunoblots were performed using standard procedures. All primary antibodies were used at 1:1,000 dilution and secondary antibodies at 1:10,000, except β-Actin-HRP antibody, used at 1:50,000. The following antibodies were used: ATM (Santa Cruz, sc23931), b-ACTIN-HRP (Abcam, ab49900), p53 (Cell Signaling, 2524S), pS824-KAP1 (Bethyl Labs, A300-767A), KAP1 (Abcam, ab10484), HRP-conjugated anti-Mouse (Jackson, 115-035-174), HRP-conjugated anti-Rabbit (Jackson, 115-032-171).
Immunofluorescence, immunohistochemistry, RNA-Scope
IF and immunohistochemistry stainings were performed using standard protocols. Tumor microarray (LC10013a) was purchased from US Biomax, Inc. The following antibodies were used: pS139-H2AX (1:400, Upstate, 05-636), RPA2/32 (1:400, Cell Signaling, 2208), TTF1 (1:300, Abcam, ab76013), Sftpc (1:1000, Abcam, ab211326), phospho-ERK (1:100, Cell signaling, 4370), phospho-histone H3 (1:600, Cell signaling, 9706), Ki67 (1:125, DAKO), ATM (1:200, Abcam, ab32420), ATMIN (1:100, Sigma, HPA066960), Biotin-conjugated anti-Rabbit (1:250, Jackson, 711-066-152), Alexa Fluoro 488 anti-Rat (1:400, Life Technologies, A21208), Alexa Fluoro 546 anti-Rabbit (1:400, Life Technologies, A10040), Alexa Fluoro 647 anti-Mouse (1:400, Life Technologies, A31573). Immunohistochemistry scoring was blinded and was performed on Zeiss AxioScan.Z1 (Zeiss) scanned slides using Strataquest software. RNA-Scope was performed following the manufacturer’s protocol. The Atmin-specific probe was custom-designed to target 1000-1910 of NM_177700.4; Ubc and Ppib probes were used as a positive control.
Genotyping
Murine tail snips or cell pellets were used for genotyping by Transnetyx or with KAPA Mouse Genotyping kit (Sigma) using the following primers: Atmin A TCAGCATCTTCTCCAGAGAGACAG, Atmin B CACATGTGTACAGCACATTCATTG, Atmin C CTCAGGGTACACATACTATGCTTGC.
Q-RT-PCR
Genomic DNA was extracted from tissues or cell pellets using the high salt method. Absolute quantification was performed on Applied Biosystems 7500 Fast PCR System using SYBR Green reagents with an 8-point 5-fold serial dilutions standard curve and the following primers: 36B4-F ACTGGTCTAGGACCCGAGAAG, 36B4-R TCAATGGTGCCTCTGGAGATT, Atmin-F CAAGCACTCGGTGTCAATGG, Atmin-R CACAGTGCGCAGGCATCT. Total RNA was isolated from a cell pellet using RNeasy Mini kit and the RNase Free DNase set was used for on-column DNA digestion, according to manufacturer’s instructions. 750 ng of RNA was used as a template for cDNA synthesis with Superscript III First-Strand cDNA synthesis kit, according to manufacturer’s protocol. The following primers were used in Q-RT-PCR: Actin-F TCTTTGCAGCTCCTTCGTTG, Actin-R ACGATGGAGGGGAATACAGC, Dynll1-F GGCTGTCTTCTGCTGCTTG, Dynll1-R CATTTTTGATCACCGCCTTC, Gli1-F TGGAGGTCTGCGTGGTAGA, Gli1-R TTGAACATGGCGTCTCAGG, Ptch1-F GCTCTGGAGCAGATTTCCAA, Ptch1-R ACCCAGTTTAAATAAGAGTCTCTGAAA.
Analysis of public data from cancer genomics studies
Data from TCGA Research Network (TCGA Lung Adenocarcinoma Provisional complete sample set), including mutations and putative copy-number alterations, were analyzed using cBioportal software (16) and visualized using the standard Oncoprint output. Patient prognoses was evaluated by Kaplan–Meier survival curves of LUAD patients with low or high expression of ATMIN, WWOX, ATM and DYNLL1 with data from Kaplan–Meier plotter (17).
Results and Discussion
ATMIN is frequently altered in LUAD and reduced expression correlates with poor patient survival
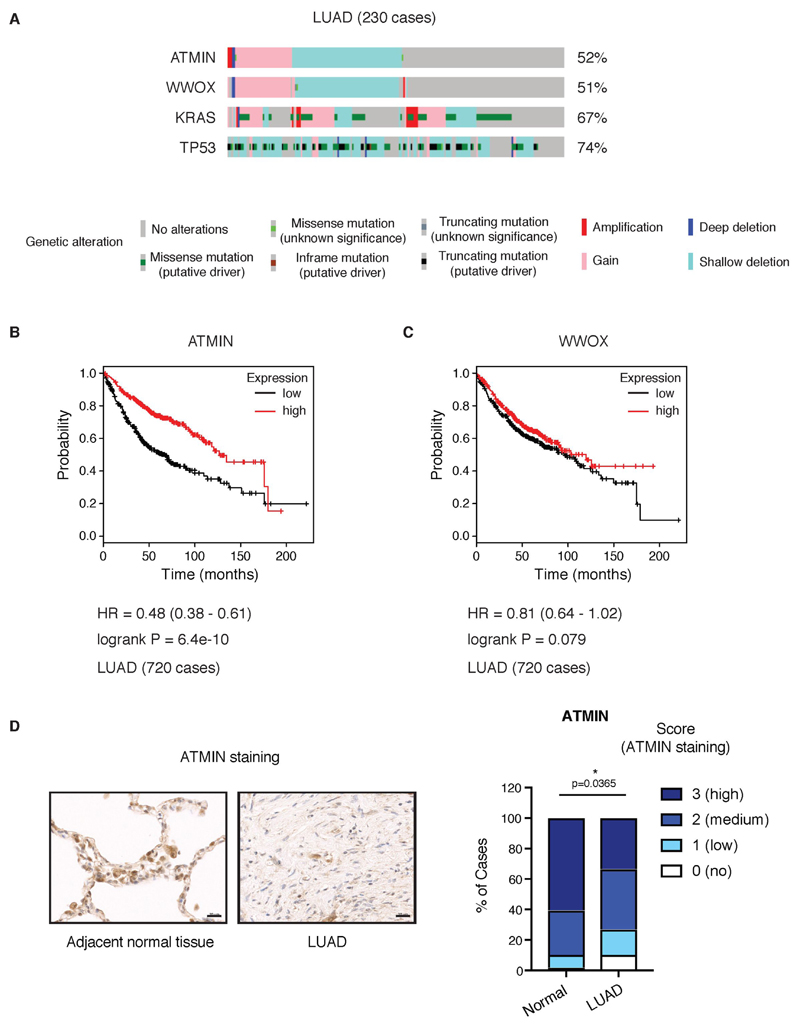
To evaluate a potential role for genetic disruption of ATMIN in LUAD, we examined The Cancer Genome Atlas (TCGA) data from 230 LUAD cases (16). Of these, 52% of samples showed genetic alterations in the ATMIN gene (Fig. 1A). The alterations in ATMIN almost exactly mirrored those in WWOX (co-occurrence odds ratio >3, p<0.001), consistent with the close chromosomal linkage of both genes (Supplementary Fig. 1A). The most frequent type of alteration was a shallow deletion at the ATMIN and WWOX loci (33% of LUAD cases), which leads to loss of one allele (Fig. 1A). ATMIN deletions occurred both in cancers harboring the most frequent LUAD alterations, KRAS and TP53 (17), and in those without these changes (Fig. 1A). We next examined the correlation between ATMIN expression level and LUAD patient survival. Strikingly, lower expression of ATMIN was associated with a significantly shorter survival time (P = 6.4x10⁻¹⁰, log-rank test; hazard ratio 0.48 (0.38-0.61)) (Fig. 1B). Importantly, expression of WWOX did not show a similar survival association (P = 0.079, log-rank test; hazard ratio 0.81 (0.64-1.02)), suggesting that the effect of ATMIN loss is not simply a result of its fragile site location (Fig. 1C). The survival advantage of high versus low ATMIN expression was similar to that of ATM, a known tumor suppressor gene frequently mutated in LUAD (17) (Supplementary Fig. S1B, C). However, unlike expression of ATMIN, expression of ATMIN target gene DYNLL1 was inversely correlated with survival, as patients with higher DYNLL1 expression had significantly shorter survival, indicating a pro-tumorigenic role of DYNLL1 in LUAD (Supplementary Fig. S1D). On average, LUAD samples stained more weakly for ATMIN protein by immunohistochemistry than adjacent normal lung tissue (Fig. 1D and Supplementary Fig. S2A). Similarly, LUAD samples showed weaker ATM staining than the adjacent normal tissue (Supplementary Fig. S2B, C). Overall, this suggests that both ATMIN and ATM proteins are often downregulated in tumors. Thus, we aimed to test the functional significance of reduced ATMIN and ATM expression in lung tumors genetically.
Figure 1. ATMIN is frequently altered in LUAD and reduced expression correlates with poor survival.
A) OncoPrint plot showing distinct genetic alterations in the indicated genes across a set of LUAD cases (n=230). Percentages on the right indicate cases with the displayed alterations. Analysis performed using sequencing and copy number alterations data from TCGA in cBioPortal (16).
B) Kaplan-Meier plot showing the association between ATMIN expression and survival. Analysis performed using KM plotter lung cancer microarray database (19)(2015 release).
C) Kaplan-Meier plot showing no association between WWOX expression and survival.
D) Left, representative ATMIN immunohistochemical staining on LUAD and adjacent normal lung tissue; right, quantification of ATMIN protein expression in human lung sections of tissue microarray (48 cases, 96 cores).
Homozygous or heterozygous deletion of Atmin or Atm increases LUAD tumor burden
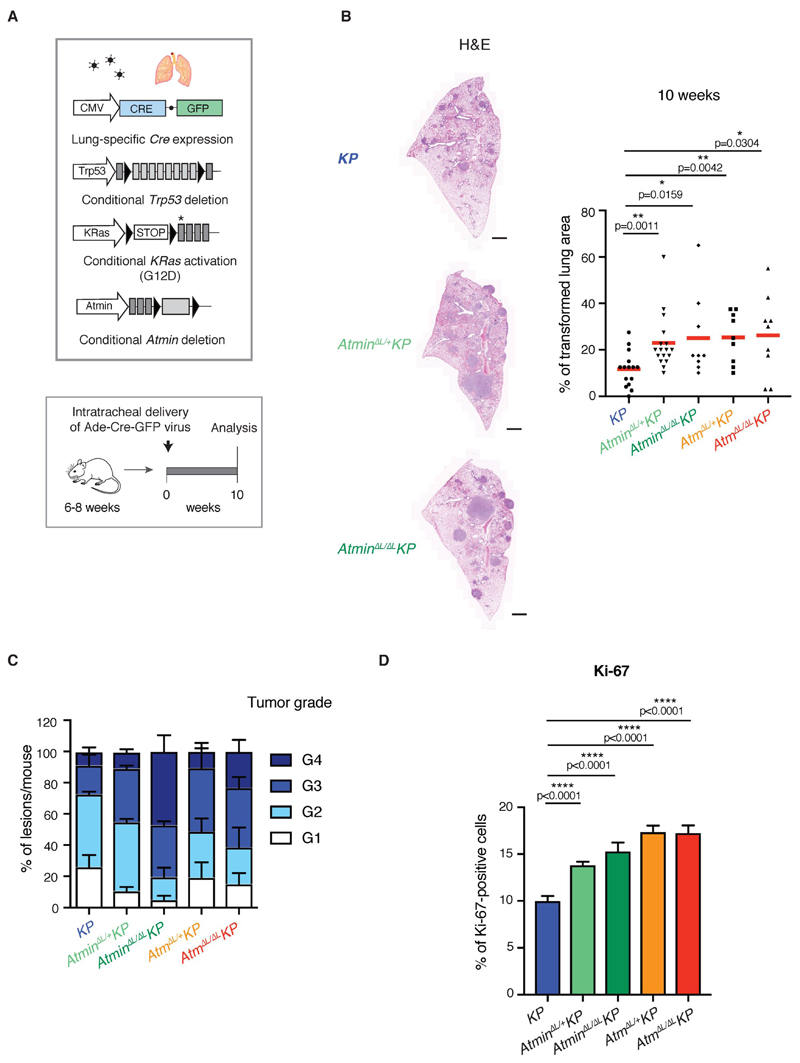
The commonly used LSL-KRasG12D; Trp53F/F (KP) mouse model harbors Cre-inducible alleles of two of the most commonly altered genes in human LUAD and develops lung tumors within weeks. To enable inducible deletion of Atmin specifically in transformed lung cells, we combined the Atmin F/F or Atm F/F alleles with KP and targeted Cre expression to the lungs using intra-tracheal adenovirus delivery (Fig. 2A). After 10 weeks, animals developed LUAD tumors, identified by positive staining for TTF1, Sftpc, and exhibited activation of MAPK pathway judged by increased phospho-ERK staining (Supplementary Fig. S3A). Tumor burden was significantly increased in animals harbouring a homozygous or heterozygous Atmin or Atm deletion, with a more variable increase in tumor number (Fig. 2B and Supplementary Fig. S3B, C). Tumors deficient for Atmin or Atm were on average higher-grade and showed more proliferating cells as measured by Ki67 and phospho-histone H3 staining (Fig. 2C, D and Supplementary Fig. S3D-F and Fig. S4A). When monitored every 2 weeks by micro-CT scan, Atmin or Atm-deficient lung lesions grew faster, and were larger and more numerous than control KP tumors (Supplementary Fig. S4B-E). Thus, our data support a tumor suppressive function for ATMIN and ATM in LUAD.
Figure 2. Homozygous or heterozygous deletion of Atmin or Atm increases LUAD tumor burden.
A) Schematic representation of the genetic alleles and experimental strategy used.
B) Representative images of H&E sections (left) and dot plot (right) quantifying the tumor burden in lungs isolated from mice of the indicated genotypes. Scale bar, 1000 μm. Dots represent individual mice; red horizontal line indicates mean. P values calculated using Mann-Whitney U non-parametric test.
C) Quantification of lung lesions according to tumor grade in mice of the indicated genotypes. At least 200 lung lesions from 5 different mice per genotype were analyzed. Values are mean + SEM.
D) Quantification of Ki-67 staining on lung tumors from mice of the indicated genotypes. At least 30 tumors from 3 mice per genotype were quantified. Bar chart shows mean + SEM. P values calculated using Mann-Whitney U non-parametric test.
Heterozygous Atmin loss increases proliferation of lung tumor cells and tumor grafts
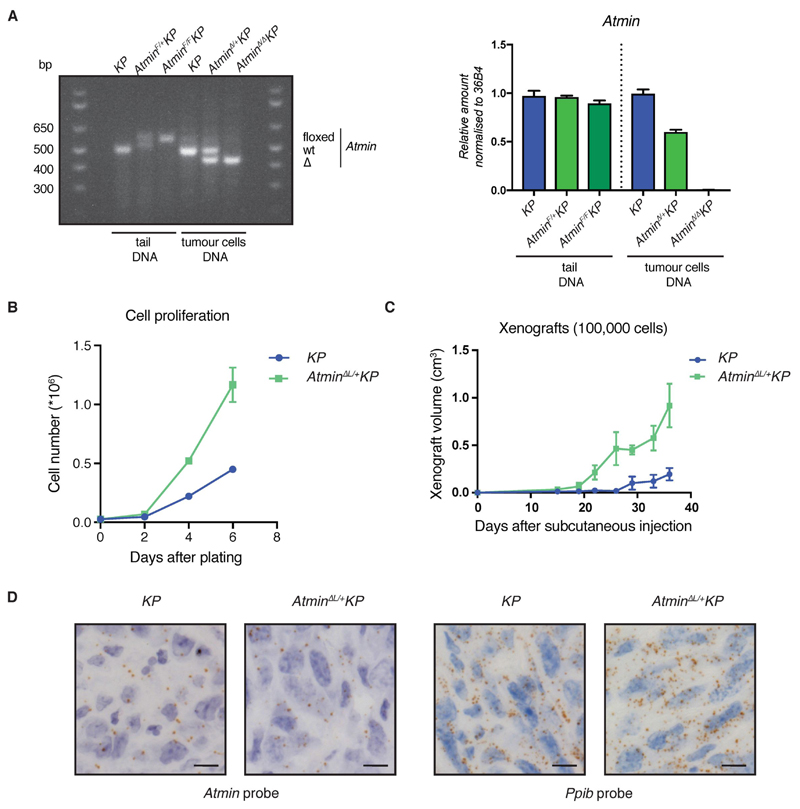
To enable further analysis of the tumor suppressive function of ATMIN, we established several clonal lung tumor cell lines from the Atmin-deficient LUAD mouse model (AtminΔL/+ KP) and confirmed heterozygous Atmin deletion by genotyping PCR (Fig. 3A and Supplementary Fig. S5A, B). The heterozygous Atmin deletion was chosen as the best model for hemizygous ATMIN loss in LUAD patients with FRA16D alterations (Fig. 1A and Supplementary Fig. S1A). Unlike AtminΔL/ΔL KP cells, AtminΔL/+ KP tumor cells maintained expression of Atmin target gene Dynll1 (Supplementary Fig. S5C-E). AtminΔL/+ KP cells proliferated faster than KP controls, as did AtminΔL/ΔL KP and AtmΔL/ΔL KP tumor cells (Fig. 3B and Supplementary Fig. S6A). When injected subcutaneously into nude mice, AtminΔL/+ KP and AtminΔL/ΔL cells formed graft tumors that were larger and grew faster than those from KP cells, and still maintained expression of the remaining Atmin allele (Fig. 3C, D and Supplementary Fig. S6B-H, suggesting that ATMIN is a haploinsufficient tumor suppressor.
Figure 3. Heterozygous Atmin loss increases proliferation of lung tumor cells and tumor grafts.
A) Loss-of-heterozygosity testing for Atmin gene. Left, genotyping analysis of Atmin alleles in lung tumor cells and tail DNA. Right, number of genomic Atmin DNA copies, measured by Q-PCR and normalised to the 36B4 gene.
B) Graph showing the difference in cell proliferation between AtminΔL/+ KP and KP cells.
C) Graph showing the volume of xenograft tumors at the indicated timepoints after subcutaneous injection of AtminΔL/+ KP and KP cells.
D) Representative RNAScope images, showing Atmin and Ppib (positive control) mRNA in AtminΔL/+ KP- and KP-derived xenografts.
ATM or ATMIN-deficient lung tumor cells are more resistant to replication stress
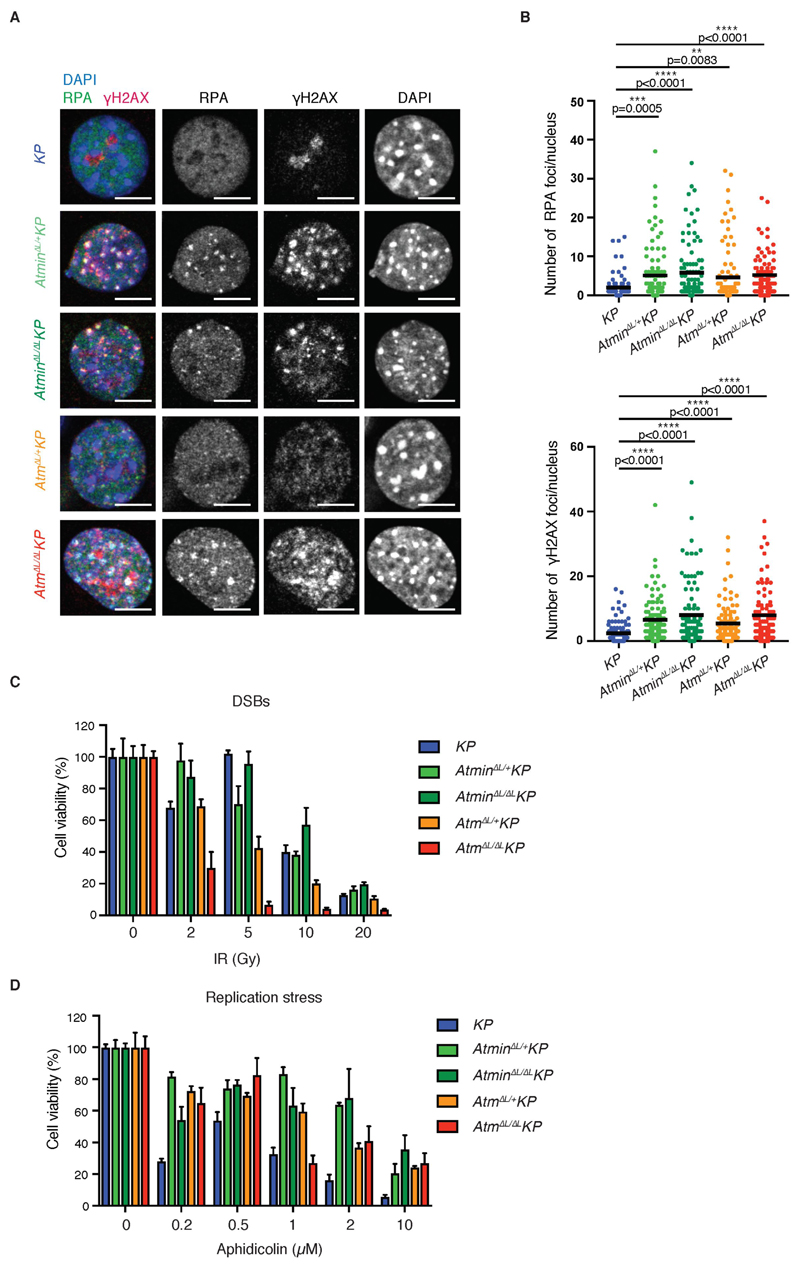
To functionally dissect the tumor suppressive function of ATMIN and ATM in LUAD, we examined spontaneous DNA damage in primary tumors and isolated lung tumor cells (Fig. 4A, B and Supplementary Fig. S7A). Both heterozygous and homozygous ATM or ATMIN-deficient cells showed increased RPA and γH2AX foci compared with KP lung tumor cells (Fig. 4A, B), suggesting increased single-strand (ss) DNA exposure, double-strand DNA breaks (DSBs) and/or deficiencies in processing these lesions. Whereas AtmΔL/ΔL KP cells were more sensitive to ionizing radiation (IR), AtminΔL/ΔL KP cells were slightly less sensitive to IR than KP control cells (Fig. 4C), in line with the known competition of ATMIN and NBS1 for ATM in the response to IR (Supplementary Fig. S7B)(18). The opposing effects of ATM and ATMIN deficiency on IR survival suggest that an altered response to DSBs is not responsible for the tumor suppressive effect of ATM and ATMIN. However, following aphidicolin treatment, despite impaired replication stress-induced ATM signaling (Supplementary Fig. S7B), both AtminΔL/ΔL KP and AtmΔL/ΔL KP lung tumor cells showed improved survival compared with KP cells (Fig. 4D). This suggests that ATM and ATMIN deficiency confers resistance to replication stress. In contrast, both AtminΔL/ΔL KP and AtmΔL/ΔL KP cells showed only mild sensitivity to oxidative stress (Supplementary Fig. S7C). Thus, our data suggest that ATMIN is a crucial haploinsufficient tumor suppressor at the FRA16D locus, and that impaired ATM signaling in response to replication stress contributes to ATMIN’s tumor suppressor function.
Figure 4. ATM or ATMIN-deficient lung tumor cells are more resistant to replication stress.
A) Representative images showing RPA foci and γH2AX foci formation in cells of the indicated genotypes. Scale bar, 50 μm.
B) Quantitative analysis of RPA and γH2AX foci per nucleus. Dots represent one nucleus. Three independent experiments were performed and at least 100 nuclei were imaged and quantified. Horizontal line indicates the arithmetic mean; significance estimated by Mann-Whitney U non-parametric test.
C) Quantification of cell viability following irradiation. Values are arithmetic mean of 3 biological replicates + SEM; significance estimated using Student’s T-test.
D) Quantification of cell viability in response to aphidicolin-induced replication stress. Values are arithmetic mean of 3 biological replicates + SEM; significance estimated using Student’s T-test.
Supplementary Material
Acknowledgements
We are grateful to the Biological Research Facility, Equipment Park, and FACS facility at the Francis Crick Institute. We thank C. Cremona for manuscript editing, and all members of the Behrens lab for comments on the manuscript.
Financial support: This work was supported by the Francis Crick Institute which receives its core funding from Cancer Research UK (FC001039), the UK Medical Research Council (FC001039) and the Wellcome Trust (FC001039); and by an ERC grant (ATMIN281661) to A.B.
Footnotes
Conflict of Interest statement: There are no conflicts of interest to declare for all authors.
References
- 1.Letessier A, Millot GA, Koundrioukoff S, Lachages AM, Vogt N, Hansen RS, et al. Cell-type-specific replication initiation programs set fragility of the FRA3B fragile site. Nature. 2011;470:120–3. doi: 10.1038/nature09745. [DOI] [PubMed] [Google Scholar]
- 2.Durkin SG, Glover TW. Chromosome fragile sites. Annu Rev Genet. 2007;41:169–92. doi: 10.1146/annurev.genet.41.042007.165900. [DOI] [PubMed] [Google Scholar]
- 3.Bignell GR, Greenman CD, Davies H, Butler AP, Edkins S, Andrews JM, et al. Signatures of mutation and selection in the cancer genome. Nature. 2010;463:893–8. doi: 10.1038/nature08768. [DOI] [PMC free article] [PubMed] [Google Scholar]
- 4.Bednarek AK, Laflin KJ, Daniel RL, Liao Q, Hawkins KA, Aldaz CM. WWOX, a novel WW domain-containing protein mapping to human chromosome 16q23.3-24.1, a region frequently affected in breast cancer. Cancer Res. 2000;60:2140–5. [PubMed] [Google Scholar]
- 5.Becker S, Markova B, Wiewrodt R, Hoffarth S, Hahnel PS, Pleiner S, et al. Functional and clinical characterization of the putative tumor suppressor WWOX in non-small cell lung cancer. J Thorac Oncol. 2011;6:1976–83. doi: 10.1097/JTO.0b013e31822e59dd. [DOI] [PubMed] [Google Scholar]
- 6.Hazan I, Aqeilan RI. Current questions and controversies in chromosome fragile site research: does WWOX, the gene product of common fragile site FRA16D, have a passive or active role in cancer? Cell Death Discov. 2015;1:15040. doi: 10.1038/cddiscovery.2015.40. [DOI] [PMC free article] [PubMed] [Google Scholar]
- 7.Schrock MS, Batar B, Lee J, Druck T, Ferguson B, Cho JH, et al. Wwox-Brca1 interaction: role in DNA repair pathway choice. Oncogene. 2017;36:2215–27. doi: 10.1038/onc.2016.389. [DOI] [PMC free article] [PubMed] [Google Scholar]
- 8.Loizou JI, Sancho R, Kanu N, Bolland DJ, Yang F, Rada C, et al. ATMIN is required for maintenance of genomic stability and suppression of B cell lymphoma. Cancer Cell. 2011;19:587–600. doi: 10.1016/j.ccr.2011.03.022. [DOI] [PMC free article] [PubMed] [Google Scholar]
- 9.Blake SM, Stricker SH, Halavach H, Poetsch AR, Cresswell G, Kelly G, et al. Inactivation of the ATMIN/ATM pathway protects against glioblastoma formation. eLife. 2016;5:e08711. doi: 10.7554/eLife.08711. [DOI] [PMC free article] [PubMed] [Google Scholar]
- 10.Zha S, Sekiguchi J, Brush JW, Bassing CH, Alt FW. Complementary functions of ATM and H2AX in development and suppression of genomic instability. Proceedings of the National Academy of Sciences of the United States of America. 2008;105:9302–6. doi: 10.1073/pnas.0803520105. [DOI] [PMC free article] [PubMed] [Google Scholar]
- 11.Kanu N, Penicud K, Hristova M, Wong B, Irvine E, Plattner F, et al. The ATM cofactor ATMIN protects against oxidative stress and accumulation of DNA damage in the aging brain. The Journal of biological chemistry. 2010;285:38534–42. doi: 10.1074/jbc.M110.145896. [DOI] [PMC free article] [PubMed] [Google Scholar]
- 12.Jackson EL, Willis N, Mercer K, Bronson RT, Crowley D, Montoya R, et al. Analysis of lung tumor initiation and progression using conditional expression of oncogenic K-ras. Genes & development. 2001;15:3243–8. doi: 10.1101/gad.943001. [DOI] [PMC free article] [PubMed] [Google Scholar]
- 13.Marino S, Vooijs M, van Der Gulden H, Jonkers J, Berns A. Induction of medulloblastomas in p53-null mutant mice by somatic inactivation of Rb in the external granular layer cells of the cerebellum. Genes & development. 2000;14:994–1004. [PMC free article] [PubMed] [Google Scholar]
- 14.DuPage M, Dooley AL, Jacks T. Conditional mouse lung cancer models using adenoviral or lentiviral delivery of Cre recombinase. Nat Protoc. 2009;4:1064–72. doi: 10.1038/nprot.2009.95. [DOI] [PMC free article] [PubMed] [Google Scholar]
- 15.Farncombe TH. Software-based respiratory gating for small animal conebeam CT. Med Phys. 2008;35:1785–92. doi: 10.1118/1.2905031. [DOI] [PubMed] [Google Scholar]
- 16.Gao J, Aksoy BA, Dogrusoz U, Dresdner G, Gross B, Sumer SO, et al. Integrative analysis of complex cancer genomics and clinical profiles using the cBioPortal. Sci Signal. 2013;6:pl1. doi: 10.1126/scisignal.2004088. [DOI] [PMC free article] [PubMed] [Google Scholar]
- 17.Ding L, Getz G, Wheeler DA, Mardis ER, McLellan MD, Cibulskis K, et al. Somatic mutations affect key pathways in lung adenocarcinoma. Nature. 2008;455:1069–75. doi: 10.1038/nature07423. [DOI] [PMC free article] [PubMed] [Google Scholar]
- 18.Zhang T, Cronshaw J, Kanu N, Snijders AP, Behrens A. UBR5-mediated ubiquitination of ATMIN is required for ionizing radiation-induced ATM signaling and function. Proceedings of the National Academy of Sciences of the United States of America. 2014;111:12091–6. doi: 10.1073/pnas.1400230111. [DOI] [PMC free article] [PubMed] [Google Scholar]
- 19.Gyorffy B, Surowiak P, Budczies J, Lanczky A. Online survival analysis software to assess the prognostic value of biomarkers using transcriptomic data in non-small-cell lung cancer. PloS one. 2013;8:e82241. doi: 10.1371/journal.pone.0082241. [DOI] [PMC free article] [PubMed] [Google Scholar]
Associated Data
This section collects any data citations, data availability statements, or supplementary materials included in this article.


