Summary
Guillain–Barré syndrome (GBS) is characterized by acute immune‐mediated peripheral neuropathy, which may result in rapidly progressive paralysis and fatal respiratory failure. As the underlying pathological mechanisms of GBS are unclear, we surveyed the transcriptome of rats with experimental autoimmune neuritis (EAN), a model of GBS. Briefly, sciatic nerves on both sides were collected from 8–10‐week‐old Lewis rats during early (10 days post‐induction), peak (19 days) and late neuritis (30 days). Total RNA was sequenced to identify differentially expressed genes. Compared to control rats without induced neuritis, 33 genes were differentially expressed in the early phase (14 up‐regulated and 19 down‐regulated), with an adjusted P‐value < 0·05 and |log2 fold‐change| >1, as were 137 genes in the peak phase (126 up‐regulated and 11 down‐regulated) and 60 genes in the late phase (58 up‐regulated and two down‐regulated). Eleven of these genes were common to all stages, suggesting their crucial roles throughout the disease course. Analysis of protein–protein interactions revealed Fos, Ccl2, Itgax and C3 as node genes at different stages. Functional analysis of differentially expressed genes identified biological processes and pathways that are activated as neuritis progresses. This is the first genomewide gene expression study of peripheral nerves in experimental autoimmune neuritis model. Dynamic gene expression and significantly altered biological functions were detected in different phases of the disease, increasing our understanding of the molecular mechanisms underlying EAN and highlighting potential targets for its diagnosis and treatment.
Keywords: experimental autoimmune neuritis, genomewide analysis, Guillain–Barré syndrome, peripheral nerve, RNA sequencing
Introduction
Guillain–Barré syndrome (GBS) is an immune‐mediated peripheral neuropathic disease that may result in rapidly progressive limb paralysis and fatal respiratory dyspnea 1, 2. Generally, GBS has an acute onset, is associated with prodromal infection and is typically self‐limiting. Based on the discovery of associated antibodies and given the effectiveness of immunoglobulin and plasma exchange therapy, GBS was suggested to be an acquired autoimmune disorder 3, 4. However, its underlying mechanisms remain unclear 2.
Experimental autoimmune neuritis (EAN), which is used as a GBS model in animals, is characterized by T cell infiltration and demyelination lesions in sciatic nerves. Indeed, rats with EAN exhibit progressive limbs weakness along with immune and inflammatory reactions, but tend to eventually recover on their own, a course similar to that observed in humans 5, 6. The biological processes driving EAN are complex and include an initial autoimmune reaction, myelin sheath destruction in the peak phase and finally myelin self‐repair 7, 8. While specific mechanisms driving EAN have been investigated, an integrative model has not been developed.
Genomewide surveys can provide more integrative insight into pathophysiological mechanisms; several of these studies have already been conducted, including those evaluating peripheral nerve injury and multiple sclerosis. Importantly, such studies may identify relevant biological processes and possible therapeutic targets, both in patients and animal models 9, 10. However, a genomewide survey of transcription in the peripheral nerve tissues of animal model with EAN has not been conducted. Thus, we collected RNA sequencing data at the early, peak and late stages of EAN to identify all associated biological processes, to understand the initiation and eventual suppression of autoimmunity and to seek new treatment opportunities.
Materials and methods
Animal model
Female Lewis rats 8–10 weeks of age (180 ± 10 g) were obtained from Vital Rival Laboratory Animal (Beijing, China). Rats were housed under specific pathogen‐free conditions at the animal facility of Harbin Medical University, and on a 12‐h light–dark cycle. Sterile water and dry pellet feed were provided. Animals were cared for in strict accordance with the recommendations of the National Institutes of Health, as provided in the Guide for the Care and Use of Laboratory Animals (NIH Publication no. 85–23, revised 1996). Protocols were approved by the Animal Care and Use Committee at Harbin Medical University (no. 2019013).
EAN was induced as previously described 11. Briefly, rats were subcutaneously injected at the base of the tail with 200 μl of an emulsion containing 230 μg myelin P2 peptide (amino acids 53–78; TESPFKNTEISFKLGQEFEETTADNR; GL Biochem, Shanghai, China), 2 mg Mycobacterium tuberculosis H37RA (Difco, Detroit, MI, USA), 100 μl Freund’s incomplete adjuvant (Sigma, St Louis, MO, USA) and 100 μl saline. Control animals (sham) were injected with an inoculum containing 100 µl saline and 100 µl Freund’s incomplete adjuvant.
Experimental design
As shown in Fig. 1, 40 rats [12 for RNA sequencing, 12 for quantitative reverse transcription–polymerase chain reaction (qRT–PCR) and 16 for immunohistochemistry] were randomly divided into a control group and groups for euthanasia at the early (10 days post‐induction, dpi), peak (19 dpi) and late stage (30 dpi) of EAN. Neurological status was scored by two independent and blinded observers according to frequently used standards, i.e. 0, normal; 1, less lively; 2, impaired righting/limb tail; 3, absent righting; 4, ataxic gait, abnormal position; 5, mild paraparesis; 6, moderate paraparesis; 7, severe paraplegia; 8, tetraparesis; 9, moribund; and 10, death 12. The rats were euthanized after anesthetization with 10% chloral hydrate. Bilateral sciatic nerve tissues 15 mm from the lumbar spinal cord were collected.
Figure 1.
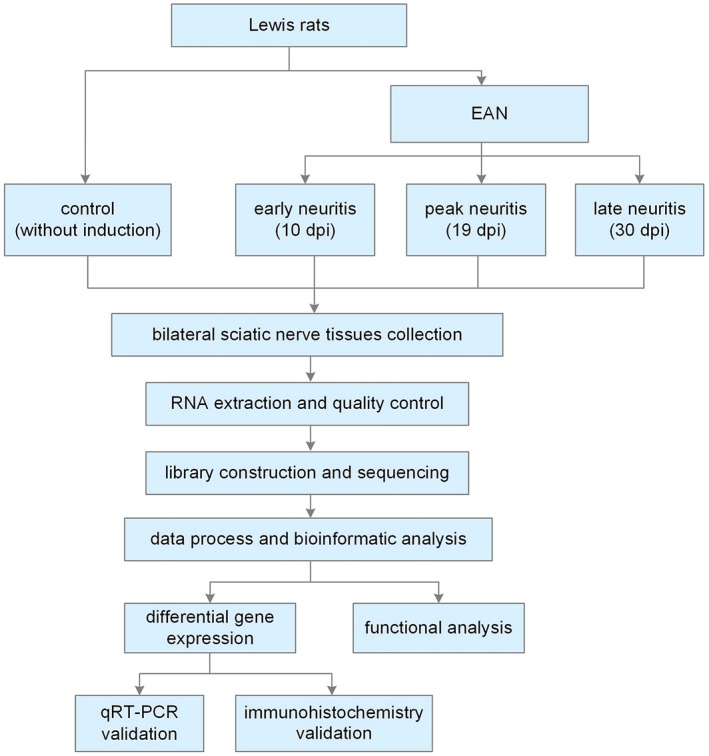
Experimental design; dpi = days after induction.
RNA isolation, quantification and quality control
Total RNA was extracted from the sciatic nerve tissues using TRIzol reagent (Invitrogen, Carlsbad, CA, USA). RNA degradation and contamination were assessed by 1% agarose gel electrophoresis. RNA integrity and concentration were evaluated on a Bioanalyzer 2100 system (Agilent Technologies, Santa Clara, CA, USA) using an RNA Nano 6000 Assay Kit.
Library construction and sequencing
RNA amplification, library construction and collection of raw reads were performed using Annoroad (Beijing, China) on an Illumina HiSeq PE150 platform. Specifically, magnetic beads with oligo(dT) were used to enrich the mRNA after the total RNA samples were qualified, and mRNA was fragmented by fragmentation buffer. The fragmented mRNAs were used as the template, and the reaction solution containing random hexamer primers were used for first‐strand cDNA synthesis. RNase H and DNA polymerase I were subsequently used to synthesize the second‐strand cDNA. Subsequently, the cDNA fragments were purified with the QiaQuick PCR extraction kit. the Then the double‐stranded cDNA was subjected to end‐repair, and the polyA and sequencing connector were added. The target fragments were recovered by agarose gel electrophoresis, and PCR amplification was performed to complete the preparation of the entire library. Finally, the constructed library was sequenced.
Data process and analysis
Filter
The useful Perl script was used to filter the original data (raw reads) to guarantee the data quality. The contaminated reads for adapters (read bases containing more than five base pairs of adapter sequences), low‐quality reads (number of read bases whose phred quality value was ≤19, accounting for more than 15%) and reads whose N base value was >5% of the total bases in raw reads were removed. The contents of Q30 of clean reads were calculated. All subsequent analysis was based on clean reads.
Alignment and expression estimation
Reference gene and genome annotation files were downloaded from the ENSEMBL website (http://www.ensembl.org/index.html). Bowtie version 1.0.1 was used to build the reference genome library, and then clean reads were compared to the reference genome using HISAT2 version 2.1.0 13. The fragments per kilobase per million mapped fragments value was calculated to estimate the expression level of genes in each sample. Raw and processed data are available in the National Center for Biotechnology Information Gene Expression Omnibus repository (http://www.ncbi.nlm.nih.gov/geo, Accession number GSE133750).
Differential expression analysis
DESeq2 version 1.6.3 was applied to estimate the expression of each gene in a sample by linear regression and the P‐value was calculated by the Wald test. Benjamini and Hochberg’s approach was used to adjust the P‐values to control the false discovery rate. Genes with adjusted P‐value < 0·05 and |log2 fold‐change| ≥ 1 were considered as differentially expressed. Venn diagrams were obtained with eulerAPE to show the number of specific and common genes differing between groups 14. Differentially expressed genes and samples were clustered hierarchically using heatmap.2, and principal component analysis (PCA) was performed using the pca3d package in r version 3.5.3.
Protein–protein interaction networks
Differentially expressed genes were uploaded to string‐db version 11.0, an online tool, and interaction scores >0.4 were selected as significant 15. The networks were visualized with Cytoscape version 3.7.1 software 16.
Functional enrichment analysis
Biological processes enrichment of gene ontology, a widely used method for annotating genes and gene products, was performed using g:Profiler (https://biit.cs.ut.ee/gprofiler_archive2/r1760_e93_eg40/web/) 17. The criteria for selection were as follows: size of functional category of 2–1000 and size of the query/term intersection was 2. Results with q‐values < 0·05 are reported. EnrichmentMap in Cytoscape was used for visualization with default options (edge cut‐off = 0·375, node cut‐off = 0.1) 18.
The Kyoto Encyclopedia of Genes and Genomes (KEGG) is a collection of databases for acquiring information on genomes and biological pathways. Interaction networks among differentially expressed genes and associated KEGG pathways were constructed using ClueGo and CluePedia in Cytoscape, which visualize pathways for large clusters of genes in a functionally in grouped network 19. ClueGO is updatable based on the newest KEGG data. A P ≤ 0·05 and kappa score of 0·4 were used as threshold values. Pathways including at least four genes were retrieved.
Real‐time qRT–PCR
To validate the RNA sequencing data, six genes were quantified by qRT–PCR. Briefly, the RNAs were reverse‐transcribed into cDNAs in a reaction including 1 μg of total rat sciatic nerve RNA, 4 μl of ×5 TransScript All‐in‐one SuperMix, 1 μl of gDNA remover and RNase‐free water according to the kit instructions (Transgen Biotech, Beijing, China). The reaction was carried out at 37°C for 15 min and 85°C for 5 s. The cDNAs were detected by qRT–PCR with Top Green qPCR SuperMix (Transgen Biotech) in a 20‐μl reaction mixture which contained 1 μg of template, 10 μl of TransStart® Top Green qPCR SuperMix, 0·4 μl of forward primers, 0·4 μl of reverse primers and nuclease‐free water. The following thermal cycling conditions were applied on the LightCycler 96 Instrument (Basel, Switzerland): preincubation at 95°C for 10 min, 45 cycles of amplification: 95°C for 10 s, 60°C for 10 s and signal detection at 72°C for 10 s with detection and cooling at 37°C for 30 s. Expression was normalized to that of the housekeeping gene glyceraldehyde 3‐phosphate dehydrogenase (GADPH), and relative levels were determined by the ΔΔCt method. Primer sequences are listed in Table 1.
Table 1.
Quantitative reverse transcription–polymerase chain reaction (qRT–PCR) primers
| Gene | Forward primer 5′–3′ | Reverse primer 5′–3′ |
|---|---|---|
| Alox15 | CCACCTGGATCTTCTCAAGC | GCAGGGCGTCTTTAGCATAG |
| Egr1 | AGAAGGACAAGAAAGCAGACAAAAGTGT | GGGGACGGGTAGGAAGAGAG |
| Alas2 | CTCCGAGGCATCTATGGCATC | ACACGAGGGTGTCTGCTTATG |
| C3 | AGAAGCGTCTCCATCAAGATTCC | ACCACTGTCACGTACTTGTGC |
| Ccl2 | TAGCATCCACGTGCTGTCTC | GGACCCATTCCTTATTGGGGT |
| Fos | AGACGAGAAGTCTGCGTTGC | TCCAGGGAGGTCACAGACAT |
| GAPDH | AGGTCGGTGTGAACGGATTTG | GGGGTCGTTGATGGCAACA |
Immunohistochemistry
Immunohistochemistry was performed to confirm the presence of hub nodes in the sciatic nerve during EAN. Paraffin‐embedded sciatic nerve sections were dewaxed, rehydrated and incubated with 10% hydrogen peroxide. Next, heating‐mediated antigen retrieval was performed in sodium citrate or ethylenediamine tetraacetic acid (EDTA) buffer. The sections were incubated with different antibodies, including rabbit anti‐c‐Fos antibody (1 : 100; ABclonal, Woburn, MA, USA), rabbit anti‐ITGAX antibody (1 : 200; ABclonal), mouse anti‐Ccl2 antibody (1 : 200; Proteintech, Rocky Hill, NJ, USA) and rabbit anti‐C3 antibody (1 : 100; ABclonal), overnight at 4°C, followed by further reaction with the corresponding secondary antibodies at room temperature for 20 min. After incubation in diaminobenzidine and staining with hematoxylin, the sections were observed and photographed under a microscope.
Results
Dynamic neurological changes in rats with EAN
All rats were normal (score 0) prior to induction of EAN. The first symptom of a neurological deficit, tail weakness, was observed approximately 4 days after induction, with clinical scores averaging 1 ± 0·447. Neurological deficits gradually worsened thereafter. Clinical scores peaked at 7·2 ± 0·2 at 19 days post‐induction, at which point both hind limbs were completely paralyzed. However, the mean clinical score steadily declined soon after. In contrast, neurological deficits were not observed in control animals, except for slight tail weakness due to pain at the injection site. In addition, marked loss of body weight was observed in rats with neuritis (Fig. 2).
Figure 2.
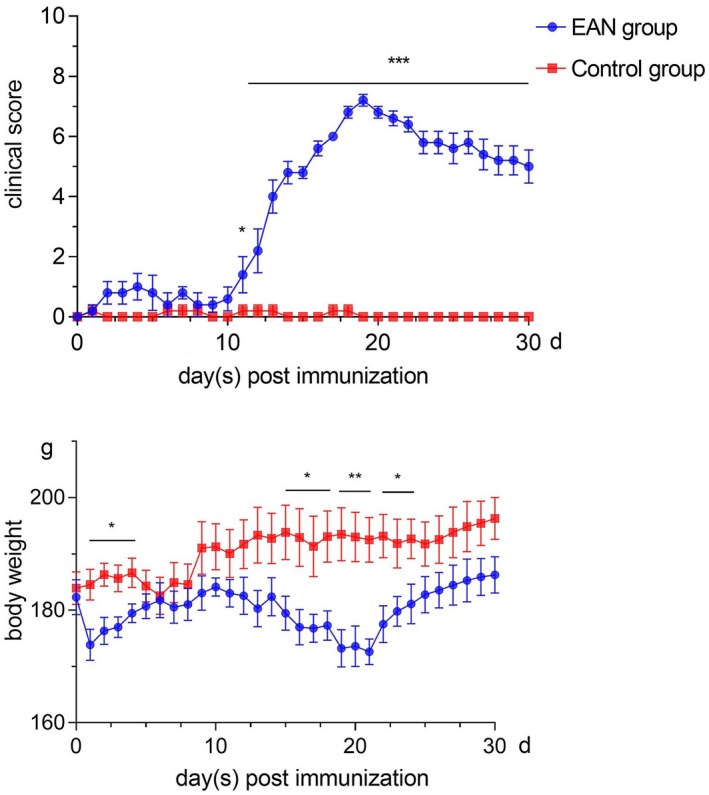
Dynamic changes in neurological scores and body weight. Data are the mean ± standard error of the mean (s.e.m.) determined using GraphPad Prism version 7 (GraphPad Software, Inc., San Diego, CA, USA). Differences between pairs of groups were tested by Student’s t‐test (*P < 0·05, **P < 0·01, ***P < 0·001, n = 5 per group).
Identification of expressed transcripts in the rat sciatic nerves transcriptome
Twelve cDNA libraries were constructed within four groups, including the control, early, peak and late neuritis groups (n = 3 per group). A total of 39 331 572–49 330 868 raw reads were obtained in each library. The average numbers of clean reads were 38 935 843 (97·45%), 39 476 227 (96·98%), 44 246 324 (97·11%) and 45 409 853 (96·99%) in the abovementioned four groups, respectively, after filtering the low‐quality reads (Supporting information, Table S1). Clean reads with 95·82–96·41% of tags mapped to the genome uniquely were used for subsequent analyses (Supporting information, Table S2).
Differential gene expression due to EAN in sciatic nerves
Compared to control rats, 33 genes were differentially expressed during early neuritis, with 14 up‐regulated and 19 down‐regulated. Similarly, 137 genes were differentially expressed at the peak stage, among which 126 were up‐regulated and 11 were down‐regulated. Finally, 60 genes were differentially expressed in late neuritis, with 58 up‐regulated and two down‐regulated (Fig. 3). The number and identity of up‐ and down‐regulated genes are summarized in Table 2 and Supporting information, Table S3. Hierarchical clustering analysis was performed to globally group the 12 samples in terms of differentially expressed genes. Genes were clustered into groups of stage‐specific, differentially expressed genes, with a view to classify samples as EAN or unaffected. The expression of some genes was altered during different stages of the disease, while that of others was more stable (Fig. 4a). PCA with three principal components (PC1, 2 and 3) was performed, which further supported the clustering result. The contributions of PC1, 2 and 3 were 21·85, 18·69 and 11·02%, respectively. The analysis plot revealed a distinct separation between the control and EAN groups, with low variance in the sequencing data (Fig. 4b).
Figure 3.
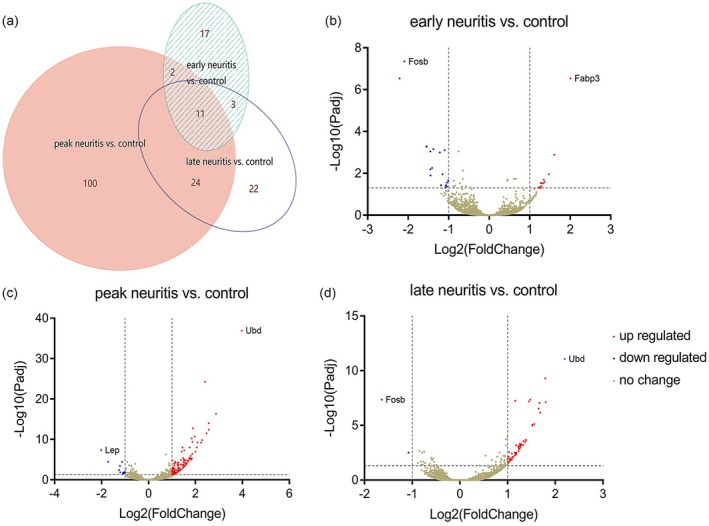
Genes differentially expressed at different stages of experimental autoimmune neuritis (EAN). (a) Venn diagram. (b–d) Volcano map, with significantly up‐regulated genes shown in red, significantly down‐regulated genes shown in blue and unchanged genes shown in khaki.
Table 2.
Number of up‐ and down‐regulated genes at different stages of experimental autoimmune neuritis (EAN)
| Up‐regulated | Down‐regulated | Total | |
|---|---|---|---|
| Early neuritis versus control | 14 | 19 | 33 |
| Peak neuritis versus control | 126 | 11 | 137 |
| Late neuritis versus control | 58 | 2 | 60 |
Figure 4.
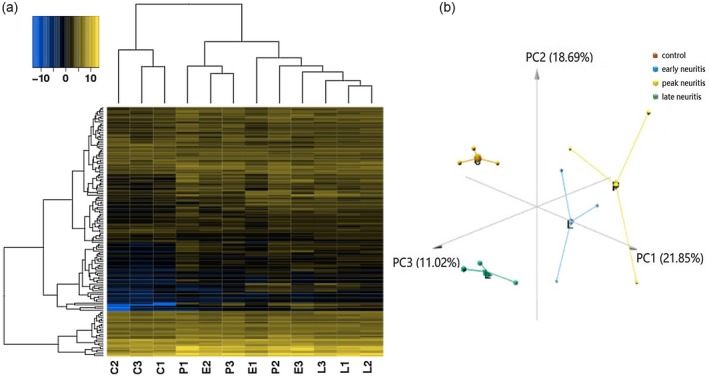
Hierarchical clustering and principal component analysis (PCA). (a) Heat‐map of genes differentially expressed at different stages of experimental autoimmune neuritis (EAN). The change from blue to yellow in the color key represents the change from low expression to high expression. (b) PCA showing the percentage variability captured by the first three principal components is displayed across PC1, 2 and 3 represented on different axes. C = control; E = early neuritis; P = peak neuritis; L = late neuritis.
Overlap of differentially expressed genes
As shown in Fig. 3a, 11 genes were differentially expressed throughout the course of EAN, among which 10 were up‐regulated and one was down‐regulated. The temporal changes in expression of these genes are plotted in Fig. 5.
Figure 5.
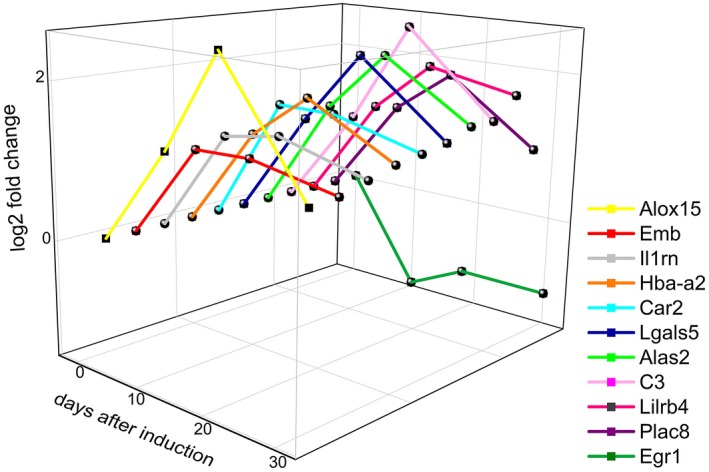
Dynamic changes in 11 genes differentially expressed throughout neuritis, with stage plotted on the x‐axis, genes plotted on the y‐axis and log2 fold‐change plotted on the z‐axis.
Protein–protein networks and hub nodes
To detect significant functional modules during the progression of EAN, protein–protein networks were constructed from genes differentially expressed at each stage. Interaction and combined scores were retrieved from the string database. We obtained visualized networks using Cytoscape software. According to the degree score of each gene in the networks, Fos was a hub node in early neuritis with the highest score. The network became more complex at the peak stage, with more differentially expressed genes identified and with Ccl2 and Itgax as nodes. C3 was found to be an important hub node in late neuritis (Fig. 6).
Figure 6.
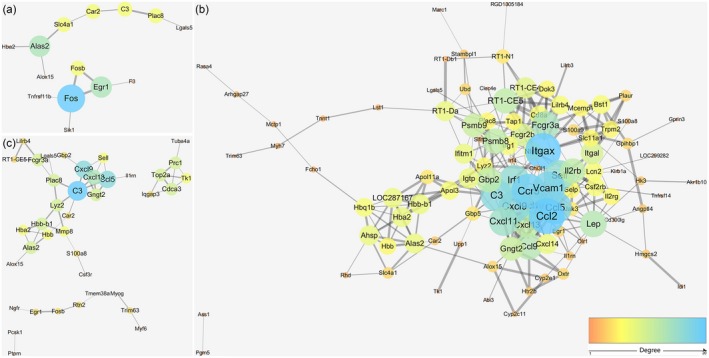
Protein–protein interaction networks of genes differentially expressed at early (a), peak (b) and late (c) neuritis. Each node represents a protein. The node size and line width correlate with the degree and combined score of interaction, respectively. Disconnected nodes are not shown.
Functional enrichment
Enrichment of biological processes
Biological processes of gene ontology were analyzed during early, peak and late neuritis, respectively (Fig. 7). In the early phase, responses to lipid, hormone and corticosterone were enriched, among others, while inflammation and immune‐related processes, including cellular chemotaxis response, regulation of vasoconstriction, maternal process and response to zinc ion, were significantly enriched at the peak phase. In late neuritis, response to endogenous stimulus, skeletal muscle development, leukocyte chemotaxis and response to electrical stimulus were enriched.
Figure 7.
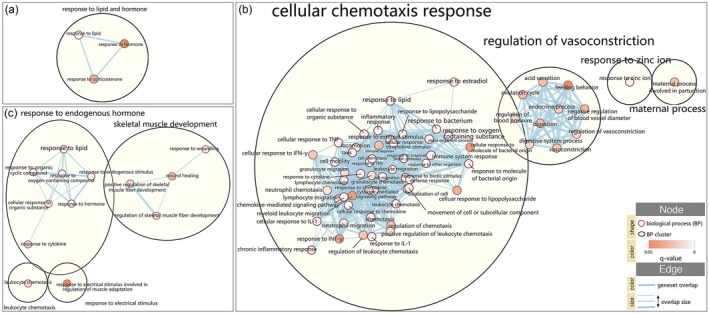
Biological processes cluster generated by the Cytoscape Enrichment Map of g:profiler results for different stages of neuritis. (a) Early neuritis, (b) peak neuritis, (c) late neuritis. Enrichment map was created with parameters q < 0·1 and Jaccard overlap combined coefficient >0·35. Nodes represent enriched biological processes, which are grouped and annotated by their similarity according to connected components cluster.
Enrichment of KEGG pathways
Osteoclast differentiation was significantly enriched among genes differentially expressed in early neuritis. At the peak stage, a larger number of pathways was significantly enriched, with cytokine–cytokine receptor interaction, malaria, viral myocarditis, Staphylococcus aureus infection and primary immunodeficiency as potentially key pathways. In late neuritis, four enriched pathways were identified: phagosome, cytokine–cytokine receptor interaction, chemokine signaling pathway and tuberculosis (Fig. 8).
Figure 8.
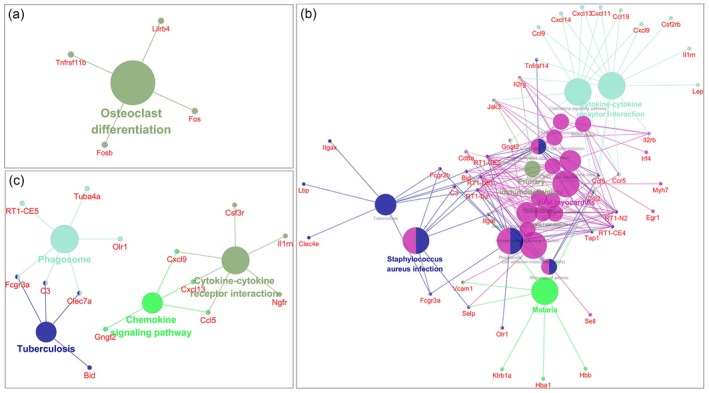
Kyoto Encyclopedia of Genes and Genomes (KEGG) pathways enriched among genes differentially expressed at early (a), peak (b) and late (c) stages of neuritis. Each node represents a pathway item. The node size relates to pathway significance: a smaller false discovery rate (FDR) value has a larger node size at different neuritis stages. Different node colors represent different functional groups. The most significant pathway of each group is highlighted. The edge between nodes reflects shared or common genes: a wider edge indicates a larger overlap.
qPCR and immunohistochemistry validation
To verify expression profiles obtained by RNA sequencing, three genes differentially expressed throughout the course of EAN (Alox15, Alas2 and Egr1) were quantified by qRT–PCR, along with three hub nodes in protein–protein networks (Fos, Ccl2 and C3). Twelve rats grouped as described for RNA sequencing (n = 3 per group) were used in this experiment. The results showed that the expression patterns of six genes were similar to those of RNA sequencing (Fig. 9). To validate the expression and tissue localization of proteins encoded by genes, immunohistochemistry analysis was performed for hub nodes at different stages during EAN (Fig. 10). Compared to controls, Fos showed a lower expression in early neuritis and was expressed mainly in Schwann cells. Itgax and Ccl2 showed visible positive expression in the nerve tissue at peak neuritis and was expressed in both Schwann cells. C3 showed positive expression at late neuritis and was expressed mainly in Schwann cells and vascular endothelial cells.
Figure 9.
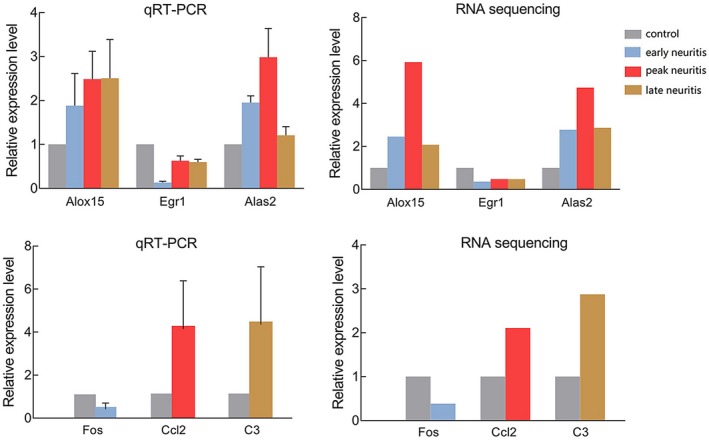
Quantitative reverse transcription–polymerase chain reaction (qRT–PCR) of select differentially expressed genes. The relative expression level of different mRNAs was obtained by the ΔΔCt method, and the relative mRNA expression value in controls was regarded as 1. Data are the mean ± standard error of the mean (s.e.m.), n = 3 per group.
Figure 10.
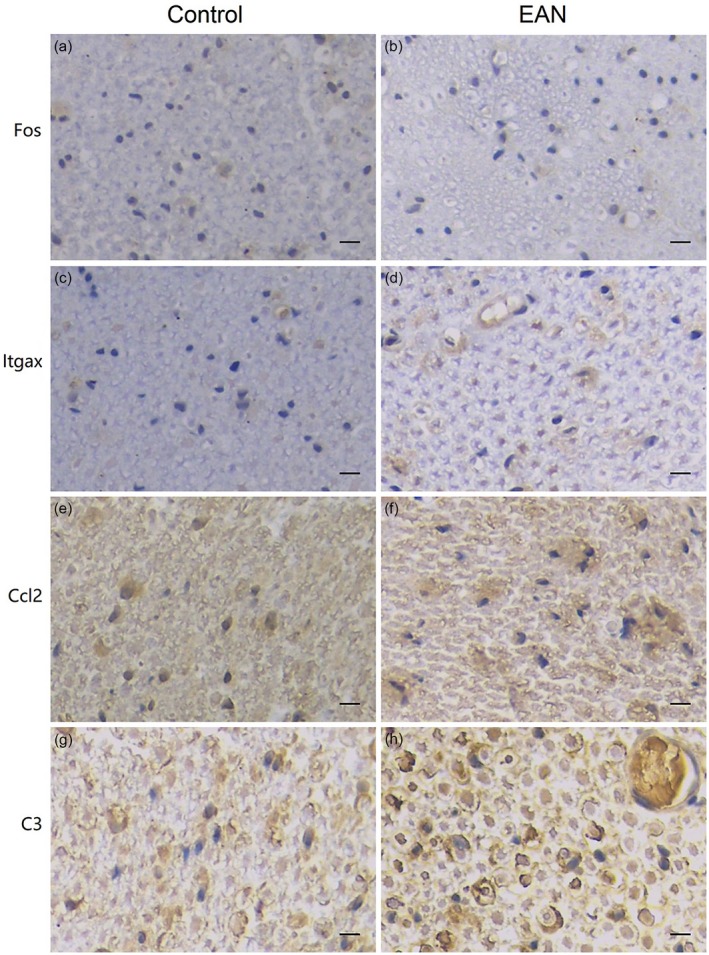
Expression of hub genes in the sciatic nerves of experimental autoimmune neuritis (EAN) rats. Immunohistochemical staining of Fos (early neuritis), Itgax (peak neuritis), Ccl2 (peak neuritis) and C3 (late neuritis) demonstrated the presence of hub nodes, n = 4 per group, magnification ×400 for all images. Scale bar = 20 μm.
Discussion
Animals with EAN are model of GBS, an autoimmune disorder of the peripheral nervous system in humans 5. Because the development of neuritis is not fully understood 6, we surveyed the transcriptome in the early, peak and late stages of neuritis to catalog the entire spectrum of biological processes in pathological nerves.
Differentially expressed genes were mainly enriched in three biological processes in early neuritis, including responses to lipid, hormone and corticosterone, which appear to be a reaction to stress induced by subcutaneous immunization. According to protein–protein interaction analysis, Fos was located at the hub node in the network of early neuritis. As the protein product of an immediate early gene, Fos is a known marker of the response to nerve injury stimulation 20, 21. Our results suggest that Fos plays an important role in the stress reaction during the early stage of EAN, even in the very early immune response. Consistent with the minor clinical manifestations and pathological lesions observed during this stage in EAN animals, we detected no clear immune response in functional clustering. Studies focusing on the immune organs, such as the spleen and lymph nodes, may be useful for detecting the initial autoimmune reaction in early neuritis.
During the peak phase of EAN, infiltrating lymphocytes mediate immunity, causing inflammatory damage to the myelin sheath 8. Thus, a detailed understanding of the pathological mechanisms in this phase may provide new opportunities to mitigate myelin sheath injury. Cytokine‐mediated responses, such as processes regulated by interleukin‐1, interferon‐gamma and tumor necrosis factor, were observed, along with lipopolysaccharide‐related processes, which are thought to significantly contribute to disease development by recruiting effector cells to the peripheral nerves and by enabling the in‐situ release of other products toxic to Schwann cells and myelin, such as free radicals, oxygen intermediates and nitric oxide 22, 23. Several chemokines and chemokine receptors, including Ccr5, Ccl genes (Ccl2, 5, 9, 19) and Cxcl genes (Cxcl 9, 11, 13), are significantly up‐regulated and act as key factors. Notably, Ccl2‐Ccr2, Cxcl10‐Cxcr3 and Ccl5‐Ccr5 pairs were previously implicated in autoimmune neuritis and GBS 24, consistent with the hypothesis that chemokines and chemokine receptors are typically inflammatory 25. Our data provide further evidence that chemokines, particularly Ccl2, are involved in neuritis. Thus, specific chemokines and their corresponding receptors may be useful as therapeutic targets for GBS or EAN.
Hormone responses, such as maternal process, response to estradiol and regulation of vasoconstriction, were detected during the peak stage, along with the participation of the oxytocin receptor (Oxtr). The molecular mechanisms of oxytocin signaling have been reported in many neurological disorders, mainly focusing on the synaptic connection of the central nervous system or the dorsal root ganglion of the peripheral nervous system 26, 27. The role of oxytocin signaling, particularly that of the Oxtr, in the peak stage of EAN requires further analysis. In addition, ion transport signals, particularly those of the zinc ion, appear to be significant in the peak phase. Indeed, ion channels have been implicated in other autoimmune diseases, including experimental autoimmune encephalomyelitis and optic neuritis 28, 29.
Late neuritis is accompanied by a reduction in immune‐related processes and enhancement of self‐regulatory reactions 30. Hence, analysis of this period may provide new methods for preventing disease progression. Notably, endogenous stimulus responses, such as hormones, lipids and organic molecules, are enriched during this phase. Skeletal muscle development and electrical stimulus, which are involved in regulating muscle adaptation, also play roles in this phase. The cellular factors secreted by muscles may guide the repair of myelin sheaths. Additionally, the phagosome was significantly enriched in the KEGG analysis of peak neuritis, suggesting a role in the nerve repair process. It was also previously reported that the autophagy pathway, which balances the beneficial and detrimental effects of immunity and inflammation, plays protective roles in the defense against autoimmune and inflammatory diseases 31.
Several genes were differentially expressed at more than one stage; notably, early growth response 1 (Egr1) was down‐regulated throughout the course of neuritis. The product of Egr1 is required for cell differentiation 32. The following may explain its reduction during neuritis: (a) up‐regulation of multiple genes during the severe immune and inflammation responses of EAN directly inhibits the expression of Erg1; and (b) Because of the plasticity of Schwann cells, the cells undergo de‐differentiation before re‐differentiating following demyelination to promote recovery 33, 34. Egr1 may be a candidate regulator of Schwann cell de‐differentiation and serve as a therapeutic target for EAN.
This study is limited by the small sample size used. The specific roles of key genes and functional pathways should also be verified in further experiments. Additionally, considering the female predominance in most autoimmune diseases, we evaluated female rats as the animal model in this study. We chose prepuberty rats of the same age to synchronize the female hormonal cycle before starting the experiments. A larger sample size and male control groups should be used in future studies.
Disclosures
The authors declare no conflicts of interest.
Author contributions
Y. X. performed the experiments, analyzed the data and wrote the manuscript; P. Q. Y. designed the experiments and analyzed the data; G. Z. L. and D. Z. designed the experiments and reviewed the manuscript. All authors read and approved the final manuscript.
Ethical approval
All animal protocols were compliant with the ethical standards of Harbin Medical University (no. 2019013).
Supporting information
Table S1. Data filtering statistics.
Table S2. Clean read mapping statistical analysis.
Table S3. Differential expressed genes in sciatic nerves at different stages of EAN. Adjusted P‐value < 0·05 and |log2 fold change| ≥ 1. FC, fold change. a. early neuritis vs. control. b. peak neuritis vs. control. c. late neuritis vs. control.
Acknowledgements
This project was supported by the National Natural Science Foundation of China (grant number 81873773).
Contributor Information
G. Li, Email: liguozhonghmu@163.com.
D. Zhong, Email: dityanhmu@163.com.
References
- 1. Yuki N, Hartung H. Guillain‐Barré syndrome. N Engl J Med 2012; 366:2294–304. [DOI] [PubMed] [Google Scholar]
- 2. Wijdicks EF, Klein CJ. Guillain‐Barré syndrome. Mayo Clin Proc 2017; 92:467–79. [DOI] [PubMed] [Google Scholar]
- 3. Heikema AP, Islam Z, Horst‐Kreft D et al Campylobacter jejuni capsular genotypes are related to Guillain–Barré syndrome. Clin Microbiol Infect 2015; 21:e1–9. [DOI] [PubMed] [Google Scholar]
- 4. Rodríguez Y, Rojas M, Pacheco Y et al Guillain–Barré syndrome, transverse myelitis and infectious diseases. Cell Mol Immunol 2018; 15:547–62. [DOI] [PMC free article] [PubMed] [Google Scholar]
- 5. Hahn AF. Experimental allergic neuritis (EAN) as a model for the immune‐mediated demyelinating neuropathies. Rev Neurol (Paris) 1996; 152:328–32. [PubMed] [Google Scholar]
- 6. Soliven B. Animal models of autoimmune neuropathy. ILAR J 2014; 54:282–90. [DOI] [PMC free article] [PubMed] [Google Scholar]
- 7. Aström KE, Webster HD, Arnason BG. The initial lesion in experimental allergic neuritis. A phase and electron microscopic study. J Exp Med 1968; 128:469–95. [DOI] [PMC free article] [PubMed] [Google Scholar]
- 8. Zhang HL, Zheng XY, Zhu J. Th1/Th2/Th17/Treg cytokines in Guillain‐Barré syndrome and experimental autoimmune neuritis. Cytokine Growth Factor Rev 2013; 24:443–53. [DOI] [PubMed] [Google Scholar]
- 9. Itoh N, Itoh Y, Tassoni A et al Cell‐specific and region‐specific transcriptomics in the multiple sclerosis model: focus on astrocytes. Proc Natl Acad Sci USA 2018; 115:E302–9. [DOI] [PMC free article] [PubMed] [Google Scholar]
- 10. Guo Q, Zhu H, Wang H et al Transcriptomic landscapes of immune response and axonal regeneration by integrative analysis of molecular pathways and interactive networks post‐sciatic nerve transection. Front Neurosci 2018; 12:457. [DOI] [PMC free article] [PubMed] [Google Scholar]
- 11. Sun Y, Chen H, Ma S et al Administration of SB203580, a p38 MAPK inhibitor, reduced the expression of MMP9, and relieved neurologic severity in the experimental autoimmune neuritis (EAN) in rats. Neurochem Res 2015; 40:1410–20. [DOI] [PubMed] [Google Scholar]
- 12. Enders U, Toyka KV, Hartung HP, Gold R. Failure of intravenous immunoglobulin (IVIg) therapy in experimental autoimmune neuritis (EAN) of the Lewis rat. J Neuroimmunol 1997; 76:112–6. [DOI] [PubMed] [Google Scholar]
- 13. Kim D, Langmead B, Salzberg SL. HISAT: a fast spliced aligner with low memory requirements. Nat Methods 2015; 12:357–60. [DOI] [PMC free article] [PubMed] [Google Scholar]
- 14. Micallef L, Rodgers P. eulerAPE: drawing area‐proportional 3‐Venn diagrams using ellipses. PLOS ONE 2014; 9:e101717. [DOI] [PMC free article] [PubMed] [Google Scholar]
- 15. Szklarczyk D, Gable AL, Lyon D et al STRING v11: protein–protein association networks with increased coverage, supporting functional discovery in genomewide experimental datasets. Nucleic Acids Res 2019; 47:D607–13. [DOI] [PMC free article] [PubMed] [Google Scholar]
- 16. Shannon P, Markiel A, Ozier O et al Cytoscape: a software environment for integrated models of biomolecular interaction networks. Genome Res 2003; 13:2498–504. [DOI] [PMC free article] [PubMed] [Google Scholar]
- 17. Reimand J, Arak T, Adler P et al g:Profiler – a web server for functional interpretation of gene lists (2016 update). Nucleic Acids Res 2016; 44:W83–9. [DOI] [PMC free article] [PubMed] [Google Scholar]
- 18. Reimand J, Isserlin R, Voisin V et al Pathway enrichment analysis and visualization of omics data using g:Profiler, GSEA, Cytoscape and EnrichmentMap. Nat Protoc 2019; 14:482–517. [DOI] [PMC free article] [PubMed] [Google Scholar]
- 19. Bindea G, Mlecnik B, Hackl H et al ClueGO: a cytoscape plug‐in to decipher functionally grouped gene ontology and pathway annotation networks. Bioinformatics 2009; 25:1091–3. [DOI] [PMC free article] [PubMed] [Google Scholar]
- 20. Hunt SP, Pini A, Evan G. Induction of c‐fos‐like protein in spinal cord neurons following sensory stimulation. Nature 1987; 328:632–4. [DOI] [PubMed] [Google Scholar]
- 21. Fujisawa N, Terayama R, Yamaguchi D, Omura S, Yamashiro T, Sugimoto T. Fos protein‐like immunoreactive neurons induced by electrical stimulation in the trigeminal sensory nuclear complex of rats with chronically injured peripheral nerve. Exp Brain Res 2012; 219:191–201. [DOI] [PubMed] [Google Scholar]
- 22. Wang Y, Zhang J, Luo P, Zhu J, Feng J, Zhang HL. Tumor necrosis factor‐α in Guillain‐Barré syndrome, friend or foe? Expert Opin Ther Targets 2017; 21:103–12. [DOI] [PubMed] [Google Scholar]
- 23. Zhang HL, Wu L, Wu X, Zhu J. Can IFN‐γ be a therapeutic target in Guillain–Barré syndrome? Expert Opin Ther Targets 2014; 18:355–63. [DOI] [PubMed] [Google Scholar]
- 24. Chiang S, Ubogu EE. The role of chemokines in Guillain–Barré syndrome. Muscle Nerve 2013; 48:320–30. [DOI] [PMC free article] [PubMed] [Google Scholar]
- 25. Hughes CE, Nibbs RJB. A guide to chemokines and their receptors. FEBS J 2018; 285:2944–71. [DOI] [PMC free article] [PubMed] [Google Scholar]
- 26. Bakos J, Srancikova A, Havranek T, Bacova Z. Molecular mechanisms of oxytocin signaling at the synaptic connection. Neural Plast 2018; 2018:4864107. [DOI] [PMC free article] [PubMed] [Google Scholar]
- 27. Boada MD, Gutierrez S, Eisenach JC. Peripheral oxytocin restores light touch and nociceptor sensory afferents towards normal after nerve injury. Pain 2019; 160:1146–55. [DOI] [PMC free article] [PubMed] [Google Scholar]
- 28. Das A, Guyton MK, Smith A et al Calpain inhibitor attenuated optic nerve damage in acute optic neuritis in rats. J Neurochem 2013; 124:133–46. [DOI] [PMC free article] [PubMed] [Google Scholar]
- 29. Bianchi B, Smith PA, Abriel H. The ion channel TRPM4 in murine experimental autoimmune encephalomyelitis and in a model of glutamate‐induced neuronal degeneration. Mol Brain 2018; 11:41. [DOI] [PMC free article] [PubMed] [Google Scholar]
- 30. Luo B, Han F, Xu K et al Resolvin D1 programs inflammation resolution by increasing TGF‐ß expression induced by dying cell clearance in experimental autoimmune neuritis. J Neurosci 2016; 36:9590–603. [DOI] [PMC free article] [PubMed] [Google Scholar]
- 31. Levine B, Mizushima N, Virgin HW. Autophagy in immunity and inflammation. Nature 2011; 469:323–35. [DOI] [PMC free article] [PubMed] [Google Scholar]
- 32. Knapska E, Kaczmarek L. A gene for neuronal plasticity in the mammalian brain: Zif268/Egr‐1/NGFI‐A/Krox‐24/TIS8/ZENK? Prog Neurogibol 2004; 74:183–211. [DOI] [PubMed] [Google Scholar]
- 33. Jessen KR, Mirsky R, Lloyd AC. Schwann cells: development and role in nerve repair. Cold Spring Harb Perspect Biol 2015; 7:a020487. [DOI] [PMC free article] [PubMed] [Google Scholar]
- 34. Boerboom A, Dion V, Chariot A, Franzen R. Molecular mechanisms involved in Schwann cell plasticity. Front Mol Neurosci 2017; 10:38. [DOI] [PMC free article] [PubMed] [Google Scholar]
Associated Data
This section collects any data citations, data availability statements, or supplementary materials included in this article.
Supplementary Materials
Table S1. Data filtering statistics.
Table S2. Clean read mapping statistical analysis.
Table S3. Differential expressed genes in sciatic nerves at different stages of EAN. Adjusted P‐value < 0·05 and |log2 fold change| ≥ 1. FC, fold change. a. early neuritis vs. control. b. peak neuritis vs. control. c. late neuritis vs. control.


