

Mol Med Rep 16: 703-709, 2017; DOI: 10.3892/mmr.2017.6679
Subsequently to the publication of this article, the authors have realized that Fig. 4 contained some incorrectly incorporated data panels; specifically, the A-d, B-b and B-c panels did not display the correct data. The revised version of Fig. 4 featuring the correct data for the A-d, B-b and B-c panels is shown on the next page.
Figure 4.
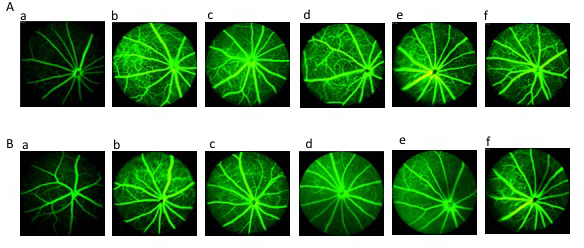
Retinal imaging using FA in each group. (A) Results of the fundus examination using FA prior to drug intervention in the (a) normal, (b) DM, (c) Met, (d) TNTL-h, (e) TNTL-m and (f) TNTL-1 groups. (B) Results of the fundus examination using FA after the 18-week drug intervention in the (a) normal, (b) DM, (c) Met, (d) TNTL-h, (e) TNTL-m and (f) TNTL-1 groups. Magnification, ×40. Normal, C57BL mice; DM, untreated C57BLdb/db mice; Met, C57BLdb/db mice treated with metformin; TNTL-h, TNTL-m and TNTL-l, C57BLdb/db mice treated with 1.8, 0.9 and 0.45 g/kg body weight Tangningtongluo, respectively. FA, fluorescein angiography.
Note that these errors did not affect the overall conclusions reported in the paper. The authors apologize to the Editor of Molecular Medicine Reports and to readership for any inconvenience caused.