

Abstract
The purpose of this study is to develop and validate rapid magnetic resonance acoustic radiation force imaging (MR-ARFI) using a single shot spiral readout for focused ultrasound (FUS) guidance and for local tissue displacement measurements. A magnetic resonance guided FUS system was used to focus a 3 MHz ultrasound beam to a predetermined position. MR-ARFI was performed with a Bruker 7T MRI using a modified single-shot spiral readout, with additional motion encoding gradients that convert local displacement into the phase image. Post processing was then used to analyze the resulting displacement and to evaluate the method’s performance for the detection of tissue changes resulting from thermal ablation. The single-shot spiral readout acquires a single MR-ARFI image in one second, which is up to two orders of magnitude faster than conventional 2D spin-warp spin echo that acquires the k-space data line by line. The ARFI displacement in tissue mimicking phantoms was detected and localized with less than 5% geometric distortion. The ARFI displacement was also measured pre and post thermal ablation in an ex-vivo chicken breast. For transmitted peak negative pressure of 8.6 MPa, the maximum displacement of the tissue that was ablated to 70°C was 78% lower than the pre-ablated tissue. Since spiral readout is not prone to geometrical distortion, it is well-suited for FUS guidance, without generating undesired temperature elevation. Additionally, local displacement measurements of tissues can be performed rapidly during thermal ablation procedures and may help to assess the success of the treatment.
Keywords: MRgFUS, Spiral, Single-shot spiral, MR-ARFI
1. INTRODUCTION
Magnetic resonance guided focused ultrasound (MRgFUS) allows noninvasive thermal surgical procedures (Cline et al 1993). In an MRgFUS thermal ablation procedure, high intensity focused ultrasound (FUS) is targeted into the body in order to locally heat and ablate a specific region. FUS provides deep tissue penetration, with highly localized induced strain. An MRI scanner is used to guide the FUS beam and monitor the elevated temperature. MRgFUS provides an alternative to surgical resection. Ongoing clinical trials include ablation of brain, breast, liver, and prostate tumors (Chapman and Ter Haar 2007, Jolesz and McDannold 2008, Jolesz 2009).
FUS guidance is required in order to localize the beam within the tumor. Typically, the guidance is performed by transmitting a long, reduced intensity pulse, which slightly elevates the tissue temperature at the focal point. This elevated temperature is detected with MR thermometry, and the feedback is used to localize the focal spot, which is then shifted to the desired location (Fite et al 2012, Rieke et al 2013). This process requires unnecessary and undesired heating that may cause damage to healthy tissue.
Magnetic resonance acoustic radiation force imaging (MR-ARFI) is an alternative imaging technique that enables visualization of the FUS spot (McDannold and Maier 2008). In MR-ARFI, the sample is imaged using the MRI while it is being stimulated by a short (few milliseconds) FUS pulse, which locally displaces the focal area within the tissue by several microns to tens of microns (McDannold and Maier 2008, Huang et al 2009, Holbrook et al 2011). Additional motion encoding gradients (MEG) that are synced with the FUS source are introduced into the MRI sequence in order to encode the motion into the phase data, which can later be converted into a displacement image (Pauly 2015).
MR-ARFI is used for localizing the FUS beam during ultrasound thermal ablation treatments without unnecessary heating (Larrat et al 2010, Kaye et al 2011) and is also used for aberration correction (Hertzberg et al 2010, Kaye et al 2011, Grissom et al 2012, Mougenot et al 2016). Additionally, since thermal ablation increases the stiffness of the treated tissue (Wu et al 2001), and the ARFI displacement relates to the stiffness of the tissue, MR-ARFI may provide feedback on the success of a FUS thermal ablation treatment in real time (Liu et al 2015, 2017). However, the acquisition time for a single MR-ARFI image is on the order of minutes using standard 2D spin-warp readout (Kaye et al 2011, Liu et al 2015), which makes it challenging to implement in the clinic where multiple volumes are often ablated (Hynynen and McDannold 2004).
Faster MRI readout sequences such as echo-planar imaging (EPI) (Stehling et al 1991) and spiral readout (Ahn et al 1986) have great potential for accelerating the ARFI measurements by reducing the acquisition time by up to two orders of magnitude compared to standard 2D spin-warp readout. EPI has been used for MR-ARFI measurements (Chen et al 2010, Kaye et al 2011, Auboiroux et al 2012); however, since EPI is sensitive to motion and prone to ghosting and geometric distortions (Glover 2012), it may be inadequate for FUS guidance applications. In comparison to EPI, spiral readout has reduced sensitivity to motion, and it does not suffer from geometric distortions (Glover 2012). Spiral readout permits shorter TEs than EPI and offers relative robustness against flow artifacts, since the first gradient moments are zero in the k-space center and continue to be nulled once per turn of the trajectory (Meyer et al 1992, Nishimura et al 1995, Börnert et al 1999). These advantages make the single-shot spiral acquisition attractive for a number of purposes, such as diffusion-weighted imaging (Liu et al 2004, Wilm et al 2017a), arterial spin labeling (Meyer et al 2011), and BOLD fMRI (Noll et al 1995, Glover and Lai 1998). While spiral readout typically exhibits blurring artifacts that reduce the image resolution, recent advances have reached unprecedented image quality (Wilm et al 2017b, Engel et al 2018). Additionally, spiral readout has been used for MR thermometry (Fielden et al 2015). Compared to standard spin-warp MR-ARFI, both EPI and spiral based MR-ARFI have lower signal to noise ratio (SNR) impairs the detection of small displacements. Nevertheless, the SNR is sufficient for applications of FUS guidance and displacement estimation. To our knowledge, MR-ARFI has previously not been performed with a spiral readout.
In this paper we present MR-ARFI using a single-shot spiral readout for FUS guidance and for thermal ablation monitoring. The method is experimentally validated using tissue mimicking phantoms and ex-vivo chicken breast.
2. MATERIALS AND METHODS
2.1. Magnetic Resonance Imaging
The MR imaging was performed using a Bruker Biospec 70/30 (7T) small animal MRI scanner (Bruker BioSpin MRI, Ettlingen, Germany) with a 154 mm internal diameter circularly polarized coil for radio frequency transmitting (Bruker 1H volume coil), a 20 mm ring surface coil for RF receiving (Bruker multi-purpose planar surface coil), and a gradient system with 200 mT/m maximum amplitude and 640 T/m/sec slew rate (Bruker B-GA-20S).
2.2. Focused Ultrasound
The FUS system (Fig. 1a) consisted of an MR-compatible pulse generation system and a 2D positioning system (Image Guided Therapy, France), incorporating an MR-compatible 16-element annular array transducer with a center frequency of 3 MHz (IMASONIC SAS, France). The array aperture diameter was 48 mm, and the radius of curvature was 35 mm, yielding a -6 dB focal volume of 0.5×0.5×2 mm3 (Liu et al 2015).
Fig. 1.
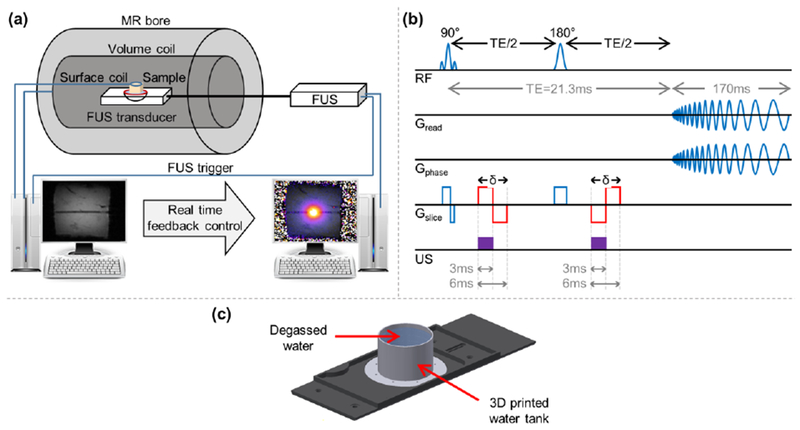
Experimental setup scheme. (a) Illustration of the MRgFUS system. (b) Pulse sequence programming of a spin-echo spiral readout. The red lines represent the two additional MEGs that were added to the sequence in order to convert changes in local displacement into the phase image. (c) Spiral trajectory calibration setup.
2.3. MR-ARFI acquisition sequence
ARFI images were acquired using a modified spin-echo spiral out sequence (Fig. 1b), with the following parameters: TR (repetition time) / TE (echo time)/ flip angle (FA) = 1 to 8 sec/ 21.3 msec/ 90°, refocusing angle (RA) = 180°, bandwidth (BW) = 357 kHz, FOV = 50 × 50 mm2, matrix = 256 × 256, slice thickness = 1 mm, 1 slice, MEG duration (δ) = 6 msec (total duration for both lobes). The spiral readout duration was 170 msec with 61034 sampling points and an angular frequency of 0.75 kHz. Given these parameters, in the MRI system used in this study the gradients approach their maximum slew rate, and therefore the TR cannot be lower than 1 sec. The MEG, which convert local displacement to a shift in the phase of the complex MR signal, were programmed into the sequence, and an ultrasound pulse was triggered by the MRI scanner. The sequence was a spin-echo, and thus a second ultrasound pulse and inverted MEG were added after the refocusing pulse. The FUS pulses were triggered by the MR in order to synchronize them with the additional MEG. The ultrasound beam and the resulting radiation force were oriented vertically (Fig. 1a); thus, the MEG were programmed to encode the motion along the ultrasound propagation direction which was in the slice direction for the coronal ARFI images that were acquired during this study.
The residual phase image was converted into a displacement map using (Liu et al 2015):
| (1) |
where Δφ is the phase difference between the phase image acquired using the MEG while the FUS is working and the reference image without the FUS, γ is the proton gyromagnetic ratio, and G is the MEG amplitude. For the trapezoidal gradients used in this study, approximating the gradient waveform to a rectangle is justified when the rise time is small compared to the duration of the gradient applied. The gradients slew rate was 640 T/m/s, and thus for MEG strength of 80mT/m and 3 msec (single MEG lobe duration), the error introduced by the trapezoidal approximation is ~4%, which justifies the approximation.
2.4. MR FLASH image acquisition methodology
FLASH magnitude images (Frahm et al 1986) were acquired during the ARFI experiments for visual reference, with the following parameters; TR/ TE/ FA = 135 msec/ 7.2 msec/ 30°, bandwidth = 50 kHz, FOV = 50 × 50 mm2, matrix = 256 × 256, slice thickness = 1 mm, 1 slice.
2.5. MR thermometry methodology
The temperature rise during thermal ablation was found from the following proton resonance frequency relationship (Rieke and Pauly 2008):
| (2) |
where φ(T) is the phase of a current image, φ(T0) is the phase of a reference (baseline) image at a known temperature, α = -0.01 ppm/°C is the proton resonance frequency shift coefficient, B0 is the magnetic field strength and TE is the echo time.
2.6. Protocol for MR spiral trajectory calibration
In order to reduce artifacts caused by field inhomogeneity, an initial step of trajectory calibration was performed using a built-in Bruker protocol which uses a 3-domain design for Archimedean spiral trajectories (Oberhammer et al 2010). Prior the calibration, local shimming inside a volume of 50 × 50 × 50 mm3 was performed in order to improve the homogeneity of B0. The calibration requires a uniform sample and thus, a water tank that can be mounted onto the MRgFUS setup was designed and 3D printed (Fig. 1c). The trajectory calibration is a preliminary step that is performed once prior to the experiments. The trajectory is then saved as part of the MR scan protocol for use in later experiments.
2.7. Ultrasound protocol for MR-ARFI and MRgFUS ablation
MR-ARFI and ablation were both performed with the same 3 MHz transducer. Ablation was achieved with an acoustic pressure of 3.1 MPa peak negative pressure (PNP), while the ablated area was scanned in circular patterns with diameters of 2 and 6 mm with a scan speed of 1 revolution per second, until the target temperature of 55°C or 70°C was reached. The temperature was monitored in real time via MR thermometry using the proton resonance frequency shift of water protons (Quesson et al 2000).
The range of ultrasound transmitted PNP studied for ARFI imaging was 3.6 - 8.6 MPa, using two 3 msec pulses. This range was chosen as 3.6 MPa was the minimum pressure for which the ARFI was detected, and above 8.6 MPa the phase image saturated due to phase wrapping artifacts. Phantom studies were performed using a PNP in the center of this range (5.5 MPa). Ex-vivo studies were performed using a PNP of 8.6 MPa (measured in water) at a depth of ~1.3 cm. Assuming an attenuation coefficient of 0.5 dB/cm/MHz, the pressure is expected to decrease by 1.95 dB or 36% over this depth and therefore, the pressure at the focus is estimated as ~5.5 MPa. In order to generate the displacement map, two images were captured; the first image was a reference image, captured without FUS, and the second image was captured while the FUS was transmitting. The reference phase image, with the FUS off was subtracted from the ARFI phase image, and the residual phase image was lineally scaled to a displacement map using Eq. (1).
2.8. Experimental protocol for evaluation of the effect of TR on the SNR of the ARFI map
MR-ARFI can be used to map not just a single point, but an entire region using a point by point scan. Single-shot spiral readout uses only one shot to acquire all k-space points used for reconstruction. Thus, for a single ARFI point the TR has no effect on the acquisition time. However, if several ARFI images are to be acquired successively on the same slice, the TR will affect the scan time and the SNR, and thus the sensitivity to displacement (Gudbjartsson and Patz 1995). The TR should be sufficiently long compared to the T1 of the sample being imaged to facilitate a high SNR acquisition.
In order to test the effect of TR on the magnitude signal and phase noise, displacement maps were generated successively using different values (TR = 1, 1.5, 3, 5, 8 sec). In each displacement image the SD of the image was calculated, and the process was repeated 10 times for statistical analysis.
Within the experiment to evaluate the SNR, the T1 was calculated with a variable TR RARE sequence (2D RARE sequence, RARE factor = 2, TR = 100, 300, 500, 800, 1000, 1500, 3000, 5000 msec, TE = 9 msec, FOV = 30 × 30 mm2, matrix = 64 × 64, slice thickness = 1mm, 1 slice). The MR signal intensity (SI) as a function of TR was then fitted to an equation of the form:
| (3) |
where M0 is the equilibrium magnetization.
2.9. Protocol for evaluation of MR image geometrical distortion resulting from the spiral reconstruction
To evaluate the degree of geometric distortion of the sequence, the FUS transducer was mechanically shifted by ±5 mm increments in 2D to create a matrix of nine unique spatial positions within the phantom. ARFI images were then acquired at each position, and the distortion was calculated using the following equation (Smith 2000):
| (4) |
where AD is the actual distance from the center that was calculated by finding the spatial location of the maximum displacement and PD is the predicted distance from the center based on the known mechanical location of the transducer.
2.10. Protocol for 3D MR visualization of the ARFI spot
To visualize the ARFI spot in 3D, nine 1 mm slices with no gap were acquired using a set of ultrasound pulses such that ±4 mm from the FUS natural focus was captured. For each slice, the maximum displacement and the full width half max (FWHM) of the ARFI spot were measured in order to demonstrate that the ARFI spot can be localized in 3D. For statistical analysis, five repetitions of the 3D ARFI acquisition were performed.
2.11. Protocol for measurement of MR-ARFI maximum displacement following thermal ablation
The maximum displacement of the ARFI spot was measured in the displacement maps as a function of the applied acoustic pressure (3.6-8.6 MPa PNP measured in water-only) while the tissue was at ambient temperature and following ablation at temperatures of 55°C and 70°C, with the tissue being allowed to return to ambient temperature prior to MR-ARFI image acquisition.
2.12. Protocol for passive cavitation detection during the ARFI pulse insonation
The US echoes were recorded passively using a 5 MHz single-element transducer (0.75 inch diameter, 2 inch focus, ILO0506HP Valpey Fisher) that was either coupled to the ex-vivo sample using US gel, or placed in a water tank (Fig. 1c) at the same distance from the FUS transducer. The echoes were recorded during sonication with the 3 msec ARFI pulse at pressures of 3.6-8.6 MPa PNP. The received echoes were displayed using a digital oscilloscope (DPO4034, Tektronix, OR, USA) and saved for post processing in Matlab.
2.13. Phantom materials
Both a tissue mimicking phantom and ex vivo tissue were used for evaluation of our ARFI methodology. 1.5% agarose (Alfa Aesar, MA, USA) was used for fabricating tissue-mimicking phantoms. The agarose powder was mixed with deionized water at ambient temperature and heated until all powder was dissolved. The solution was degassed under vacuum, then poured into a mold and allowed to cool at ambient temperature.
An ex-vivo chicken breast was purchased fresh and unfrozen at a local grocery store. No degassing was performed prior to imaging. Bubbles were not observed in the MR images while using fresh chicken breast and all experiments were conducted with fresh samples. Bubbles were not detected within the MR images and cavitation effects were not observed.
3. RESULTS
3.1. ARFI in an agar phantom
The spiral MR-ARFI sequence was initially validated in a homogeneous 1.5% agarose phantom, in order to test the method feasibility. A reference (without FUS) phase image (Fig. 2a) was subtracted from the FUS phase image (Fig. 2b) to generate the displacement map (Fig. 2c). In order to present the maximum displacement, vertical and horizontal cross sections of the ARFI spot are also presented (Fig. 2c).
Fig. 2.
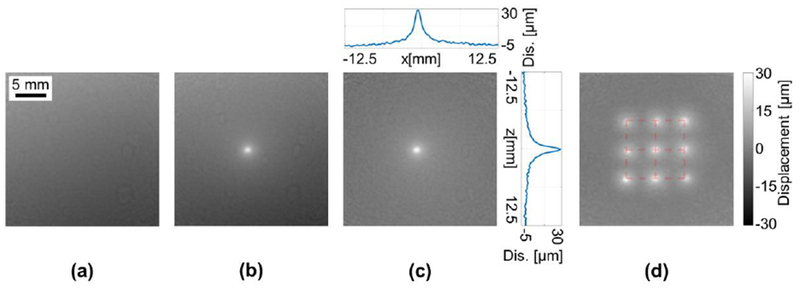
Spiral ARFI in 1.5% Agarose phantom. The displacement bar is common to subfigures (c) and (d). (a) Reference phase image without FUS. (b) Phase image acquired while the FUS was transmitting. (c) Displacement image generated by subtracting the reference image from the FUS image and scaling according to Eq. (1). Vertical and horizontal cross sections of the ARFI point are also presented. (d) Maximum intensity projection of the displacement of nine ARFI points with ±5 mm mechanical displacement of the FUS focal spot. The red grid represents the mechanical position of the transducer at each insonation point.
In order to test the distortion of the spiral based ARFI image and verify that it can be used for FUS guidance, the FUS transducer was mechanically shifted by ±5 mm increments in 2D to create a matrix of nine unique spatial positions within the phantom. ARFI images were acquired at each position and a maximum intensity projection of the displacement was generated (Fig. 2d). The resulting spatial distortion was 3.7 ± 1.7%.
The same grid of nine ARFI spots (Fig. 2d) was further used to evaluate the repeatability of the spiral method. The maximum displacement of the ARFI spots was 24.13 ± 3.45 μm, and the FWHM was 1.48 ± 0.14 mm. Both the maximum displacement and the FWHM measurements provided repeatable results and thus confirmed the repeatability of the method.
3.2. ARFI in an ex-vivo sample
An MR-ARFI image of ex-vivo chicken breast was acquired to evaluate the performance of the spiral MR-ARFI method inside a biological sample. A magnitude-reconstructed FLASH image of the chicken breast was acquired for visual reference (Fig. 3a) followed by a magnitude-reconstructed spiral image (Fig. 3b). While the spiral image exhibits noticeable blurring compared to the FLASH image, this is an expected manifestation of off-resonance effects when imaging with a spiral sequence and is preferable to the translational errors introduced by off-resonance effects commonly seen in fast Cartesian scans. Indeed, no geometrical distortion was observed in the spiral magnitude image. The MR-ARFI imaging process was then performed, similar to the phantom experiment. A reference (without FUS) phase image (Fig. 3c) was subtracted from the phase image with FUS (Fig. 3d) to generate a displacement map (Fig. 3e). The dark band around the ARFI spot is the onset of a shear wave propagating away from the focal spot. While the ARFI spot is clearly visible in the pre-subtracted phase image, the subtraction process removes most of the phase artifacts and generates a cleaner image of the ARFI spot.
Fig. 3.
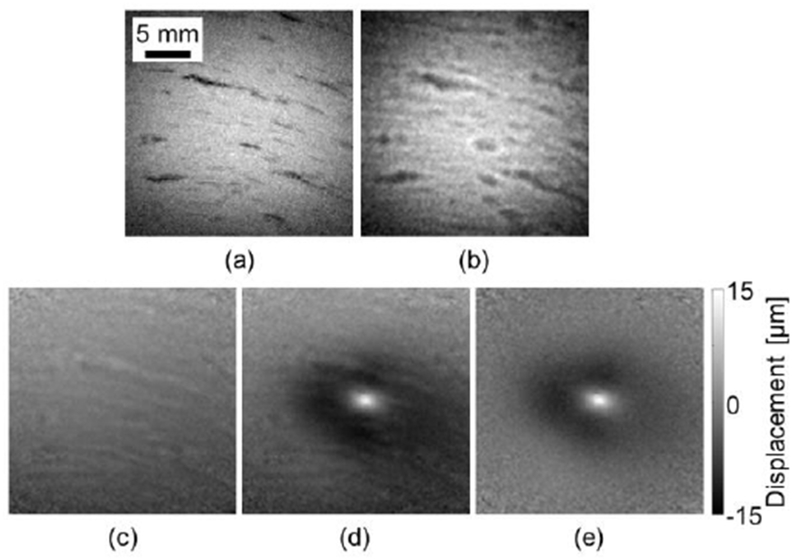
Spiral ARFI in an ex-vivo chicken breast. (a) A FLASH magnitude image. (b) A spiral magnitude image. (c) Reference phase image without FUS. (d) Phase image with FUS transmitting. (e) Displacement image generated by subtracting the reference image from the FUS image and scaling to displacement via Eq. (1).
In order to guide the FUS in 3D, the ARFI spot also needs to be localized in depth. A 3D visualization of the ARFI spot was generated using successive slice imaging. Due to the highly-focused ultrasound beam, the ARFI spot was primarily visualized within ±2 mm of the geometric focus of the transducer (Fig. 4a). For the ultrasound parameters applied here, the maximum displacement of the ARFI spot at each slice peaked at 14.5 μm at the focal location (Fig. 4b). As expected, the FWHM of the ARFI also reaches a minimal value at the focal point. Thus, it is possible to localize the FUS beam in 3D.
Fig. 4.
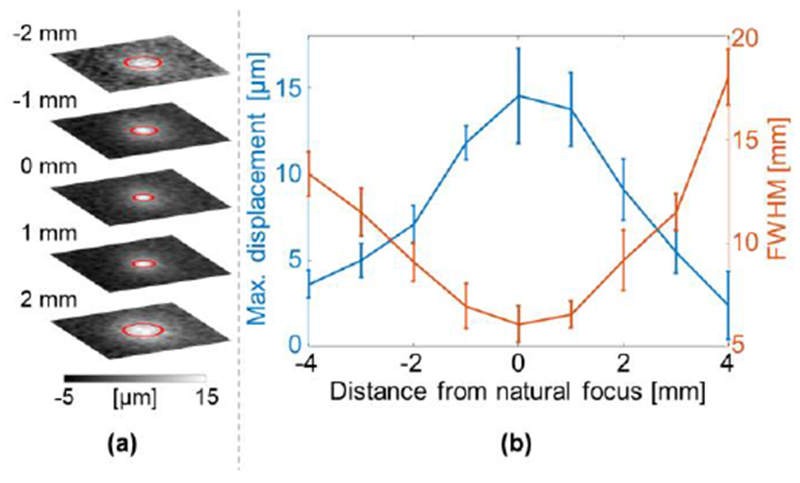
Spiral MR-ARFI slices in an ex-vivo chicken breast. (a) ARFI slices at ±2 mm from the natural focus. The FWHM are marked by red circles. (b) The maximum displacement and FWHM of the ARFI spot versus the distance from the natural focus.
3.3. Effect of Repetition time
The T1 of the ex-vivo chicken breast was calculated to be 1.34 ± 0.02 sec. To test the TR effect on the magnitude signal and phase noise, displacement maps were generated successively using different TR values (Fig. 5). As the TR increased, the SD decreased and reached 0.9 μm at TR=5 sec. Further increases in TR did not further reduce the SD significantly.
Fig. 5.
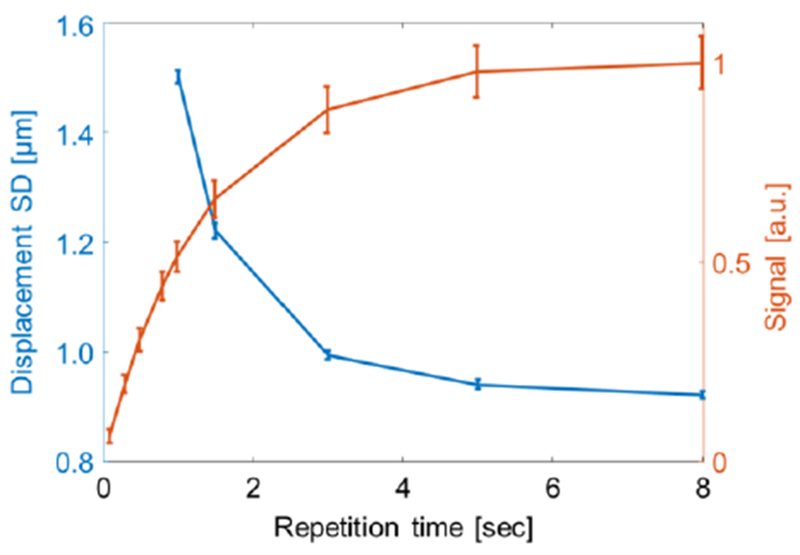
Displacement SD in an ex-vivo chicken breast. Red line: signal recovery versus TR. Blue line: displacement SD versus TR.
3.4. Effect of thermal ablation on the ARFI displacement
MR-ARFI can be used for detecting tissue changes resulting from thermal ablation. To present this, the maximum displacement of the ARFI spot was measured in the ex vivo sample as a function of the applied acoustic pressure at ambient temperature and following ablation at temperatures of 55°C and 70°C (Fig. 6a). Using MR thermometry, the target temperatures of 55°C (Fig. 6f) and 70°C (Fig. 6g) were evaluated. A linear dependence of applied pressure to measured displacement was observed in all cases, consistent with the literature (Wu et al 2000, McDannold and Maier 2008, Holbrook et al 2011). Moreover, prior to ablation, the ARFI spot was distinct (Fig. 6b), but became diffuse with a lower maximum displacement following thermal ablation at 55°C (Fig. 6c) and even more so following ablation with a temperature of 70°C (Fig. 6d). As the temperature increased, the tissue became stiffer and the displacement was reduced (Wu et al 2001, Le 2006, Liu et al 2015, Vappou et al 2018). Beyond 70°C, the maximum displacement did not show dependence on the applied pressure for the measured pressure range. After the experiment, the chicken was dissected, and the ablated area was clearly visualized. An image of the ablated spot was captured using a standard digital camera (Fig. 6e). At the maximal pressure of 8.6 MPa, the difference in maximum displacement pre and post ablation increased to ~10 μm.
Fig. 6.
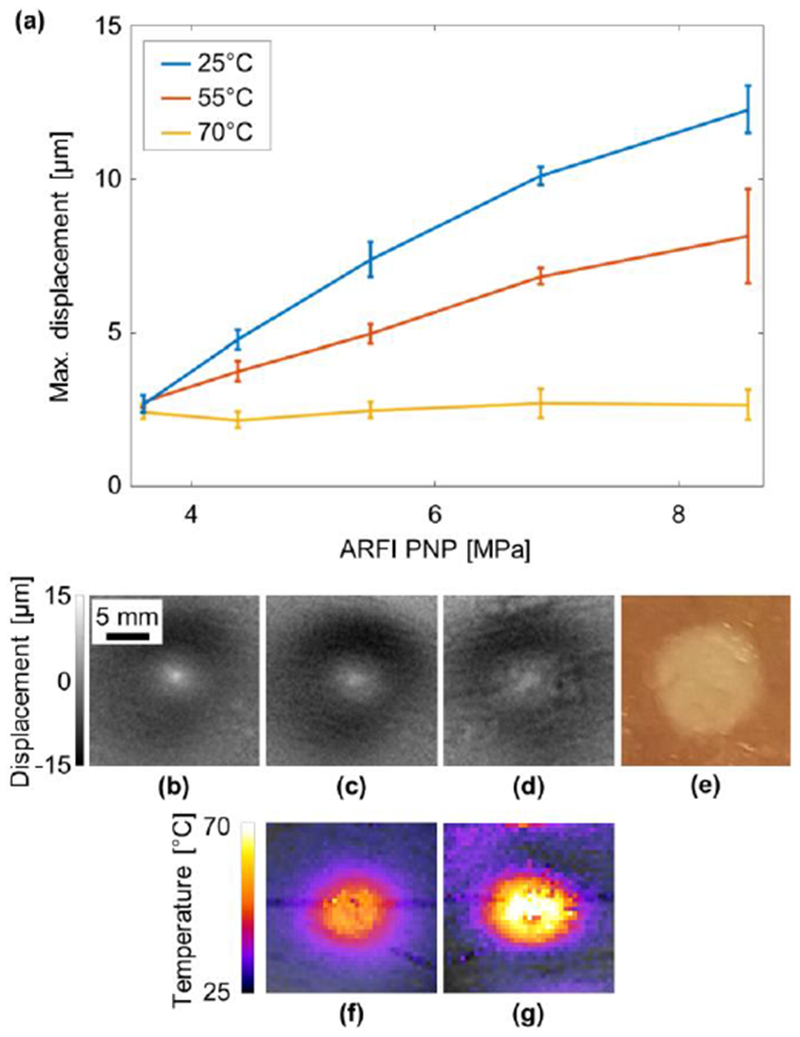
Effect of thermal ablation on the ARFI spot in an ex vivo sample. (a) Maximum displacement of the ARFI spot as a function of the acoustic power at 25°C (blue), and after thermal ablation at 55°C (red) and 70°C (yellow). ARFI displacement at 5.5 MPa PNP (b) at 25°C, (c) after ablation at 55°C, (d) at after ablation at 70°C. (e) Post experiment optical image of the ablated region. Thermometry image during the ablation process demonstrating the tissue reaching (f) 55°C and (g) 70°C.
3.5. Measurement of passive cavitation during ARFI acquisition
In order to test whether cavitation is generated during the ARFI acquisition, the US echoes were recorded both in degassed water and in chicken breast. No significant difference at the echo spectrum was observed between the degassed water and the chicken breast. An example of the spectrum at the highest PNP that was used in this study (8.6 MPa) is presented in Fig. 7. Ultraharmonic components, which are associated with inertial cavitation (Frohly et al 2000) were not observed in this pressure range.
Fig. 7.
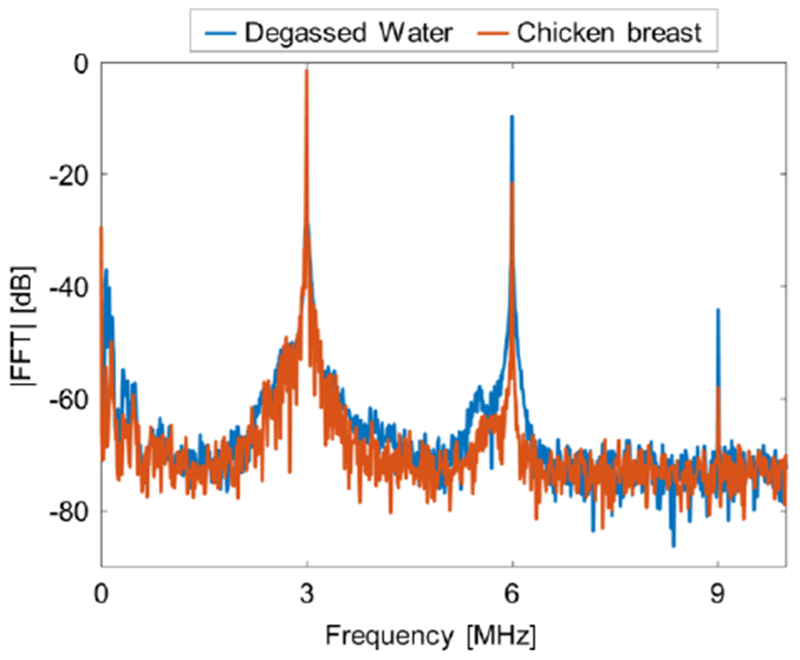
Passive cavitation detection. Magnitude of the received echo spectrum following sonication using 3 msec pulse duration with a PNP of 8.6 MPa in degassed water (blue), and in chicken breast (red).
DISCUSSION AND CONCLUSION
Thermal ablation has become a promising alternative or complement to existing techniques for treating patients with a variety of medical disorders. To date, more than 215,000 patients have been treated with FUS under ultrasound or MR guidance (Focused Ultrasound Foundation 2018). At this time, 73% of these treatments have been for prostate diseases and uterine fibroids (Napoli et al 2013, Stewart et al 2006); however, applications are rapidly increasing. Another FDA-approved clinical application involves pain relief for bone metastases (Hurwitz et al 2014), where clinical studies reported that 64% of the treated patients no longer required pain medication for the treated lesion. Additionally, 80% of the treated patients with pancreatic cancer report substantial pain relief (Li et al 2012). In the field of brain therapy, more than 1,000 patients with various neurological disorders have been treated with non-invasive MRgFUS via thermal ablation of precise targets deep in the brain. Previous and ongoing clinical studies have used precise ablation of dysfunctional brain regions to treat essential tremor, Parkinson’s disease, dystonia, obsessive-compulsive disorder, depression, and brain tumors (Tyshlek et al 2014, Zaaroor et al 2017). A current need is the development of methods for the treatment of moving organs such as the liver and kidneys (Hurwitz et al 2014). Within the many applications of MRgFUS, improved monitoring tools such as MR-ARFI can be transformative.
In this study, a rapid MR-ARFI imaging method using a single-shot spiral readout was developed and tested. Additional MEG (80mT/m, 6 msec) were added into a modified spin-echo spiral sequence in order to convert local displacement to a shift in the phase image. While using a spiral readout, the main challenge is to achieve a homogeneous B0, as better uniformity reduces off-resonance effects, and, thus blurring artifacts. Therefore, prior to the spiral scans, a local shimming was performed inside a volume of 50 × 50 × 50 mm3. If several ARFI images are to be acquired successively, it is desirable to shorten the TR in order to reduce the total scan time. However, shorter TR will also reduce the SNR. Displacement maps generated as a function of TR demonstrated that as the TR increased, the SD decreased and reached 0.9 μm at TR = 5 sec, where the T1 of the chicken breast sample was 1.32 sec. Further increases in TR did not further reduce the SD significantly. Thus, when planning to image successively using single-shot spiral it is important to make sure that TR is longer than the T1 of the sample.
A 3 MHz center frequency was adequate for both the thermal ablation, which was achieved by mechanically sweeping the focus, and for the rapid ARFI measurements. Two FUS pulses (3.6-8.6 MPa PNP, 3 msec) were triggered by the MR and synchronized with the additional MEG. The ultrasound pressure range was selected to fully utilize the dynamic range of the ARFI, from minimum detection to saturation, where significant phase wrapping artifacts appear. The phase image was later translated to a displacement map using a reference phase image that was captured without the FUS pulses. The single-shot spiral based MR-ARFI acquisition time was one second per image. As a typical thermal ablation treatment requires tens of minutes, the time penalty added with the proposed method is negligible. In addition, due to the very short readout, blurring artifacts due to patient motion and respiration should be eliminated.
The MR-ARFI spot was clearly visualized in the displacement images both in phantoms and in ex-vivo chicken breast, and the measurements were consistent, exhibiting minimal variation between successive experiments. While MR-ARFI measurements have been previously demonstrated with an EPI readout, the resulting images suffer from high geometrical distortion (Kaye et al 2011). In contrast, the single-shot spiral readout presented here does not generate significant geometric distortion (<5%), which makes it applicable for FUS guidance where a slight degradation in effective image resolution can be traded for robust spatial accuracy.
The proposed method was also tested for measuring tissue displacement pre and post FUS thermal ablation. The change in the ablated area is clearly seen in the MR-ARFI images, similar to previous studies in the field (Wu et al 2001, Le 2006, Liu et al 2015, Vappou et al 2018), but with a significantly faster acquisition time. The maximum displacement of the ARFI spot in the ablated area using 8.6 MPa PNP was 78% lower than the pre-ablated displacement. The significant time reduction suggests that spiral readout-based MR-ARFI can be used for monitoring the efficacy of thermal ablation in real time. While using an ultrasound PNP of 8.6 MPa, a robust ~10 μm difference in the maximum displacement pre and post ablation was observed. Prior to ablation, a linear dependence of applied pressure to measured displacement was measured. After ablation (at 70°C) the maximum displacement did not vary with the applied pressure. With a few seconds required for each image, it is possible to acquire displacement maps for several pressures during the thermal ablation procedure, and this change can be used as confirmation that the tissue was successfully ablated. MR-ARFI provides a displacement measurement at a specific location. If a larger area needs to be tested, the FUS can be steered (mechanically or electronically) and the ARFI imaging process will then be repeated successively. This process is time consuming, as it increases quadratically with the desired 2D-ARFI image size. For example, using standard 2D spin-warp for generating a 64×64 ARFI image would require tens of hours. However, using the proposed spiral based MR-ARFI, the same scan can be performed in a few minutes. Multiple shot spiral readouts can also be used for MR-ARFI. Multiple shots will require longer acquisition durations, but will improve the SNR and the ARFI detectability, as well as reduce geometrical distortion. These tradeoffs can be considered for in-vivo applications, where the MR parameters will need to be optimized.
The thermal effects resulting from a single ARFI insonation were previously studied and found to be negligible even when using longer FUS pulses (e.g. 20.6 msec). Using thousands of sonications, the temperature increase was below 4 °C (Kaye et al 2011). Therefore, with a shorter transmitted FUS pulse, the thermal effects are expected to be minimal. Additionally, no cavitation effects were observed during this study.
In the setup described here, a 7 T MRI scanner with second order shims was used. Clinical MRI scanners typically use lower magnetic fields (1.5 T, 3 T) and have higher order shims available thus, higher field uniformity is expected. However, clinical systems typically have much weaker gradients and slower slew rates than small animal systems, which necessitate much longer readouts that may counteract the improvement in uniformity. Thus, the ability to visualize an MR-ARFI using the proposed method in a clinical system will be tested in a future study.
In conclusion, to our knowledge, this study demonstrated for the first time that single-shot spiral based MR-ARFI is feasible.
ACKNOWLEDGMENTS
This work was supported by the National Institutes of Health (NIHR01CA112356, NIHR01CA199658, NIHR01CA211602, NIHR01CA210553, NIHR01CA134659, NIHR01CA227687, and NIHR01EB026094).
REFERENCES
- Ahn CB, Kim JH and Cho ZH 1986. High-Speed Spiral-Scan Echo Planar NMR Imaging-I IEEE Trans. Med. Imaging 5 2–7 [DOI] [PubMed] [Google Scholar]
- Auboiroux V, Viallon M, Roland J, Hyacinthe JN, Petrusca L, Morel DR, Goget T, Terraz S, Gross P, Becker CD and Salomir R 2012. ARFI-prepared MRgHIFU in liver: Simultaneous mapping of ARFI-displacement and temperature elevation, using a fast GRE-EPI sequence Magn. Reson. Med 68 932–46 [DOI] [PubMed] [Google Scholar]
- Börnert P, Schomberg H, Aldefeld B and Groen J 1999. Improvements in spiral MR imaging Magn. Reson. Mater. Physics, Biol. Med 9 29–41 [DOI] [PubMed] [Google Scholar]
- Chapman A and Ter Haar G 2007. Thermal ablation of uterine fibroids using MR-guided focused ultrasound-a truly non-invasive treatment modality Eur. Radiol 17 2505–11 [DOI] [PubMed] [Google Scholar]
- Chen J, Watkins R and Pauly KB 2010. Optimization of encoding gradients for MR-ARFI Magn. Reson. Med 63 1050–8 [DOI] [PMC free article] [PubMed] [Google Scholar]
- Cline HE, Schenck JF, Watkins RD, Hynynen K and Jolesz FA 1993. Magnetic resonance-guided thermal surgery Magn. Reson. Med 30 98–106 Online: http://doi.wiley.com/10.1002/mrm.1910300115 [DOI] [PubMed] [Google Scholar]
- Engel M, Kasper L, Barmet C, Schmid T, Vionnet L, Wilm B and Pruessmann KP 2018. Single-shot spiral imaging at 7T Magn. Reson. Med 1–11 [DOI] [PubMed] [Google Scholar]
- Fielden S, Zhao L, Miller W, Feng X, Wintermark M, Pauly K and Meyer C 2015. Spiral-based 3D MR thermometry J. Ther. Ultrasound 3 P18 Online: http://jtultrasound.biomedcentral.com/articles/10.1186/2050-5736-3-S1-P18 [Google Scholar]
- Fite BZ, Liu Y, Kruse DE, Caskey CF, Walton JH, Lai C-Y, Mahakian LM, Larrat B, Dumont E and Ferrara KW 2012. Magnetic Resonance Thermometry at 7T for Real-Time Monitoring and Correction of Ultrasound Induced Mild Hyperthermia ed J Najbauer PLoS One 7 e35509 Online: http://dx.plos.org/10.1371/journal.pone.0035509 [DOI] [PMC free article] [PubMed] [Google Scholar]
- Focused Ultrasound Foundation 2018. Focused Ultrasound: State of the Field 2018 (Charlottesville, Virginia: ) [Google Scholar]
- Frahm J, Haase A and Matthaei D 1986. Rapid NMR imaging of dynamic processes using the FLASH technique Magn. Reson. Med 3 321–7 Online: http://doi.wiley.com/10.1002/mrm.1910030217 [DOI] [PubMed] [Google Scholar]
- Frohly J, Labouret S, Bruneel C, Looten-Baquet I and Torguet R 2000. Ultrasonic cavitation monitoring by acoustic noise power measurement J. Acoust. Soc. Am 108 2010–20 [DOI] [PubMed] [Google Scholar]
- Glover GH 2012. Spiral imaging in fMRI Neuroimage 62 706–12 Online: 10.1016/j.neuroimage.2011.10.039 [DOI] [PMC free article] [PubMed] [Google Scholar]
- Glover GH and Lai S 1998. Self-navigated spiral fMRI: Interleaved versus single-shot Magn. Reson. Med 39 361–8 Online: http://doi.wiley.com/10.1002/mrm.1910390305 [DOI] [PubMed] [Google Scholar]
- Grissom WA, Kaye E, Pauly KB, Zur Y, Yeo D, Medan Y and Davis C 2012. Rapid HIFU autofocusing using the entire MR-ARFI image AIP Conf. Proc. 1503 162–7 [Google Scholar]
- Gudbjartsson H and Patz S 1995. The rician distribution of noisy mri data Magn. Reson. Med 34 910–4 Online: http://doi.wiley.com/10.1002/mrm.1910340618 [DOI] [PMC free article] [PubMed] [Google Scholar]
- Hertzberg Y, Volovick A, Zur Y, Medan Y, Vitek S and Navon G 2010. Ultrasound focusing using magnetic resonance acoustic radiation force imaging: Application to ultrasound transcranial therapy Med. Phys 37 2934–42 [DOI] [PubMed] [Google Scholar]
- Holbrook AB, Ghanouni P, Santos JM, Medan Y and Butts Pauly K 2011. In vivo MR acoustic radiation force imaging in the porcine liver Med. Phys 38 5081–9 Online: http://doi.wiley.com/10.1118/1.3622610 [DOI] [PMC free article] [PubMed] [Google Scholar]
- Huang Y, Curiel L, Kukic A, Plewes D, Choprae R and Hynynen K 2009. MR acoustic radiation force imaging: In vivo comparison to ultrasound motion tracking Med Phys 36 2016–2020 [DOI] [PMC free article] [PubMed] [Google Scholar]
- Hurwitz MD, Ghanouni P, Kanaev SV., Iozeffi D, Gianfelice D, Fennessy FM, Kuten A, Meyer JE, Leblang SD, Roberts A, Choi J, Larner JM, Napoli A, Turkevich VG, Inbar Y, Tempany CMC and Pfeffer RM 2014. Magnetic resonance-guided focused ultrasound for patients with painful bone metastases: Phase III trial results J. Natl. Cancer Inst 106 1–9 [DOI] [PMC free article] [PubMed] [Google Scholar]
- Hynynen K and McDannold N 2004. MRI guided and monitored focused ultrasound thermal ablation methods: a review of progress Int. J. Hyperth 20 725–37 Online: http://www.tandfonline.com/doi/full/10.1080/02656730410001716597 [DOI] [PubMed] [Google Scholar]
- Jolesz FA 2009. MRI-Guided Focused Ultrasound Surgery Annu. Rev. Med 60 417–30 Online: http://www.annualreviews.org/doi/10.1146/annurev.med.60.041707.170303 [DOI] [PMC free article] [PubMed] [Google Scholar]
- Jolesz FA and McDannold N 2008. Current status and future potential of MRI-guided focused ultrasound surgery J. Magn. Reson. Imaging 27 391–9 [DOI] [PubMed] [Google Scholar]
- Kaye EA, Chen J and Pauly KB 2011. Rapid MR-ARFI method for focal spot localization during focused ultrasound therapy Magn. Reson. Med 65 738–43 [DOI] [PMC free article] [PubMed] [Google Scholar]
- Larrat B, Pernot M, Aubry JF, Dervishi E, Sinkus R, Seilhean D, Marie Y, Boch AL, Fink M and Tanter M 2010. MR-guided transcranial brain HIFU in small animal models Phys. Med. Biol 55 365–88 [DOI] [PMC free article] [PubMed] [Google Scholar]
- Le Y 2006. Study of Shear Wave Displacement Change Measured by 1D MRE During Focused Ultrasound Treatment: Preliminary Study AIP Conference Proceedings vol 829 (AIP; ) pp 186–90 Online: http://aip.scitation.org/doi/abs/10.1063/1.2205463 [Google Scholar]
- Li PZ, Zhu SH, He W, Zhu LY, Liu SP, Liu Y, Wang GH and Ye F 2012. High-intensity focused ultrasound treatment for patients with unresectable pancreatic cancer Hepatobiliary Pancreat. Dis. Int 11 655–60 Online: 10.1016/S1499-3872(12)60241-0 [DOI] [PubMed] [Google Scholar]
- Liu C, Bammer R, Kim DH and Moseley ME 2004. Self-navigated interleaved spiral (SNAILS): Application to high-resolution diffusion tensor imaging Magn. Reson. Med 52 1388–96 [DOI] [PubMed] [Google Scholar]
- Liu Y, Fite BZ, Mahakian LM, Johnson SM, Larrat B, Dumont E and Ferrara KW 2015. Concurrent Visualization of Acoustic Radiation Force Displacement and Shear Wave Propagation with 7T MRI. PLoS One 10 e0139667 Online: http://journals.plos.org/plosone/article?id=10.1371/journal.pone.0139667 [DOI] [PMC free article] [PubMed] [Google Scholar]
- Liu Y, Liu J, Fite BZ, Foiret J, Ilovitsh A, Leach JK, Dumont E, Caskey CF and Ferrara KW 2017. Supersonic transient magnetic resonance elastography for quantitative assessment of tissue elasticity Phys. Med. Biol 62 4083–106 Online: 10.1088/1361-6560/aa6674 [DOI] [PMC free article] [PubMed] [Google Scholar]
- McDannold N and Maier SE 2008. Magnetic resonance acoustic radiation force imaging Med. Phys 35 3748–58 [DOI] [PMC free article] [PubMed] [Google Scholar]
- Meyer CH, Hu BS, Nishimura DG and Macovski A 1992. Fast Spiral Coronary Artery Imaging Magn. Reson. Med 28 202–13 Online: http://doi.wiley.com/10.1002/mrm.1910280204 [DOI] [PubMed] [Google Scholar]
- Meyer CH, Zhao L, Lustig M, Jilwan-Nicolas M, Wintermark M, Mugler JP and Epstein FH 2011. Dual-density and parallel spiral ASL for motion artifact reduction Proc. ISMRM 19 3986 [Google Scholar]
- Mougenot C, Pichardo S, Engler S, Waspe A, Colas EC and Drake JM 2016. A rapid magnetic resonance acoustic radiation force imaging sequence for ultrasonic refocusing Phys. Med. Biol 61 5724–40 [DOI] [PubMed] [Google Scholar]
- Napoli A, Anzidei M, De Nunzio C, Cartocci G, Panebianco V, De Dominicis C, Catalano C, Petrucci F and Leonardo C 2013. Real-time magnetic resonance-guided high-intensity focused ultrasound focal therapy for localised prostate cancer: Preliminary experience Eur. Urol 63 395–8 [DOI] [PubMed] [Google Scholar]
- Nishimura DG, Irarrazabal P and Meyer CH 1995. A Velocity k-Space Analysis of Flow Effects in Echo-Planar and Spiral Imaging Magn. Reson. Med 33 549–56 Online: http://doi.wiley.com/10.1002/mrm.1910330414 [DOI] [PubMed] [Google Scholar]
- Noll DC, Cohen JD, Meyer CH and Schneider W 1995. Spiral K-space MR imaging of cortical activation J. Magn. Reson. Imaging 5 49–56 Online: http://doi.wiley.com/10.1002/jmri.1880050112 [DOI] [PubMed] [Google Scholar]
- Oberhammer T, Weiger M and Hennel F 2010. Spiral MRI Trajectory Design with Frequency Constraint In Proceedings of the Joint Annual Meeting of ISMRM-ESMRMB vol. 18 (Stockholm, Sweden) p 4969 [Google Scholar]
- Pauly KB. Magnetic resonance acoustic radiation force (impulse) imaging (MR-ARFI) J. Ther. Ultrasound. 2015;3:O34. Online: http://www.jtultrasound.com/content/3/S1/O34. [Google Scholar]
- Quesson B, de Zwart JA and Moonen CTW 2000. Magnetic resonance temperature imaging for guidance of thermotherapy J. Magn. Reson. Imaging 12 525–33 [DOI] [PubMed] [Google Scholar]
- Rieke V, Instrella R, Rosenberg J, Grissom W, Werner B, Martin E and Pauly KB 2013. Comparison of temperature processing methods for monitoring focused ultrasound ablation in the brain J. Magn. Reson. Imaging 38 1462–71 [DOI] [PMC free article] [PubMed] [Google Scholar]
- Rieke V and Pauly KB 2008. MR thermometry J. Magn. Reson. Imaging 27 376–90 [DOI] [PMC free article] [PubMed] [Google Scholar]
- Smith WJ. Modern Optical Engineering: The Design of Optical Systems. 2000.
- Stehling M, Turner R and Mansfield P 1991. Echo-planar imaging: magnetic resonance imaging in a fraction of a second Science 254 43–50 [DOI] [PubMed] [Google Scholar]
- Stewart EA, Rabinovici J, Tempany CMC, Inbar Y, Regan L, Gastout B, Hesley G, Kim HS, Hengst S and Gedroye WM 2006. Clinical outcomes of focused ultrasound surgery for the treatment of uterine fibroids Fertil. Steril 85 22–9 [DOI] [PubMed] [Google Scholar]
- Tyshlek D, Aubry JF, ter Haar G, Hananel A, Foley J, Eames M, Kassell N and Simonin HH 2014. Focused ultrasound development and clinical adoption: 2013 update on the growth of the field J. Ther. Ultrasound 2 1–7 [DOI] [PMC free article] [PubMed] [Google Scholar]
- Vappou J, Bour P, Marquet F, Ozenne V and Quesson B 2018. MR-ARFI-based method for the quantitative measurement of tissue elasticity: application for monitoring HIFU therapy Phys. Med. Biol 63 095018 Online: http://stacks.iop.org/0031-9155/63/i=9/a=095018?key=crossref.14bda2f50f8fa68bcd78109fcdac83d2 [DOI] [PubMed] [Google Scholar]
- Wilm BJ, Barmet C, Gross S, Kasper L, Vannesjo SJ, Haeberlin M, Dietrich BE, Brunner DO, Schmid T and Pruessmann KP 2017a. Single-shot spiral imaging enabled by an expanded encoding model: Demonstration in diffusion MRI Magn. Reson. Med 77 83–91 [DOI] [PubMed] [Google Scholar]
- Wilm BJ, Barmet C, Gross S, Kasper L, Vannesjo SJ, Haeberlin M, Dietrich BE, Brunner DO, Schmid T and Pruessmann KP 2017b. Single-shot spiral imaging enabled by an expanded encoding model: Demonstration in diffusion MRI Magn. Reson. Med 77 83–91 [DOI] [PubMed] [Google Scholar]
- Wu T, Felmlee JP, Greenleaf JF, Riederer SJ and Ehman RL 2001. Assessment of thermal tissue ablation with MR elastography Magn. Reson. Med 45 80–7 Online: http://eutils.ncbi.nlm.nih.gov/entrez/eutils/elink.fcgi?dbfrom=pubmed&id=11146489&retmode=ref&cmd=prlinks%5Cnpapers2://publication/uuid/B505BA78-B960-4BA4-B56B-9B06BB5FCA32 [DOI] [PubMed] [Google Scholar]
- Wu T, Felmlee JP, Greenleaf JF, Riederer SJ and Ehman RL 2000. MR imaging of shear waves generated by focused ultrasound. Magn. Reson. Med 43 111–5 [DOI] [PubMed] [Google Scholar]
- Zaaroor M, Sinai A, Goldsher D, Eran A, Nassar M and Schlesinger I 2017. Magnetic resonance–guided focused ultrasound thalamotomy for tremor: a report of 30 Parkinson’s disease and essential tremor cases J. Neurosurg 128 1–9 Online: http://thejns.org/doi/10.3171/2016.10.JNS16758 [DOI] [PubMed] [Google Scholar]