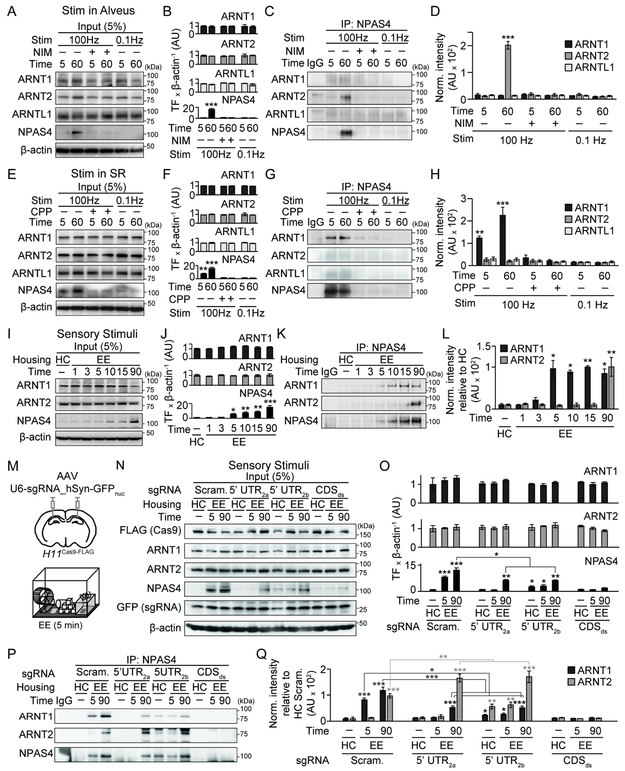
Figure 5. NPAS4 forms excitation pathway-specific heterodimers.
A–D, Stimulation in the alveus.
A, WB analysis of ARNT1, ARNT2, ARNTL1, NPAS4, and β-actin from CA1 lysates. Stimulation, pharmacology, and time post-stimulation are indicated.
B, Quantification of TF expression normalized to β-actin.
C, Co-IP of NPAS4 with ARNT1, ARNT2, or ARNTL1 from lysates in (A).
D, Quantification of Co-IP normalized to IgG.
E–H, As in (A–D) but with stimulation in SR.
I–L, As in (A–D) but hippocampal lysates from WT mice in HC or indicated times post-EE for 5 min.
M, Schematic of injection of AAV into H11Cas9-FLAG mice and EE.
N–Q, As in (I–L) but from H11Cas9-FLAG mice infected with the indicated AAV-sgRNA. Housing and time post-EE is indicated.
*p<0.05, **p<0.01 ***p<0.001. N and statistical tests indexed in Table S1. See also Figure S6.

