Abstract
BACKGROUND
Zebrafish visual function depends on quality optics. An F3 screen for developmental mutations in the zebrafish nervous system was conducted in wild-type (wt) AB zebrafish exposed to 3 mM of N-ethyl-N-nitrosourea (ENU).
RESULTS
Mutant offspring, identified in an F3 screen, were characterized by a small pupil, resulting from retinal hypertrophy or hyperplasia and a small lens. Deficits in visual function made feeding difficult after hatching at approximately 5–6 dpf (days post fertilization). Special feeding conditions were necessary for survival of the occhiolino (occ) mutants after 6dpf. Optokinetic (OKR) tests measured defects in visual function in the occ mutant, although electroretinograms (ERG) were normal in the mutant and wt. Consistent with the ERGs, histology found normal retinal structure in the occ mutant and wt zebrafish. However, lens development was abnormal. Multiphoton imaging of the developmental stages of live embryos confirmed the formation of a secondary mass of lens cells in the developing eye of the mutant zebra fish at 3–4 dpf and laminin immunohistochemistry indicated the lens capsule was thin and disorganized in the mutant zebrafish.
CONCLUSION
The occ zebrafish is a novel disease model for visual defects associated with abnormal lens development.
INTRODUCTION
Development of normal optical function is a key consideration in human eye disease and the zebrafish is an established model for identification of the mechanisms that account for loss of visual function. (Schmitt and Dowling, 1994; Easter and Nicola, 1996; Glass and Dahm, 2004; Fadool and Dowling, 2008; Gross and Perkins, 2008; Greiling and Clark, 2012). Studies of optical function in zebrafish have several advantages as zebrafish are visual feeders and the optical function of the lens is extremely important for their survival (Gestri et al., 2012). When visual function is disrupted, the lifespan of zebrafish is limited once the yolk sac is depleted. This occurs normally at hatching (Greiling and Clark, 2012). The optical quality of the zebrafish lens is comparable to the mammalian lens and, similar to mammals, endogenous protection against loss of transparency is highly advanced, making zebrafish an ideal model for study of development and maintenance of normal lens function (Greiling and Clark, 2008; Vihtelic, 2008; Greiling and Clark, 2009). Zebrafish development is rapid, reproduction is robust, and genetic manipulation is relatively simple. Thus, the functional development of the zebrafish lens can be easily observed in vivo relative to mammals, where development occurs within the animal (Fadool et al., 1997; Gross et al., 2005; Greiling and Clark, 2009). Furthermore, protein expression during development is consistent with the protein expression in mammalian lenses (Posner et al., 2008; Greiling et al., 2009). With the exception of the vesicle stage, formation of zebrafish and mammalian lens from the surface ectoderm is similar and necessary for image formation (Greiling et al., 2010). In both, a lens placode forms from the expansion of the surface ectoderm. In the mammal, the surface ectoderm invaginates to form a lens vesicle. Subsequent differentiation and growth of the posterior epithelium fills the mammalian lens vesicle resulting in a solid mass of transparent cells (McAvoy et al., 1999; Lang, 2004; Lovicu et al., 2004; Soules and Link, 2005). In contrast, the developing zebrafish lens separates from the surface ectoderm as a solid mass of cells in a process known as delamination (Dahm et al., 2007; Greiling and Clark, 2009). In mammalian and fish development, a transparent, refractile core of embryonic cells is formed at the earliest stages of lens formation (Schmitt and Dowling, 1994; Easter and Nicola, 1996; Greiling et al., 2010). Growth of a functional optical element in both mammals and zebrafish continues by the coordinated addition of new layers of transparent, secondary lens fibers peripherally in a remarkably synchronous process of proliferation, migration and elongation (Greiling et al., 2010). As in humans, the symmetry of the growing zebrafish lens must be maintained precisely during development to result in a smooth lentoid surface for maximal optical refraction (Sivak, 1985; Bassnett et al., 2011; Donaldson et al., 2016). Concentric layers of lens fiber cells vary in their index of refraction across the radius of the lens to minimize spherical aberration and optimize image quality (Sivak et al., 1983; Bassnett et al., 2011; Donaldson et al., 2016). Live-embryo 3D multi-photon imaging confirmed the benefits of lens development as a model for studies of highly coordinated proliferation, migration and elongation in the formation of a symmetric optical element for effective image formation (Greiling and Clark, 2009).
In this study, the occ mutant zebrafish was identified by a unique visual deficit in a screen for developmental abnormalities within the the nervous system. Initially, the smaller pupil appeared to be a phenotype for microophthalmia or abnormal retinal development. While ERGs in both the wt and the occ mutant were consistent with normal retinal function, OKR studies recorded significant differences in the saccades of the wt and occ mutants. Light microscope histology indicated that the abnormal OKR was the result of poor optical function rather than dysfunctional photoreceptors or ganglion cells in the retina. In living embryos, the developmental stages of the occ lens included abnormal formation of a secondary lens mass during delamination that accounted for the visual deficit. The mutant was named occhiolino after the first compound microscope that contained two lenses (Galileo, circa 1609). A thin discontinuous lens capsule was observed surrounding the abnormal lenses in the occ mutant. Our results on the novel occ phenotype for optical deficiency encourage the use of the occ zebrafish as a model for human visual deficits involving cell differentiation and development. Three-dimensional live embryo imaging of the zebrafish eye is excellent for research on developmental diseases involving visual function.
RESULTS
Small pupil and small lens phenotype characterized the occ mutant
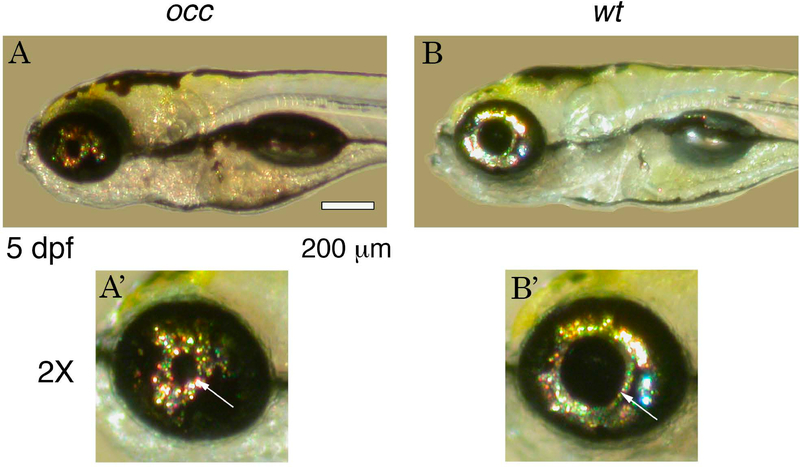
Wild type AB were exposed to 3 mM of N-ethyl-N-nitrosourea (ENU) and the mutant offspring were identified in a screen for eye phenotypes. More than 200 zebrafish embryos were observed and the mutant occ zebrafish resembled the wt except in the size of the pupil and lens, which were smaller in occ than in wt (Fig. 1). The penetrance was observed to be 82%.
Figure 1. Phenotype of occhiolino (occ) and wt zebrafish at 5 dpf (days post fertilization).
The occ zebrafish resembled the wt except for the small diameter of the pupil and lens. Scale bar = 200 μm.
Functional testing of the optokinetic response (OKR) in occhiolino zebrafish
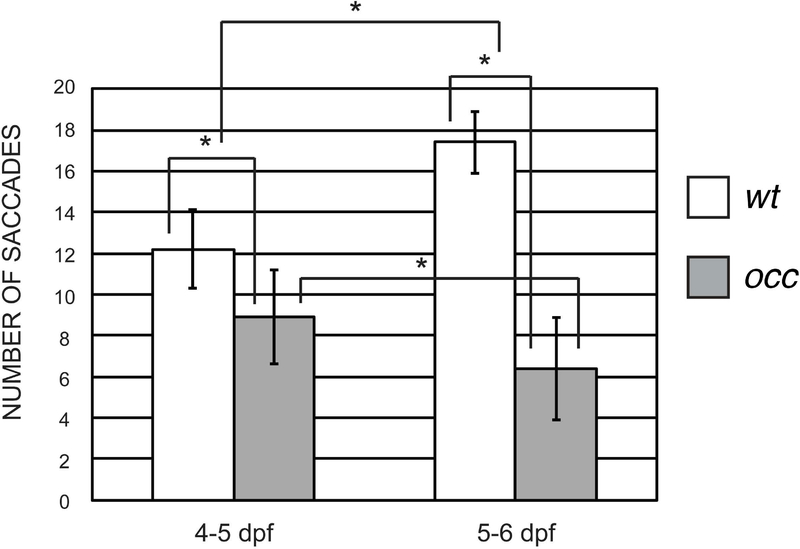
OKR is a direct measure of visual function that can be quantified in the normal zebrafish by 4dpf, when zebrafish visual development is sufficient enough to allow for hunting food. When the OKR drum rotates, the fish eyes follow vertical stripes, and a saccade results each time a stripe leaves the field of view. At that instant, the eyes move quickly back to their original position. The saccades reverse direction immediately when the direction of the drum rotation is reversed. The saccade eye movements in occ and wt were recorded at 4 to 5dpf and 5 to 6dpf (Fig. 2). At 4 to 5dpf, the number of saccades per 20 seconds in wt was 12.2 ± 1.9. In contrast, the number of saccades in the occ was only 8.9 ± 2.3. The number of saccades in occ fish was significantly fewer compared to that of wt. At 5 to 6 dpf, the number of saccades per 20 seconds in wt increased to 17.4 ± 1.5 while the number of saccades in the occ decreased to 6.4 ± 2.5 after only one day. Consistent with the results at 4 to 5dpf, fewer saccades were observed in occ relative to wt. With only one additional day of visual development, the OKR response in the wt zebrafish increased and the number of saccades in the occ mutant decreased significantly. These results were consistent with disruption of early lens development in the occ. In contrast, the development of visual function in wt at 4 to 5dpf, as measured by OKR, continued to improve. While OKR measurements determined that the occ zebra fish were not completely unable to respond to the movement of the vertical stripes, there was a significant visual deficit, which could be accounted for by the poor optics of the abnormal lens development. The abnormal swimming and feeding behavior of the zebrafish correlated with abnormal optical function.
Figure 2. OKR characterized the effect of the occ mutation on saccades.
The number of saccades in the occ mutant was significantly lower compared to those in wt. At 4 to 5dpf, the number of saccade eye movements per 20 seconds in wt was 12.2 ± 1.9 and only 8.9 ± 2.3 in occ. Only one day later, at 5 to 6dpf, the number of saccades in wt increased to 17.4 ± 1.5 but decreased to 6.4 ± 2.5 in occ, indicating poorer optical function in the mutant. Data were expressed as the mean ± SD. The differences between groups were significant at P < 0.05.
Electroretinogram (ERG) in occhiolino
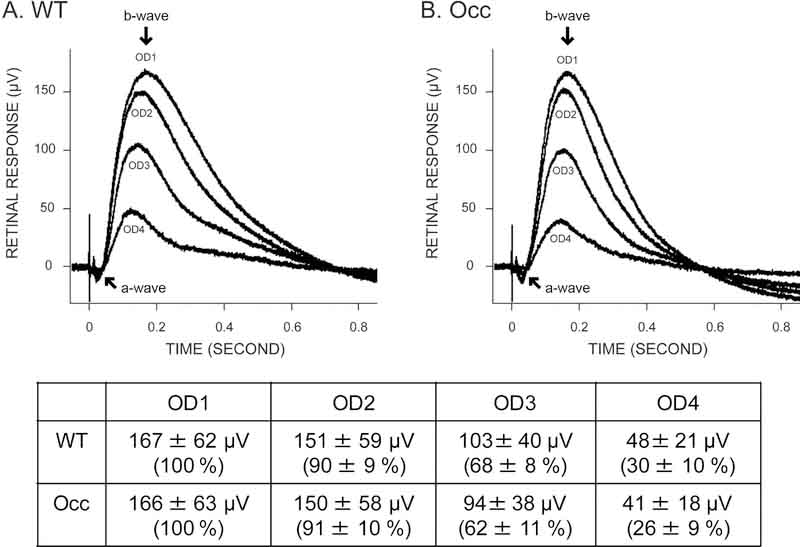
ERG measured the light response of the retina and was recorded at 4 different stimulus intensities in eyes obtained from occ and wt zebra fish at 5 to 6dpf (Fig 3). The recorded values for ERGs in occ and wt zebrafish were averaged and listed in the table in figure 3. The ERG in vertebrates is characterized by two waves: a small negative a-wave produced by the photoreceptors, and a large positive b-wave dependent on the secondary neurons postsynaptic to photoreceptors (Saszik et al., 1999). In both occ and wt eyes the a- and b- waves decreased in amplitude as the flash intensity decreased. To compare the retinal function in occ and wt, the maximum induced voltage, resulting from 4 different stimulus intensities in the form of b-waves, were measured from the base line to the peak maximum, and the maximum voltage of OD1 was normalized to 100% in each eye. In OD1, the brightest light intensity, the maximum voltage in the wt eye was 167 ± 62 μV and was statistically the same as that in occ eye at 166 ± 63 μV. In OD2, the maximum voltage in the wt eye was 151 ± 59 μV, and was statistically equivalent to occ at 150 ± 58 μV. In OD3, the maximum voltage in the wt eye was 103 ± 40 μV and was statistically the same as that in the occ eye at 94 ± 38 μV. In OD4, the maximum voltage in the wt eye was 48 ± 21 μV and was statistically equivalent to occ at 41 ± 18 μV. For each value of OD, there was no significant difference between wt and occ (P>0.05). The similarities in the magnitude and the response of the ERG to different light intensities confirmed that the retinal function in occ was the same as the wt.
Figure 3. Electroretinograms (ERG) determined that retinal function in the occ mutant resembles the wt zebrafish.
ERGs were conducted on wt and occ eyes at 5 to 6dpf using 4 different stimulus intensities. OD is the optical density, where OD1 is the brightest light intensity and OD4 is the lowest light intensity. In both wt(A) and occ(B), a negative a-wave followed by a large b-wave was a measure of the photoreceptors and postsynaptic activity (ganglion cells) respectively. The normalized response for each illumination was plotted in the figures and the recorded values were listed in the table. The similarities in the magnitude and the response of the ERGs to different illumination indicated that visual function in the occ and wt retinas was the same. The visual deficit in the occ mutant was not the result of abnormal retinal function.
Histological sections of the eyes in occhiolino zebrafish found abnormal lens structure (Fig. 4)
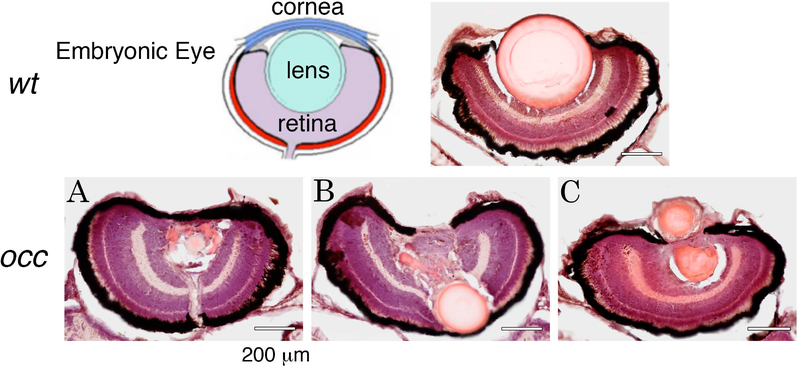
Figure 4. Although two lens masses formed in the occ eye, the retina appeared normal.
The layered structure of the retina in the occ eye was similar in size to that of the wt. In the wt eye, the lens was large and spherically symmetric. In the occ eye the primary lens remained intact and was displaced posteriorly pushing into the developing retina (Ten micrometer frozen sections were stained with H&E at 5 dpf. Scale bar = 40μm.). The drawing of the embryonic eye is from “Morphogenesis of the anterior segment in the zebrafish eye”, figure 2A, by KA Soules and BA Link (2005) BMC Dev Biol. 5:12.
Analysis of histological sections of occ and wt eyes revealed similar layering of the retina but abnormalities in the lens. The occ lenses were asymmetric and smaller than the wt lenses, suggesting lens formation was disrupted (Figs. 4A–C). In some occ eyes, the lens was displaced posteriorly and pushed into the developing retina (Fig. 4B). In other occ eyes, the first lens mass had disappeared when the secondary mass of cells appeared or both the primary and secondary lens mass was observed at the same time (Fig. 4C). In the supplementary videos, the geometry of the two lens masses are recorded in live embryos in three dimensions and are consistent with the fixed and sectioned eyes of occ zebrafish. Abnormal lens formation is expected to produce refractive errors that account for the visual deficits, abnormal OKR and feeding behavior of the occ mutant zebrafish.
Development of lenses in occhiolino zebrafish
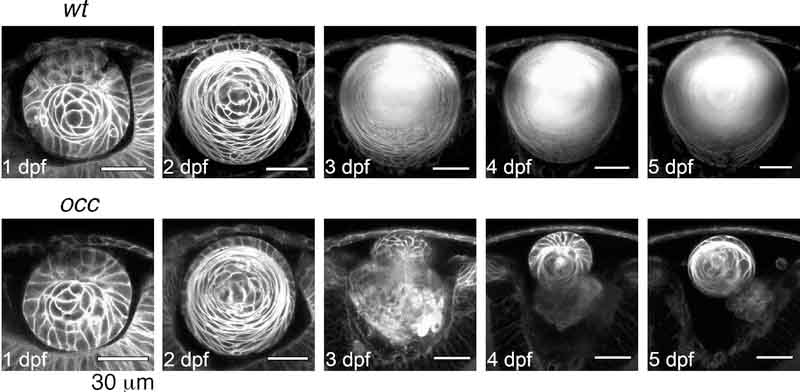
The lens development in live wt and occ zebrafish was followed from 1 to 5dpf using 2-photon LIVE-EMBRYO microscopy (Fig.5 and supplementary videos of wt Q01). Q01 zebrafish were studied as controls. In Q01 zebrafish, cyan fluorescent protein is fused to a membrane-targeting sequence so the membranes of each cell can be visualized. The cells in the occ zebrafish appeared normal and identical to cells in the Q01 fish until approximately 3dpf (compare 5A-C & 5F-H). At 1 dpf, separation of the lens cell mass from the surface ectoderm and ectodermal cells in the future cornea were similar in both the Q01 wt and occ embryos (compare 5A & 5) (Note: The development of the wt was published in detail (Greiling and Clark, 2009) and is only summarized here.) On the external surface of a wt lens, cells differentiated into the lens epithelium. Deep cells in the lens mass differentiated progressively into primary lens fibers. By 2dpf the lens epithelial cells began differentiating into secondary fiber cells, forming a new layer surrounding the original cell mass (compare 5B & 5G). By 3dpf the development of the lens in the occ and wt eyes began to diverge (compare 5C & 5H). In the wt eye, the lens mass formed a central nucleus of primary lens fibers, and at 4 to 5dpf, layers of new lens fibers were added as the lens grew larger to form a mature adult lens (5C-E). Conversely, at approximately 3dpf in the occ eye, the lens epithelial cells formed a secondary cell mass and the first lens started to lose its spherical shape (5H) (please see supplementary videos 1–3). By 4dpf the new lens cell mass appeared to be forming a secondary lens and the upper cells in the secondary lens differentiated into a lens epithelium (5I). The posterior cells in the secondary cell mass differentiated into primary lens fiber cells similar to those in a normal wt lens during the 1–2 day time period of development (5I). Degeneration of the first lens mass continued while the secondary cell mass remained connected to the first lens. By 5dpf the secondary cell mass resembled a small normal lens at about 2dpf (5J).
Figure 5. Lens Development in occ crossed with Q01.
The 2-photon live-embryo imaging of lenses from wt and occ crossed to Q01 was conducted at 1,2,3,4 and 5dpf. The cornea is at the top of each image and the retina is at the bottom. The lens development in occ was the same as the wt until 2 to 3dpf, when the lenticular cell mass separated from the surface ectoderm, and the lens epithelial cells differentiated into secondary lens fibers. After 3dpf, a nucleus began to form in the center of the wt lens, and the lens grew larger gradually and matured similar to an adult lens. In contrast, the lens in the occ eye was abnormal. Epithelial cells formed a second lenticular cell mass on the anterior side of the first lens, and the first lens began degenerating at 3dpf. At 4 to 5dpf, the secondary lens cell mass resembled a normal 2dpf lens. Supplementary videos are included with the publication. Scale bar = 30 μm.
Formation of a secondary lens cell mass in the occhiolino mutant
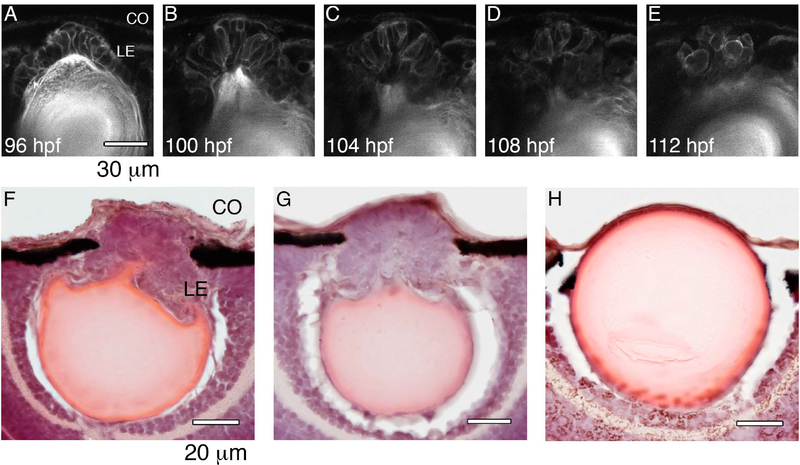
Lens development in a live occ zebrafish embryo was followed in real time from 96 to 112 hpf (hours post-fertilization) using multiphoton imaging (Fig.6). After placode formation, the lens epithelium was multilayered on the anterior side of the lens. Lens epithelial cells were present only on the anterior side of the lens at 96 hpf and had not migrated posteriorly along the developing capsule to form the transitional bow region seen in the wt lens(Fig. 6A). At 100 to 108 hpf the multilayered lens epithelial cells began formation of a secondary cell mass on the anterior surface of the lens (Fig 6B–D, 6F,G). By 112 hpf the secondary cell mass often resembled a lens formed at the anterior side of the primary lens and remained connected (Fig 6E). In some occ eyes the development of the secondary lens appeared to be arrested when the lens epithelial cells began to differentiate.
Figure 6. Formation of the second lens cell mass in occ.
2-photon live-embryo images of an occ eye were compared with 10 micron frozen sections stained with H&E of occ and wt eyes. The cornea is at the top of each image and the retina is at the bottom. The lens epithelial cells were observed in the developing lens in occ eyes from 4 to 6dpf (A-E). In the occ eye the lens epithelial cells were multilayered and formed a cell mass secondary to the original lens (F,G). In the wt eye the lens epithelial cells formed a single layer inside of the lens capsule (H). CO: cornea, LE: lens epithelial cells. Scale bar = 30 μm.
Lens capsule structure was abnormal during development of the occ eyes
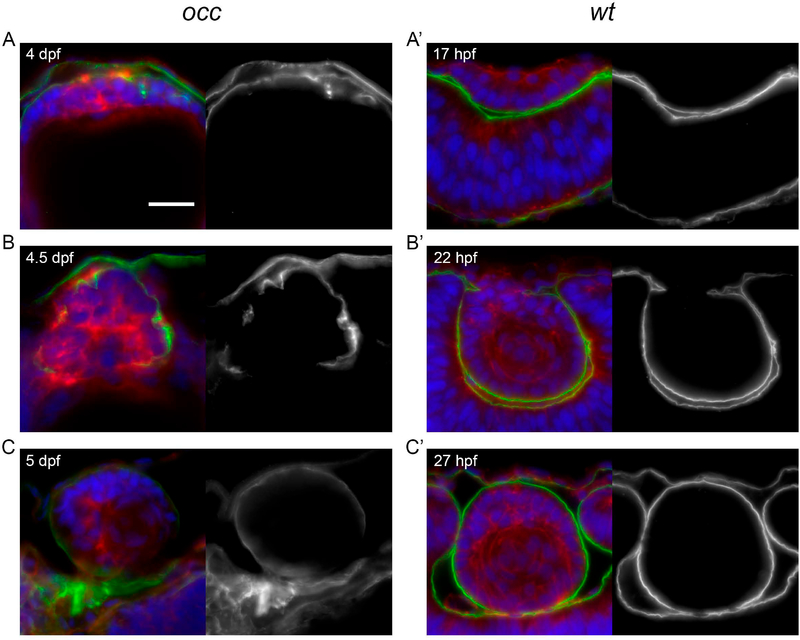
The capsule surrounding the lens is important for normal lens development, and an evaluation of the lens capsule was conducted to compare the capsule in the occ with the wt zebrafish eyes. Eyes from the wt and occ mutant zebrafish were sectioned during lens development and laminin immunocytochemistry was used as a marker for the capsule (Fig. 7). When the epithelium of the wt lens became multilayered on the external side of the lens cell mass, laminin was present on the surface of the multilayered lens epithelial cells. This appeared to be the earliest formation of a lens capsule (Fig 7A’ &B’). After separation from the cornea, laminin was present on the deep corneal surface where Descemet’s membrane is found and surrounded the external surface of the developing wt lens, as if formation of the capsule and Descemet’s membrane contributed to the separation of the developing lens from the future cornea (Fig 7A’–C’). Even at ages 4 to 5 dpf, the laminin in the occ eyes was distributed irregularly around the developing mass of cells except on the posterior side, where the lens epithelium formed a secondary cell mass anterior to the first lens (Fig 7A–C). In the presence of an incomplete capsule, a secondary cell mass formed and remained connected with the first lens mass. When the secondary cell mass separated from the first lens, laminin was present in the outermost part of the secondary lens and formed a thin, rudimentary capsule that contrasted to the prominent capsule in the wt eye (Fig 7A–C, 7A’–C’). As late as 5 dpf the lens capsule in the occ eye was still disorganized and discontinuous (Fig 7C) while the lens capsule in the wt eye was completed at 27 hpf (Fig 7C’).
Figure 7. Disruption of basement membrane (capsule) integrity in the mutant occ lens.
When the epithelial cells of the occ lens became multilayered at 4dpf, the basement membrane appeared as a thin disorganized layer on the external surface of the lens mass. By 4 to 5dpf, a thin capsule was developing to surround the occ lens and appeared to be distributed irregularly around the lens cell mass. Apparently, the discontinuities in the basement membrane destabilized the structure enough to permit epithelial cells to form a secondary cell mass by 5dpf. In contrast, the basement membrane of the wt lens formed a thick, prominent and continuous capsule surrounding the lens mass as early 22hpf (hours post-fertilization), indicating the earliest stages of lens capsule development. Sections were labeled for laminin (green), actin (red) and DAPI (blue), and shown with corresponding monochrome images (to the right) of the green laminin channel only. Approximate ages are listed in each section. Scale bar = 20 μm.
Description of the model for lens development in the occhiolino mutant
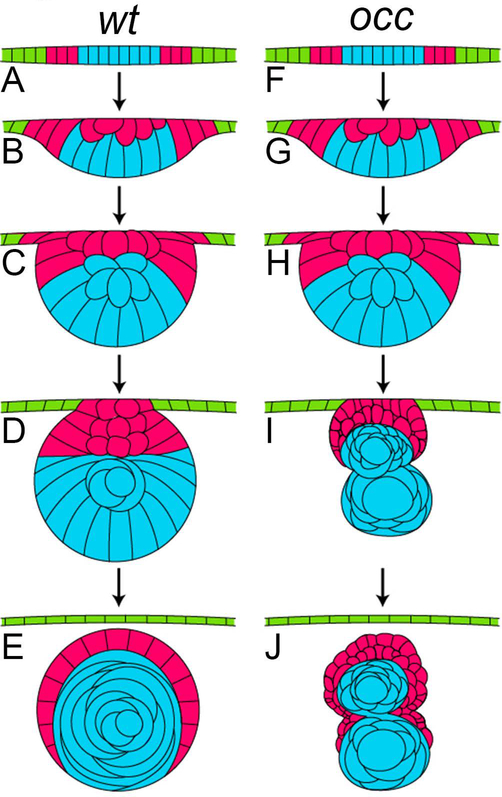
In figure 8, the developmental stages of the lens in the wt and occ eyes were compared diagrammatically. In the wt eye, the lens developed to a fully functional optical element in a few days. Beginning with the lens placode on the surface ectoderm of the embryo, delamination of epithelial cells produced a lens mass that separated from the surface ectoderm (future cornea) within 3dpf. Secondary fibers began to differentiate and surround the embryonic core of the wt lens by proliferation, migration and elongation of lens epithelial cells. In the occ eye the progressive formation of the lens resembled the wt until approximately 3 to 4dpf. Instead of developing a single optical element, the lens epithelium in the occ eye formed a new cell mass. One can expect image formation in the occ eye to be disrupted by the presence of two lens masses. In the absence of normal optics visual perception was abnormal. The effect on visual function and eating behavior corresponded with the development of two lens masses. The basis for the observed hereditary phenotype in the occ zebrafish needs to be evaluated in detail using molecular genetics.
Figure 8. Comparison of the developmental stages for lens in wt and occ zebrafish.
In this diagram the developmental stages of the lens in a wt eye (A-E) were compared with the developmental stages of the lens in the eye of an occ mutant (F-J). In the early developmental stages, the lens cell mass delaminated normally from the surface ectoderm in the wt and occ eyes and the lens epithelial cells began differentiating into secondary lens fibers (A-C, F-H). In the occ eye, the multilayered epithelial cells formed a secondary mass of cells anterior to the surface of the developing lens (I). By 4dpf, the wt lens formed a core of well-defined nuclear cells surrounded by an epithelium and continued to develop normally to become a functioning adult lens (D,E). In the occ eye, a small secondary cellular mass became ordered and multilayered as the other lens degenerated (I,J). With further development, the secondary mass of epithelial cells in the occ mutant differentiated into the lens fiber cells (J). The abnormal development of the occ lens accounted for the abnormal visual function in the occ mutant. While there was variability, the drawings represent the developmental stages observed using live-embryo imaging and histology. (Please see supplementary videos.)
DISCUSSION
The results suggest that the phenotype of the occ mutant is a unique disease model for optical function in the eye of the developing zebrafish. Deficits in visual function were measured by OKR (optokinetic response) during development of the occ zebrafish, and live embryo imaging of the eyes identified the formation of a cell mass secondary to the initial delamination of the lens cells. The neuronal layers of the retina appeared to be normal, consistent with the normal ERG (electroretinogram) measured in eyes from the occ mutant. Laminin immunohistochemistry correlated disorganization of the normal structure of the lens capsule with the abnormal development of the lens. Instead of surrounding the developing lens as a thick layer of extracellular matrix, the lens capsule of the occ mutant was discontinuous and irregular. The disruption of the lens capsule could account for the abnormal differentiation of lens fibers. It is expected that sequence analysis of the occ mutant will characterize the genetic basis for the observed phenotype in the occ mutant zebrafish.
The OKR is a measure of visual function in which the eye of an immobilized zebrafish follows the movement of a rotating grating (Brockerhoff et al., 1995). OKR testing is often used to quantify retinal deficits and poor vision in zebrafish. Given the abnormal feeding behavior, it was unsurprising that the OKR measurements in the developing occ mutant zebrafish were significantly different from the wt.
An ERG is a direct measure of the electrophysiological response of the retina to light (Saszik et al., 1999; Van Epps et al., 2001; Wong et al., 2004; Chrispell et al., 2015), but not a measure of image or optical quality of an eye. An abnormal ERG could be expected in the occ mutants if the mutation occurred in the photoreceptors or ganglion cells, and the abnormal feeding behavior was the result of a retinal defect. Instead, the results of the ERGs for the developing eye in the occ zebrafish were nearly identical to the wt.
The OKR and ERG measurements suggest that the visual behavior of the occ mutant was the result of abnormal optical function of the lens. A secondary mass of cells was present in the eye of the occ mutant at 4–5dpf in contrast to a single lens in wt zebrafish. When live-embryo imaging was used to study eye development in real time, lens development was not normal in the occ zebrafish. While there was some variability, the developmental stages of occ mutant lens were not the same as wt. The stages of lens development in the wt and occ zebrafish eye were compared diagrammatically in figure 8. Thus, the observed feeding difficulties of the occ mutant zebrafish can be attributed to abnormal development of the lens.
In the developing lens, the capsule is a basement membrane for the attachment of the basal surface of epithelial cells during the synchronized proliferation, migration and elongation to form layers of transparent lens fibers organized precisely into the optical element of the zebrafish visual system. As a key component of the basement membrane, laminin is a marker for the lens capsule (Parmigiani and McAvoy, 1991; Menko et al., 1998; Norose et al., 2000; Yan et al., 2002; Lee and Gross, 2007; Danysh and Duncan, 2009; Kwan, 2014; James et al., 2016; Patel et al., 2016). Laminin mutants disrupt basement membrane structure resulting in abnormal lens development in zebrafish as early as 3dpf with some mutations causing complete loss of the lens as early at 7dpf (Parmigiani and McAvoy, 1991; Semina et al., 2006; Zinkevich et al., 2006; Pathania et al., 2014; Patel et al., 2016). The involvement of laminin in the formation of the basement membrane was the basis for using laminin antibodies to label the lens capsule in wt and occ eyes (Pathania et al., 2014; Pathania et al., 2016). A number of studies on recessive laminin mutations in zebrafish established the significance of the lens basement membrane in normal development and found that the impact of a laminin mutation is not limited to the eye but often has a dramatic systemic phenotype. While there were similarities in the histological distribution of the basement membrane in the wt and occ mutant, the lens capsule appeared to be irregular and discontinuous in the occ mutant.
The most prominent constituent of basement membranes is type IV collagen, which has a diverse and multifunctional involvement in normal cell differentiation and in human diseases of the kidney, vasculature, tumors, and sensory systems, including the eye (Norose et al., 2000; Dong et al., 2002; Cvekl and Duncan, 2007; Kwan, 2014; Pathania et al., 2016). Although laminin is well established as a immunohistochemical marker for the basement membrane, mutations in laminin produce more severe phenotypes than those observed in the occ zebrafish. Mutations in collagen IV, which are responsible for the phenotype in well-known human hereditary syndromes including Pierson syndrome, Usher syndrome, Alport syndrome, and diabetes, could account for the relatively mild phenotype in the occ eye and include visual deficits involving lens (Cummings and Hudson, 2014).
The hypothesis emerging from these developmental results on the phenotype of the occ zebrafish is that loss of integrity of the basement membrane in the lens capsule corresponds with the formation of an abnormal lens cell mass, resulting in defective optical function in the occ mutant zebrafish. While the abnormal feeding behavior can be explained by inadequate visual perception, the exact mechanism for altered lens development needs to be determined. Our premise is that the occ phenotype results from a mutation in a collagen IV gene, a key constituent of the basement membrane, which produces an irregular, disorganized lens capsule in the eye of the occ mutant. Furthermore, the zebrafish is an especially attractive model for the study of basement membranes in organogenesis because the stages of embryonic development are accessible and the lens of the zebrafish functions almost the same as in humans. Zebrafish have great potential for modeling human hereditary disease. Abnormal basement membranes occur in Pierson syndrome, Usher syndrome, Alport syndrome and diabetes where lens abnormalities are present. Therefore it can be concluded that the occ zebrafish will be a valuable new model for understanding human diseases of the basement membrane. Additional research is being conducted to clarify the fundamental mechanism(s) underlying the developmental phenotype observed in occ mutant zebrafish.
EXPERIMENTAL PROCEDURES
Zebrafish
occhiolino ENU mutant fish (occ)
Approximately 500 ENU mutagenized *AB F2 families were generated as previously published (Owens et al., 2008) and initially screened as described (Solnica-Krezel et al., 1994; Stawicki et al., 2015). Mutant zebrafish were identified in a screen at 5dpf evaluating atypical pigment or nervous system patterning. The occ mutants (allele number W191) appeared normal by epi-illumination, except for the eyes where the pupils were small and lenses appeared deficient. Heterozygous founders were outcrossed to *AB and the phenotype was reconfirmed in the following generation by incrossing F3 heterozygous. F3 homozygous were reared to confirm viability.
Maturing occ fish required a very high density of brine shrimp for successful feeding. Zebrafish are visual feeders and the high density of brine shrimp was necessary for the occ mutant zebrafish to find their food, which was consistent with a visual deficit. All fish were maintained as described previously and staged according to hours post-fertilization (hpf) at 28.5°C and by morphological criteria (Greiling and Clark, 2009). Adult fish were housed at 28.5°C in accordance with the University of Washington Institutional Animal Care and Use Committee.
Q01 transgenic zebrafish (Q01)
Q01 fish ubiquitously express cyan fluorescent protein fused to a membrane-targeting sequence of zebrafish Gap43 (mCFP), driven by an EF1α promoter and a hexamer of the DF4 pax6 enhancer element (Godinho et al., 2005). Q01 fish were generated in a wild-type background and develop and reproduce normally to the wt phenotype.
occ x Q01 lines in zebrafish
The Q01 transgenic fish were generously provided by the laboratory of Dr. R.O.L. Wong. The occ line of fish was crossed with the Q01 line and the offspring expressed CFP in the membranes so that each cell could be observed during lens development. Development of the occ/Q01 offspring was normal except for the eyes (Fig. 1).
Optokinetic response (OKR)
OKR was measured in 70 wt and 72 occ zebra fish at 4 to 5dpf and in 73 wt and 71 occ zebra fish at 5 to 6dpf. The embryos were observed as described previously (Brockerhoff et al., 1995; Brockerhoff, 2006). In brief, the embryos were immobilized in 6% methylcellulose in a 35mm Petri dish and placed near to the surface, dorsal side up. A small dish was placed in the center of a drum with vertical white and black stripes on the inside. The drum was rotated clockwise and counterclockwise at 5 to 6rpm (revolutions per minute). The eye movements were recorded using a CCD camera and video recorder, and the number of saccade eye movements was counted when the drum was turning in a clockwise direction for 10 seconds and then counterclockwise for 10 seconds. The health of the fish was tested before the OKR experiment, and the unhealthy fish were excluded.
Electroretinogram (ERG)
The procedures for ERG experiments were reported previously (Van Epps et al., 2001; Wong et al., 2004). The embryos were placed in a dark room and the eyes were allowed to adapt for at least one hour before ERGs were recorded. The eyes were dissected and placed cornea side up on a piece of sponge soaked with Ringer’s solution (130 mM NaCl, 2.5 mM KCl, 20mM NaHCO3, 0.7 mM CaCl2, 1.0 mM MgCl2 and 20 mM glucose, pH 7.8, and gassed with 97% O2 and 3% CO2 continuously) in a 35 mm Petri dish. An active electrode was placed in a glass micropipette filled with the Ringer’s solution and the tip of the pipette touched the cornea. The reference electrode was placed under the sponge with the Ringer’s solution in the chamber. A 10 msec flash of 100W halogen light at 30,000 lux was used as a stimulus. The ERG responses were amplified by a bandpass amplifier (Axoprobe 1A, Axon Instruments, Foster City, CA) and displayed on an oscilloscope. ERGs were conducted using eyes from 25 wt and 25 occ zebra fish at 5 to 6dpf using 4 different stimulus intensities, 3 times at each intensity. OD (optical density) was recorded as OD1 for the greatest light intensity and OD4 the least intensity. The results were processed using IGOR pro software (WaveMetrics), and the results were averaged for each intensity. The maximum voltage of 4 different stimulus intensities in b-waves was measured from the base line, and the max voltage of OD1 was normalized as 100% in each eye.
Histology
Zebrafish embryos were euthanized in 0.40 mM tricaine and fixed with 4% paraformaldehyde / 5% sucrose / phosphate-buffered saline (PBS) (pH 7.4) for 3 hours at room temperature (Nuckels and Gross, 2007). The fixed embryos were washed in 5% sucrose / PBS and embedded in 1.5% agarose (low-melting-point agarose; Invitrogen Eugene, OR) / 5% sucrose / PBS to orient the whole fish properly. The agarose-embedded embryos were cryoprotected in 30% sucrose / PBS overnight at 4°C. To filter out the sucrose, they were transferred to a 1:1 mix of Optimal Cutting Temperature compound (OCT; Sakura Finetek USA, Inc, Torrance, CA) and 30% sucrose/PBS overnight, and then to 100% OCT overnight at 4°C. Finally the filtered agarose blocks were embedded in fresh 100% OCT using cryomolds (Tissue-Tek Cryomold Biopsy 10 × 10 × 5mm; Sakura Finetek, Torrance, CA) and frozen in isopentane that had been precooled to a near slush state in liquid nitrogen. The 10 μm sections were cut at −18°C on a cryostat (Leica CM1850; Leica Microsystems Inc, Bannockburn, IL) using a low profile knife (EXTREMUSTM; CL. Sturkey, Inc, Lebanon, PA) and mounted on Superfrost plus slides (VWR International, West Chester, PA) and placed on glass slides.
The slides were dried on a plate warmer at 40°C for approximately 1 hour and washed in PBS. The sections were stained with Mayer’s hematoxyline (SIGMA-ALDRICH, St Louis, MO) for 16 minutes, rinsed three times in PBS and then counterstained with eosin (SIGMA-ALDRICH, St Louis, MO) for 3 minutes and rinsed in PBS. After staining, the slides were de-stained and dehydrated with a series of concentrations from 70% to 100% ethanol and xylene and coverslips were added using Permount mounting medium (Fisher Scientific, Houston, TX). The stained sections were viewed and photographed using a bright field microscope (Nikon ECLIPSE E1000; NIKON Instrument INC, Melville, NY). The recorded tiff files were analyzed using Adobe Photoshop (Adobe Systems, Seattle, WA).
Immunohistochemistry
The slides were dried on a plate warmer at 40°C for 1 hour and washed three times in PBS and treated with 3% bovine serum albumin (BSA) in PBS for 1 hour to reduce nonspecific binding of the primary antibody to the sections. The slides were labeled overnight with anti-laminin antibody produced in rabbit (1:50 in 3% BSA / PBS; Sigma-Aldrich St. Louis, MO) and then washed in PBS. Control sections in which the primary antibodies were omitted were also prepared. Then the slides were treated with Alexa Fluor® 488 goat anti-rabbit IgG (1:200 in 3% BSA / PBS; Invitrogen-Molecular Probes, Eugene, OR) for 2 hours. F-actin was labeled with Alexa Fluor® 568 phalloidin (1:100 in PBS; Invitrogen-Molecular Probes, Eugene, OR) for 30 minutes. After labeling, all of the slides were washed with PBS again, and coverslips were added with VECTASHIELD® Mounting Medium for DAPI (Vector Laboratories, Burlingame, CA) labeling. Antibody labeled sections were viewed using an epi-fluorescence microscope (Nikon ECLIPSE E1000; NIKON Instrument INC, Melville, NY) and photographed using HAMAMATSU ORCA (HAMAMATSU Photonic System Corporation, Bridgewater, NJ). The images were recorded as tiff files and analyzed using Adobe Photoshop.
2-Photon Microscopy and live imaging
For 2-photon imaging of the developing eye in live zebrafish embryos, occ mutant fish were crossed with the Q01 transgenic fish. The Q01 and occ X Q01 embryos were prepared for live imaging at 1 to 5 dpf as described previously (Greiling and Clark, 2009). The embryos were spawned and placed in Danieau’s embryo medium at 28.5°C. The embryos were transferred to 0.2 mM 1-phenyl-2-thiourea (PTU) in Danieau’s embryo medium at 10–18 hpf to prevent pigmentation. Embryos were anesthetized in 0.08 mM Tricaine in Danieau’s embryo medium and manually dechorionated with forceps. Next, the embryos were transferred to 0.5% low melting point agarose / 0.2 mM PTU / 0.08 mM Tricaine in Danieau’s embryo medium using a Petri dish (Center-well Organ Culture Dish for In Vitro Fertilization; BD Biosciences, San Jose, CA) and kept until the agarose had set. After that, 0.2 mM PTU / 0.08 mM Tricaine in Danieau’s embryo medium was poured over the agarose-embedded embryos and maintained at 28.5°C during the imaging of the eyes in live zebrafish embryos.
Live-embryo imaging was conducted using an Olympus FluoView FV1000 multiphoton microscope with a long working distance Olympus 25X (1.05 NA) water immersion lens (Olympus, Tokyo, Japan). Stacks of images along the lens z-axis were taken with Olympus FluoView Ver1.7a software and saved as multi-tiff files. Image stacks were analyzed using Amira 4.1.1 (Visage Imaging, Andover MA). After image collection, the embryos were released from the agarose and kept in Danieau’s embryo medium at 28.5°C.
Supplementary Material
Acknowledgments
The authors thank Teri Greiling MD/PhD, Sue Brockerhoff, PhD, Hidayat Djajadi, George Stearns, Dan Possin, Rachel Wong PhD, Tamara Clark, David White and Kristin Carlsen for technical assistance and helpful reviews of this manuscript. TJW Clark is acknowledged for figure 8. Supported by EY04542 and P30EY01730 from the N.E.I.
GRANT SPONSOR: Supported by EY04542 and P30EY01730 from the National Eye Institute, N.I.H.
REFERENCES
- Bassnett S, Shi Y, Vrensen GF. 2011. Biological glass: structural determinants of eye lens transparency. Philos Trans R Soc Lond B Biol Sci 366:1250–1264. [DOI] [PMC free article] [PubMed] [Google Scholar]
- Brockerhoff SE, Hurley JB, Janssen-Bienhold U, Neuhauss SC, Driever W, Dowling JE. 1995. A behavioral screen for isolating zebrafish mutants with visual system defects. Proc Natl Acad Sci U S A 92:10545–10549. [DOI] [PMC free article] [PubMed] [Google Scholar]
- Chrispell JD, Rebrik TI, Weiss ER. 2015. Electroretinogram analysis of the visual response in zebrafish larvae. J Vis Exp. [DOI] [PMC free article] [PubMed] [Google Scholar]
- Cummings CF, Hudson BG. 2014. Lens capsule as a model to study type IV collagen. Connect Tissue Res 55:8–12. [DOI] [PMC free article] [PubMed] [Google Scholar]
- Dahm R, Schonthaler HB, Soehn AS, van Marle J, Vrensen GF. 2007. Development and adult morphology of the eye lens in the zebrafish. Exp Eye Res 85:74–89. [DOI] [PubMed] [Google Scholar]
- Danysh BP, Duncan MK. 2009. The lens capsule. Exp Eye Res 88:151–164. [DOI] [PMC free article] [PubMed] [Google Scholar]
- Donaldson PJ, Grey AC, Maceo Heilman B, Lim JC, Vaghefi E. 2016. The physiological optics of the lens. Prog Retin Eye Res. [DOI] [PubMed] [Google Scholar]
- Easter SS Jr., Nicola GN. 1996. The development of vision in the zebrafish (Danio rerio). Dev Biol 180:646–663. [DOI] [PubMed] [Google Scholar]
- Fadool JM, Brockerhoff SE, Hyatt GA, Dowling JE. 1997. Mutations affecting eye morphology in the developing zebrafish (Danio rerio). Dev Genet 20:288–295. [DOI] [PubMed] [Google Scholar]
- Fadool JM, Dowling JE. 2008. Zebrafish: a model system for the study of eye genetics. Prog Retin Eye Res 27:89–110. [DOI] [PMC free article] [PubMed] [Google Scholar]
- Gestri G, Link BA, Neuhauss SC. 2012. The visual system of zebrafish and its use to model human ocular diseases. Dev Neurobiol 72:302–327. [DOI] [PMC free article] [PubMed] [Google Scholar]
- Glass AS, Dahm R. 2004. The zebrafish as a model organism for eye development. Ophthalmic Res 36:4–24. [DOI] [PubMed] [Google Scholar]
- Greiling TM, Aose M, Clark JI. 2010. Cell fate and differentiation of the developing ocular lens. Invest Ophthalmol Vis Sci 51:1540–1546. [DOI] [PMC free article] [PubMed] [Google Scholar]
- Greiling TM, Clark JI. 2008. The transparent lens and cornea in the mouse and zebra fish eye. Semin Cell Dev Biol 19:94–99. [DOI] [PMC free article] [PubMed] [Google Scholar]
- Greiling TM, Clark JI. 2009. Early lens development in the zebrafish: a three-dimensional time-lapse analysis. Dev Dyn 238:2254–2265. [DOI] [PubMed] [Google Scholar]
- Greiling TM, Clark JI. 2012. New insights into the mechanism of lens development using zebra fish. Int Rev Cell Mol Biol 296:1–61. [DOI] [PubMed] [Google Scholar]
- Greiling TM, Houck SA, Clark JI. 2009. The zebrafish lens proteome during development and aging. Mol Vis 15:2313–2325. [PMC free article] [PubMed] [Google Scholar]
- Gross JM, Perkins BD. 2008. Zebrafish mutants as models for congenital ocular disorders in humans. Mol Reprod Dev 75:547–555. [DOI] [PubMed] [Google Scholar]
- Gross JM, Perkins BD, Amsterdam A, Egana A, Darland T, Matsui JI, Sciascia S, Hopkins N, Dowling JE. 2005. Identification of zebrafish insertional mutants with defects in visual system development and function. Genetics 170:245–261. [DOI] [PMC free article] [PubMed] [Google Scholar]
- James A, Lee C, Williams AM, Angileri K, Lathrop KL, Gross JM. 2016. The hyaloid vasculature facilitates basement membrane breakdown during choroid fissure closure in the zebrafish eye. Dev Biol. [DOI] [PMC free article] [PubMed] [Google Scholar]
- Kwan KM. 2014. Coming into focus: the role of extracellular matrix in vertebrate optic cup morphogenesis. Dev Dyn 243:1242–1248. [DOI] [PubMed] [Google Scholar]
- Lang RA. 2004. Pathways regulating lens induction in the mouse. Int J Dev Biol 48:783–791. [DOI] [PubMed] [Google Scholar]
- Lee J, Gross JM. 2007. Laminin beta1 and gamma1 containing laminins are essential for basement membrane integrity in the zebrafish eye. Invest Ophthalmol Vis Sci 48:2483–2490. [DOI] [PubMed] [Google Scholar]
- Lovicu FJ, Ang S, Chorazyczewska M, McAvoy JW. 2004. Deregulation of lens epithelial cell proliferation and differentiation during the development of TGFbeta-induced anterior subcapsular cataract. Dev Neurosci 26:446–455. [DOI] [PubMed] [Google Scholar]
- McAvoy JW, Chamberlain CG, de Iongh RU, Hales AM, Lovicu FJ. 1999. Lens development. Eye (Lond) 13 ( Pt 3b):425–437. [DOI] [PubMed] [Google Scholar]
- Menko S, Philp N, Veneziale B, Walker J. 1998. Integrins and development: how might these receptors regulate differentiation of the lens. Ann N Y Acad Sci 842:36–41. [DOI] [PubMed] [Google Scholar]
- Norose K, Lo WK, Clark JI, Sage EH, Howe CC. 2000. Lenses of SPARC-null mice exhibit an abnormal cell surface-basement membrane interface. Exp Eye Res 71:295–307. [DOI] [PubMed] [Google Scholar]
- Parmigiani CM, McAvoy JW. 1991. The roles of laminin and fibronectin in the development of the lens capsule. Curr Eye Res 10:501–511. [DOI] [PubMed] [Google Scholar]
- Patel TR, Nikodemus D, Besong TM, Reuten R, Meier M, Harding SE, Winzor DJ, Koch M, Stetefeld J. 2016. Biophysical analysis of a lethal laminin alpha-1 mutation reveals altered self-interaction. Matrix Biol 49:93–105. [DOI] [PubMed] [Google Scholar]
- Pathania M, Semina EV, Duncan MK. 2014. Lens extrusion from Laminin alpha 1 mutant zebrafish. ScientificWorldJournal 2014:524929. [DOI] [PMC free article] [PubMed] [Google Scholar]
- Pathania M, Wang Y, Simirskii VN, Duncan MK. 2016. beta1-integrin controls cell fate specification in early lens development. Differentiation. [DOI] [PMC free article] [PubMed] [Google Scholar]
- Posner M, Hawke M, Lacava C, Prince CJ, Bellanco NR, Corbin RW. 2008. A proteome map of the zebrafish (Danio rerio) lens reveals similarities between zebrafish and mammalian crystallin expression. Mol Vis 14:806–814. [PMC free article] [PubMed] [Google Scholar]
- Saszik S, Bilotta J, Givin CM. 1999. ERG assessment of zebrafish retinal development. Vis Neurosci 16:881–888. [DOI] [PubMed] [Google Scholar]
- Schmitt EA, Dowling JE. 1994. Early eye morphogenesis in the zebrafish, Brachydanio rerio. J Comp Neurol 344:532–542. [DOI] [PubMed] [Google Scholar]
- Semina EV, Bosenko DV, Zinkevich NC, Soules KA, Hyde DR, Vihtelic TS, Willer GB, Gregg RG, Link BA. 2006. Mutations in laminin alpha 1 result in complex, lens-independent ocular phenotypes in zebrafish. Dev Biol 299:63–77. [DOI] [PubMed] [Google Scholar]
- Sivak JG. 1985. The Glenn A. Fry Award Lecture: optics of the crystalline lens. Am J Optom Physiol Opt 62:299–308. [DOI] [PubMed] [Google Scholar]
- Sivak JG, Gur M, Dovrat A. 1983. Spherical aberration of the lens of the ground squirrel (Spermophilis tridecemlineatus). Ophthalmic Physiol Opt 3:261–265. [PubMed] [Google Scholar]
- Soules KA, Link BA. 2005. Morphogenesis of the anterior segment in the zebrafish eye. BMC Dev Biol 5:12. [DOI] [PMC free article] [PubMed] [Google Scholar]
- Van Epps HA, Yim CM, Hurley JB, Brockerhoff SE. 2001. Investigations of photoreceptor synaptic transmission and light adaptation in the zebrafish visual mutant nrc. Invest Ophthalmol Vis Sci 42:868–874. [PubMed] [Google Scholar]
- Vihtelic TS. 2008. Teleost lens development and degeneration. Int Rev Cell Mol Biol 269:341–373. [DOI] [PubMed] [Google Scholar]
- Wong KY, Gray J, Hayward CJ, Adolph AR, Dowling JE. 2004. Glutamatergic mechanisms in the outer retina of larval zebrafish: analysis of electroretinogram b- and d-waves using a novel preparation. Zebrafish 1:121–131. [DOI] [PubMed] [Google Scholar]
- Yan Q, Clark JI, Wight TN, Sage EH. 2002. Alterations in the lens capsule contribute to cataractogenesis in SPARC-null mice. J Cell Sci 115:2747–2756. [DOI] [PubMed] [Google Scholar]
- Zinkevich NS, Bosenko DV, Link BA, Semina EV. 2006. laminin alpha 1 gene is essential for normal lens development in zebrafish. BMC Dev Biol 6:13. [DOI] [PMC free article] [PubMed] [Google Scholar]
Associated Data
This section collects any data citations, data availability statements, or supplementary materials included in this article.


