Abstract
For an assay to be most effective in point-of-care clinical analysis, it needs to be economical, simple, generalizable, and free from tedious workflows. While electrochemistry-based DNA sensors reduce instrumental costs and eliminate complicated procedures, there remains a need to address probe costs and generalizability, as numerous probes with multiple conjugations are needed to quantify a wide range of biomarkers. In this work, we have opened a route to circumvent complicated multi-conjugation schemes using enzyme-catalyzed probe construction directly on the surface of the electrode. With this we have created a versatile DNA nanostructure probe and validated its effectiveness by quantification of proteins (streptavidin, anti-digoxigenin, anti-tacrolimus) and small molecules (biotin, digoxigenin, tacrolimus) using the same platform. Tacrolimus, a widely prescribed immunosuppressant drug for organ transplant patients, was directly quantified with electrochemistry for the first time, with the assay range matching the therapeutic index range. Finally, the stability and sensitivity of the probe was confirmed in a background of minimally diluted human serum.
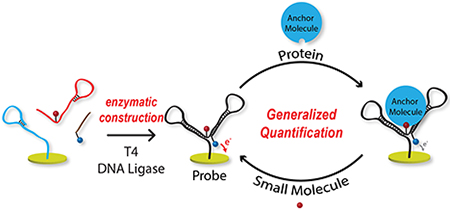
Graphical Abstract
INTRODUCTION
The past decade has attracted renewed interest in developing electrochemical sensors for quantification of biomarkers, owing to their low cost and adaptability to point-of-care (POC) setups 1, which could significantly impact healthcare 2. Clinically relevant targets for such quantification can be broadly classified into small molecules, nucleic acids, and proteins 3. To quantify through this range of molecular classes, most method development has drifted towards being target-focused and has lacked generalizability. Currently, the toolbox for potential POC analysis is a conglomerate of methods or specially targeted probes. There is a pressing need to develop methods amenable to quantitative readout of multiple classes of clinically relevant targets.
Nucleic-acid based electrochemical methods predominantly exploit the structure switching of a probe for target-dependent signal change 4. Impressively, these sensors are efficient for real-time measurements in the blood of living animals 5–7 . However, with structure-switching aptamers needed, many sensitive probes—antibodies or non-structure-switching aptamers—are insufficient, limiting generalizability. To further generalize, steric hindrance assays 8–11 and E-DNA scaffold sensors 2, 12–13 have been developed and validated with antibody probes without conformation switching. Still, non-covalent DNA hybridization demands solution equilibrium for probe construction, hindering the desired drop-and-read workflow. Most of these methods require DNA probes that are subjected to multiple conjugation steps, making probe preparation laborious and expensive.
In electrochemical bioanalysis, enzymes have functioned as amplification agents 14, probes 15, DNA ligation tools 16–17, DNA nicking reagents 18, and probe regenerators 19. In this work, we introduce the concept of enzymatically constructing a DNA-based assembly directly onto the electrode surface, creating a novel and versatile DNA nanostructure probe. The same configuration can be used to signal binding of antibodies, generic proteins or peptides, small molecules, aptamers, etc. Furthermore, it is independent of solution equilibrium, since the finally constructed probe is a single molecule that includes an electrochemical label and a binding moiety. The nanostructure undergoes a target-dependent shift in tethered-diffusion, which the redox molecule reports as a signal change. For validation, we have demonstrated the generalizability of this drop-and-read method by quantification of wide ranging targets from small molecules to antibodies.
RESULTS AND DISCUSSION
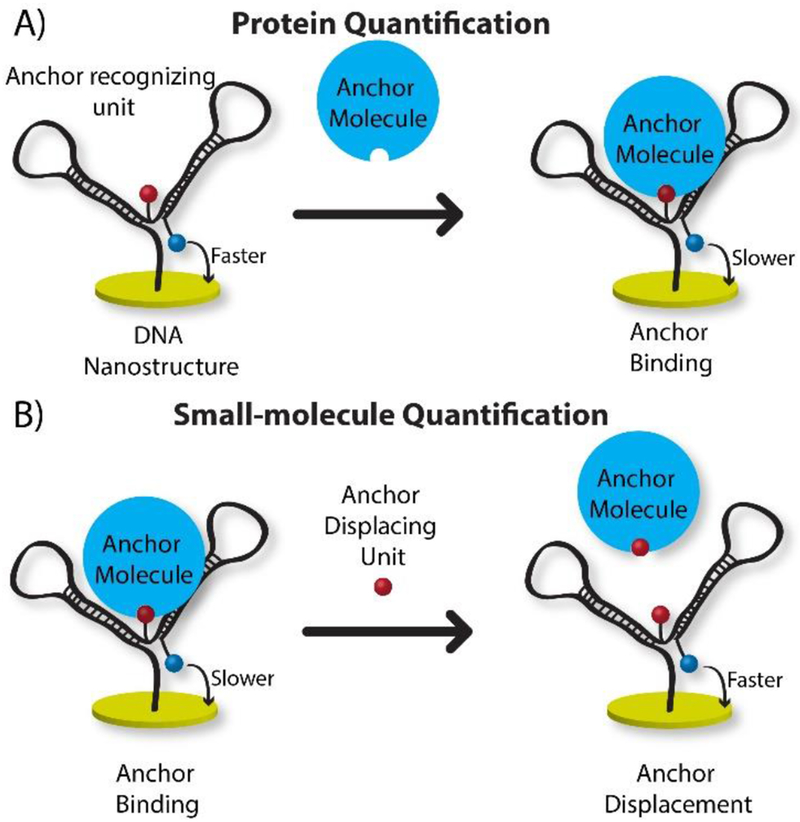
In our previous work, we highlighted the importance of temperature in DNA based electrochemical assays and its effect on tethered diffusion 20. With that understanding we hypothesized that a customized, more generalizable DNA nanostructure could be attached at a fixed distance from the surface and tailored to electrochemically report a variety of binding interactions. Such a nanostructure would undergo a change in mass upon binding that shifts the tethered diffusion 21, resulting in electrochemical signal change. Figure 1 depicts our protein and small molecule sensor designs, both based on the same DNA nanostructure. Tethered diffusion is altered by either attachment or displacement of an anchor molecule to the anchor recognition unit. To optimize signal change, care was taken to: 1) position redox molecules into close proximity with the anchor recognizing units; and 2) ensure the probe has a flexible tether between the electrode and redox label. In Figure 1A, for drop-and-read protein quantification, initially the DNA nanostructure has faster tethered diffusion, which on protein binding (anchor) slows, reducing electrochemical signal proportional to anchor concentration. Conversely, in the small-molecule quantification design (Figure 1B) the probe has an anchor molecule pre-bound to the nanostructure, starting with slow tethered diffusion. Upon introduction of target molecules in a drop-and read manner, the anchor is displaced into solution, increasing signal by enhanced diffusion. To test our hypothesis we initially chose two pairs of small molecules and protein partners: 1) streptavidin (52.8 kDa) and biotin (244.31 Da) due to the strong interaction; and 2) digoxigenin (390.51 Da) and anti-digoxigenin (~150 kDa) for the clinical relevance of antibodies. Finally, we applied the method to quantify the immunosuppressant small-molecule drug, tacrolimus (804 Da), which has not previously been measured using electrochemistry.
Figure 1.
A) In protein quantification mode, the redox molecule’s tethered diffusion is initially fast but slowed by anchor molecule binding; B) Small-molecule quantification mode starts with slower diffusion, but anchor displacement by target promotes faster diffusion and higher SWV current.
Like typical DNA-based electrochemical sensor probes, this method should incorporate an electrode immobilizing moiety (thiol or amine), a target recognizing region (aptamer, target binding small molecule, protein), and a redox label. Traditionally this combination is attained by either synthesizing probes as single units or constructing them on-demand through DNA hybridization. However, appending DNA with two or three modifications can result in very low yields, even from the best commercial sources. Instead, we employed the DNA-selective enzyme, T4 DNA ligase, for probe construction. We purchased three singly-conjugated DNA sequences (Figure 2A and Table-S1), one with dithiol (thio-DNA), the second with an internal small-molecule label (anchor-DNA), and a third with methylene blue redox tag (MB-DNA). One crucial benefit of this construction is the low cost; indeed, a detailed cost analysis (Tables S-2 to S-6) revealed approximately two orders of magnitude decreased cost using on-electrode ligation (45- to 223-fold), depending on the volumes used. A second important benefit here is that the “anchor recognizing unit” (red strand in Figure 2A) can be simply substituted prior to on-electrode ligation to allow a variety of analytes to be targeted or to promote assay multiplexing.
Figure 2.
DNA nanostructure assembly. A) Three DNAs: thiolated-DNA (blue), anchor-DNA (red), and MB-DNA (brown), are enzymatically ligated on-electrode into a single DNA nanostructure (black). B) DNA melting analysis confirmed that ligated single DNA was stable (Tm = 75 °C; red curve) compared to non-ligated DNA (Tm = 55 °C; blue curve). C) Ligated nanostructure was stable on electrodes even after four rinses (blue bars) while non-ligated structures were removed with a single water rinse (red bars).
Figure 2A depicts the DNA nanostructure’s initial hybridization design and final product after T4 DNA ligation. The anchor-DNA (red) binds with thio-DNA (blue), and the MB-DNA (brown) binds with anchor-DNA (red), both with 15 base-pairs. This hybridization positions the 5’-phosphorylation of thio-DNA and anchor-DNA in close proximity to 3’ of anchor-DNA and MB-DNA, respectively, assisted by intrastrand hairpin loops (5-bp hairpins). These locations are selectively ligated by the enzyme, forming a single stable entity (black) with three components into one DNA nanostructure (two 20-bp intramolecular hairpins) for electrochemical sensing. To confirm the ligation, we first conducted a free-solution DNA melting study with a DNA-intercalating fluorescence dye, SYBR green. Figure 2B shows the melting temperatures of non-ligated and ligated complexes were around 55 °C (red) and 75 °C (blue) respectively, affirming ligation success.
For building the DNA nanostructure on electrode surfaces, thio-DNA was immobilized on the gold electrode in a self-assembled monolayer. Later, the other two DNAs were introduced into the electrochemical cell and enzymatically ligated. After construction, the electrode was rinsed with water to remove unreacted strands and enzymes. Figure 2C shows the stability of the DNA nanostructure on the electrode surface. In the absence of ligase, the nanostructure is bound by non-covalent hybridization, an equilibrium process (Figure S-1). In buffer it exhibited ~20 nA of SWV current, but when exposed to water the non-ligated components dissociated (red bars). Conversely, the ligated nanostructure was stable on the surface even after four rinses (blue bars), with a surface yield of ~60%. These data confirm successful construction and stability of the DNA nanostructure on the electrode surface.
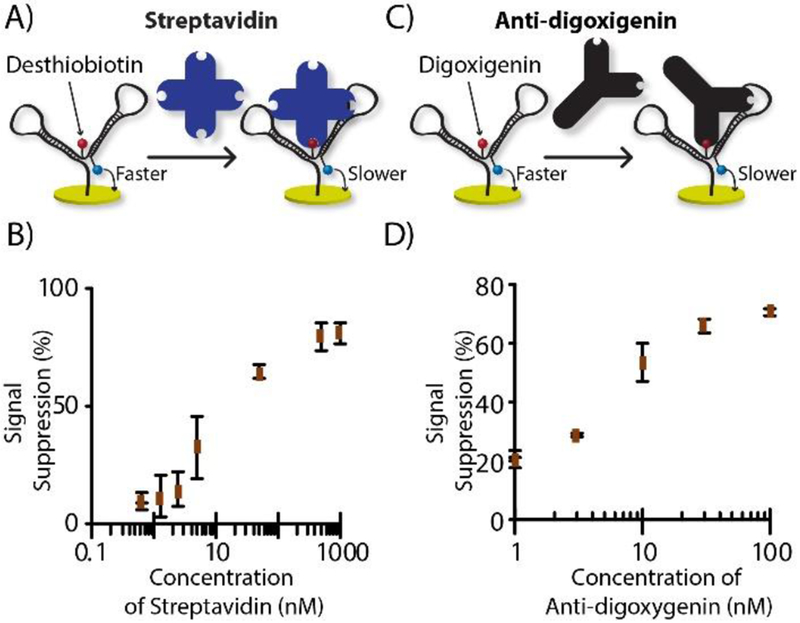
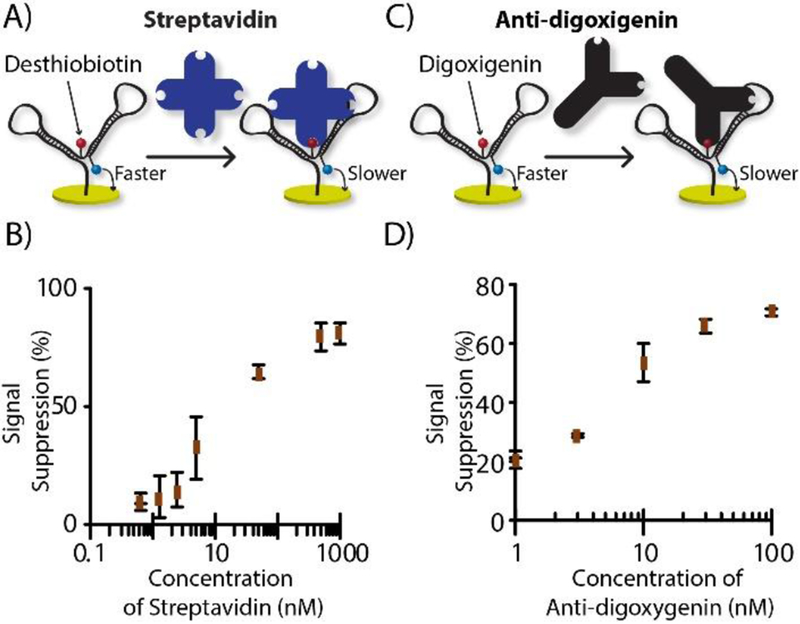
A shift in electrochemical reaction rate by analyte-probe binding is widely used 22. This shift is predominantly achieved by relocating redox molecules upon target-probe binding 23, a requirement that complicates probe selection and usually implores tedious trial-and-error development. To overcome this hurdle, our DNA nanostructure probe was designed for consistent redox molecule positioning, with the focus instead on a target-dependent change in tethered-diffusion of the nearby electrochemical label. For this purpose, the MB-DNA label was positioned strategically near the anchor-DNA label. As an introductory test of our hypothesis, we chose to set up the system for drop-and-read quantification of the protein, streptavidin (52.8 kDa), and an antibody, anti-digoxigenin (~150 kDa). These initial DNA nanostructures were made with either desthiobiotin on the anchor-DNA for streptavidin target protein, or with digoxigenin on the anchor DNA for detecting anti-digoxigenin antibody. First, the nanostructure’s current was measured as a blank, then 20 μL of target solution was incubated on the electrode. The electrode was rinsed, and current was measured again (Figure S-2), with each concentration measurement done in triplicate (3 electrodes). We observed an obvious drop in the peak height, supporting our hypothesis that the tethered diffusion of the redox molecule is slowed by target binding, akin to an anchor, in simple drop-and-read fashion (Figure 3A and 3C). The calibration curves of streptavidin and anti-digoxigenin are shown in Figure 3B and 3D, where concentration dependent signal suppression was observed. For streptavidin, an LOD of 3.67 nM (73.4 fmol) and a dynamic range of 5 to 500 nM were exhibited, while anti-digoxigenin was quantified with a 1.23 nM (24.6 fmol) LOD and a dynamic range from 2 to 100 nM. This result also confirmed the versatility of the method, since it was proven functional for two different tags (desthiobiotin or digoxigenin) that targeted two different types of proteins (streptavidin or anti-digoxigenin).
Figure 3.
Protein quantification mode. A) Streptavidin analyte with desthiobiotin as anchor recognition unit; B) streptavidin calibration curve. C) Antibody analyte with digoxigenin as anchor recognition unit; D) anti-digoxigenin calibration curve.
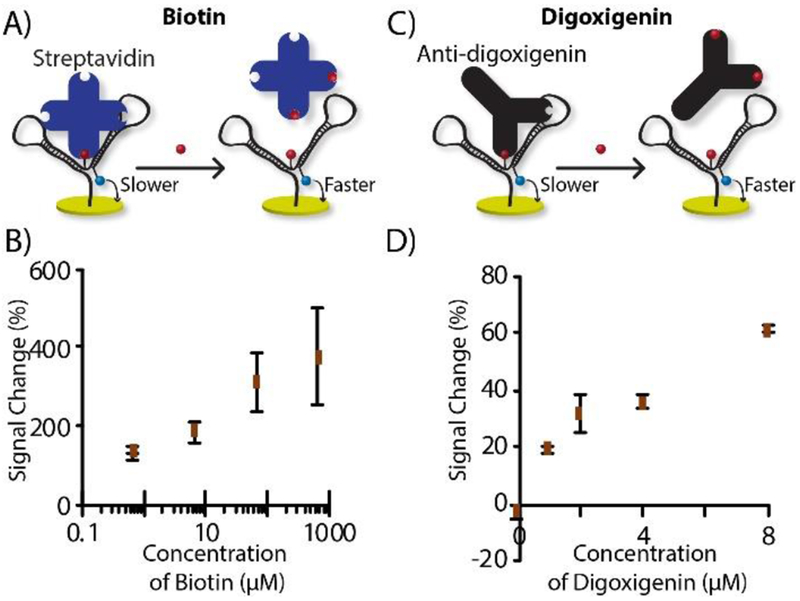
After confirming target-induced decreases in tethered diffusion of the nanostructure, we hypothesized that tethered diffusion could be increased again by displacing bound proteins (i.e. anchors), giving a small-molecule quantification mode (see Figure 1B). To test this hypothesis, we deployed the same nanostructures used earlier, this time for indirect quantification of biotin (244.31 Da) or digoxigenin (390.51 Da), respectively. In these cases, the probe included pre-bound streptavidin or anti-digoxigenin (Figure 4A & C) as anchor molecules. Streptavidin binds with biotin very strongly (Kd = ~10 −15 M), which should effectively displace streptavidin bound to desthiobotin (weaker; Kd = ~10 −12 M). This DNA nanostructure was constructed as before using on-electrode ligation, except the electrode was pre-incubated with streptavidin to slow the tethered diffusion. Using a similar protocol, biotin caused a concentration-dependent increase in signal (Figure 4B) with an LOD of 3.57 μM (71.4 pmol) and dynamic range of 5 to 50 μM. The same strategy was applied for digoxigenin quantification, with the anti-digoxigenin anchor. Figure 4D shows the calibration curve of digoxigenin, which exhibited an LOD of 177 nM (3.54 pmol) and a dynamic range of 1 to 8 μM.
Figure 4.
Small molecule quantification mode. A) Biotin quantification probe with desthiobiotin as anchor recognition unit and streptavidin as anchor molecule; B) calibration curve of biotin. C) Digoxigenin probe with digoxigenin as anchor recognition unit and anti-digoxigenin as anchor; D) digoxigenin calibration curve.
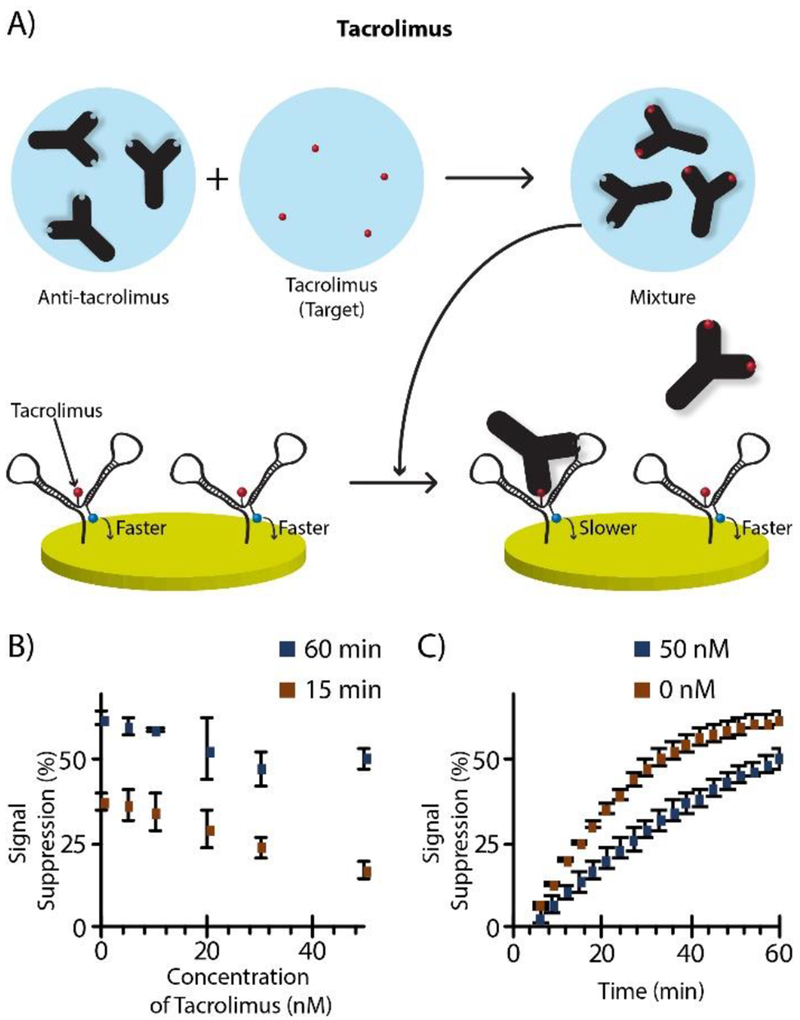
Further validation of the sensor architecture was done by quantifying tacrolimus, an immunosuppressant drug 24 prescribed to about 80% of solid-organ transplant patients in the United States 25, and a molecule that has yet to be quantified using direct electrochemistry. Due to its narrow range of therapeutic index, monitoring the blood concentration in transplant patients is essential for dosing. The currently accepted analytical approach is to use LC-MS/MS 26, which is not appropriate for POC analysis. Specialized bead-based immunoassay systems also exist27, but these require complex and expensive instrumentation. Development of an alternative method based on electrochemistry—highly amenable to POC—could therefore make a significant impact in human health. To do so, we modified the anchor-DNA (same sequence) with a tacrolimus tag, and the thio-DNA and MB-DNA were enzymatically constructed as before, this time for tacrolimus quantification. Since the therapeutic range of tacrolimus is in the nanomolar range (1 to 50 nM), a slightly modified two-step process was needed to successfully quantify in this range; target was pre-incubated with antibody followed by dropping the mixture onto the sensor surface (protocol in SI), as shown in Figure 5A. Once the mixture was dropped, a measurement was done every three minutes to understand the binding kinetics. Figure 5C compares the signal suppression by 0 nM and 50 nM, where signal was suppressed faster in the absence of target and slower when analyte competed with antibody binding to the DNA nanostructure. Figure 5B compares the calibration curves measured at 15 and 60 min after the mixture was added. Interestingly, these results demonstrate that the 15 min measurement time gave similar sensitivity, with 3σ LODs of 17.8 nM (1.78 pmol) and 15.0 nM (1.50 pmol) for the 15 min and 60 min measurements, respectively. Including incubation time, our method allowed tacrolimus to be quantified in its therapeutic index range with only a 45-min analysis time, which is suitable for future POC analysis. It should be noted that additional optimizations (antibody concentration, measurement time, probe density, etc.) are likely to improve the method even further in the future.
Figure 5.
Tacrolimus quantification. A) Two-step workflow was used to quantify in the lower nanomolar range, where target was pre-incubated with antibody (15 nM) at 37 °C for 30 min, then added to the electrode for measurement at 37 °C. B) Calibration curves at 15 and 60 min. C) Comparison of binding kinetics between 50 nM and 0 nM tacrolimus, where the signal suppression rate was slowed by target, as expected.
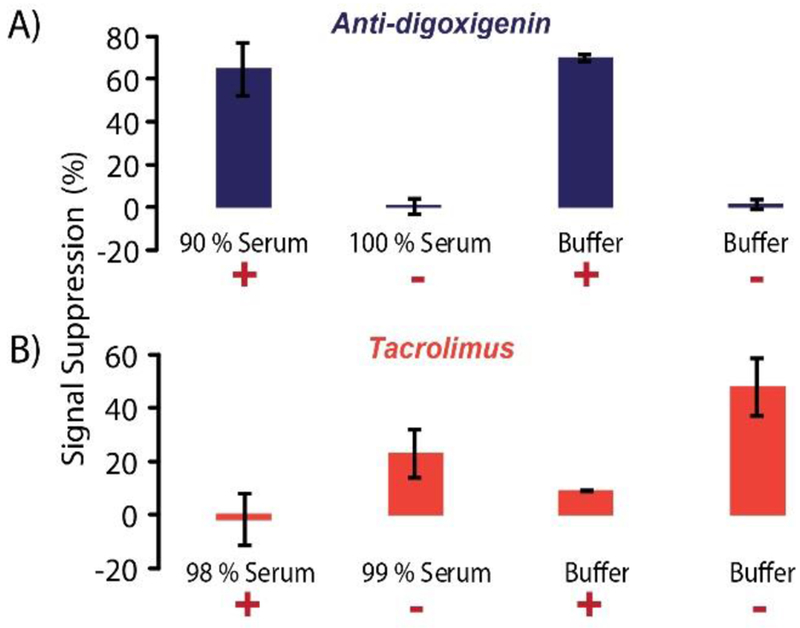
The above results showed that our sensor was versatile, with capability to measure a wide range of targets from small molecules to antibodies through a simple drop-and-read workflow. However, for an assay to be successful at the POC, the sensors should be stable in undiluted complex matrices to be helpful at sites lacking expertise. As such, our nanostructure was used to quantify both anti-digoxigenin antibodies and tacrolimus spiked into human serum. Figure 6 shows the signal suppression observed in spiked serum samples (n = 2). With anti-digoxigenin, the percentages of suppression agreed with results in buffer (both labeled as +). In unspiked serum and buffer, there was no observable change in the SWV current (both labeled as -). For the competitive nanostructure assay of tacrolimus, the trends in serum agreed with that of the buffer measurements, showing reduced suppression with analyte present (as designed), although there were some observable matrix effects. Nonetheless, both the large protein and small molecule methods were validated in serum, confirming the nanostructure’s versatility and stability.
Figure 6.
Serum stability of the nanostructure. A) 100 nM anti-Digoxigenin (+) spiked into undiluted serum (resulting in 90 % serum) and in buffer showed similar signal suppression levels. In the absence of anti-digoxigenin (−) the undiluted serum and buffer did not undergo observable signal changes. B) 50 nM tacrolimus (+) mixed with 15 nM antibody was spiked into undiluted serum and in buffer, then compared to controls with only antibody (−). Expected trends for the competitive assay were observed, albeit with some matrix effects.
CONCLUSIONS
In this work, we have presented two innovative concepts that result in a versatile electrochemical biosensor system. One concept was the assembly of a stable DNA nanostructure through on-electrode enzymatic ligation. Since DNA can be customized to form a wide variety of different structures via highly selective, programmable hybridization, our method using T4 DNA ligase at the electrode should set the stage for various other probe structures to be devised in the future, with nanometer precision. This should be particularly helpful where complex probe structures are needed, and the method should even open the possibility of fabricating much larger DNA structures on the surface than are currently possible with commercial solid-phase synthesis, i.e. hundreds of nucleotides in length. Furthermore, the idea allowed more economical use of commercially-synthesized DNA to circumvent complex purification procedures. The second innovation was a highly versatile assay platform. We confirmed that the same core nanostructure could be used for quantification of streptavidin, anti-digoxigenin, digoxigenin, and biotin. We also applied the method to quantify a novel analyte for electrochemistry, tacrolimus, which is a widely used immunosuppressant. In other words, the DNA nanostructure was capable of quantifying analytes from small molecules through large antibodies. The modular construction provides a simple route to target multiplexing by substituting the anchor-recognizing unit (red strand in Figure 2A), and the stability of the sensor in serum bodes well for future POC applications.
Supplementary Material
ACKNOWLEDGMENT
Funding for this work was provided by the National Institutes of Health through award R01 DK093810, and by the National Science Foundation through award CBET-1403495. The authors would also like to thank Innamed, Inc. for generously providing tacrolimus-modified DNA as well as the tacrolimus target and anti-tacrolimus antibody.
Footnotes
ASSOCIATED CONTENT
Supporting Information (SI)
Supporting Information (SI) is available free of charge on the ACS Publications website.
Experimental details and supporting figures and tables.
The assay system reported in this manuscript has been submitted for intellectual property protection, and the authors have recently entered into an exclusive option agreement with an interested party.
REFERENCES
- 1.Turner AP, Biosensors: sense and sensibility. Chemical Society reviews 2013, 42 (8), 3184–96. [DOI] [PubMed] [Google Scholar]
- 2.Kang D; Parolo C; Sun S; Ogden NE; Dahlquist FW; Plaxco KW, Expanding the Scope of Protein-Detecting Electrochemical DNA “Scaffold” Sensors. ACS sensors 2018, 3 (7), 1271–1275. [DOI] [PMC free article] [PubMed] [Google Scholar]
- 3.Labib M; Sargent EH; Kelley SO, Electrochemical Methods for the Analysis of Clinically Relevant Biomolecules. Chemical reviews 2016, 116 (16), 9001–90. [DOI] [PubMed] [Google Scholar]
- 4.Schoukroun-Barnes LR; Macazo FC; Gutierrez B; Lottermoser J; Liu J; White RJ, Reagentless, Structure-Switching, Electrochemical Aptamer-Based Sensors. Annual review of analytical chemistry (Palo Alto, Calif.) 2016, 9 (1), 163–81. [DOI] [PMC free article] [PubMed] [Google Scholar]
- 5.Arroyo-Curras N; Somerson J; Vieira PA; Ploense KL; Kippin TE; Plaxco KW, Real-time measurement of small molecules directly in awake, ambulatory animals. Proceedings of the National Academy of Sciences of the United States of America 2017, 114 (4), 645–650. [DOI] [PMC free article] [PubMed] [Google Scholar]
- 6.Ferguson BS; Hoggarth DA; Maliniak D; Ploense K; White RJ; Woodward N; Hsieh K; Bonham AJ; Eisenstein M; Kippin TE; Plaxco KW; Soh HT, Real-time, aptamer-based tracking of circulating therapeutic agents in living animals. Science translational medicine 2013, 5 (213), 213ra165. [DOI] [PMC free article] [PubMed] [Google Scholar]
- 7.Mage PL; Ferguson BS; Maliniak D; Ploense KL; Kippin TE; Soh HT, Closed-loop control of circulating drug levels in live animals. Nature Biomedical Engineering 2017, 1, 0070. [Google Scholar]
- 8.Mahshid SS; Camire S; Ricci F; Vallee-Belisle A, A Highly Selective Electrochemical DNA-Based Sensor That Employs Steric Hindrance Effects to Detect Proteins Directly in Whole Blood. Journal of the American Chemical Society 2015, 137 (50), 15596–9. [DOI] [PubMed] [Google Scholar]
- 9.Mahshid SS; Ricci F; Kelley SO; Vallee-Belisle A, Electrochemical DNA-Based Immunoassay That Employs Steric Hindrance To Detect Small Molecules Directly in Whole Blood. ACS sensors 2017, 2 (6), 718–723. [DOI] [PubMed] [Google Scholar]
- 10.Mahshid SS; Vallee-Belisle A; Kelley SO, Biomolecular Steric Hindrance Effects Are Enhanced on Nanostructured Microelectrodes. Analytical chemistry 2017, 89 (18), 9751–9757. [DOI] [PubMed] [Google Scholar]
- 11.Zhou W; Mahshid SS; Wang W; Vallee-Belisle A; Zandstra PW; Sargent EH; Kelley SO, Steric Hindrance Assay for Secreted Factors in Stem Cell Culture. ACS sensors 2017, 2 (4), 495–500. [DOI] [PubMed] [Google Scholar]
- 12.Bonham AJ; Paden NG; Ricci F; Plaxco KW, Detection of IP-10 protein marker in undiluted blood serum via an electrochemical E-DNA scaffold sensor. The Analyst 2013, 138 (19), 5580–3. [DOI] [PMC free article] [PubMed] [Google Scholar]
- 13.Cash KJ; Ricci F; Plaxco KW, An electrochemical sensor for the detection of protein-small molecule interactions directly in serum and other complex matrices. Journal of the American Chemical Society 2009, 131 (20), 6955–7. [DOI] [PMC free article] [PubMed] [Google Scholar]
- 14.Yeung SS; Lee TM; Hsing IM, Electrochemical real-time polymerase chain reaction. Journal of the American Chemical Society 2006, 128 (41), 13374–5. [DOI] [PubMed] [Google Scholar]
- 15.Campos PP; Moraes ML; Volpati D; Miranda PB; Oliveira ON Jr.; Ferreira M, Amperometric detection of lactose using beta-galactosidase immobilized in layer-by-layer films. ACS applied materials & interfaces 2014, 6 (14), 11657–64. [DOI] [PubMed] [Google Scholar]
- 16.Lee HJ; Wark AW; Li Y; Corn RM, Fabricating RNA microarrays with RNA-DNA surface ligation chemistry. Analytical chemistry 2005, 77 (23), 7832–7. [DOI] [PubMed] [Google Scholar]
- 17.Wang Y; He X; Wang K; Ni X, A sensitive ligase-based ATP electrochemical assay using molecular beacon-like DNA. Biosensors & bioelectronics 2010, 25 (9), 2101–6. [DOI] [PubMed] [Google Scholar]
- 18.Zhao T; Lin C; Yao Q; Chen X, A label-free electrochemiluminescent sensor for ATP detection based on ATP-dependent ligation. Talanta 2016, 154, 492–7. [DOI] [PubMed] [Google Scholar]
- 19.Hu J; Yu Y; Brooks JC; Godwin LA; Somasundaram S; Torabinejad F; Kim J; Shannon C; Easley CJ, A reusable electrochemical proximity assay for highly selective, real-time protein quantitation in biological matrices. Journal of the American Chemical Society 2014, 136 (23), 8467–74. [DOI] [PMC free article] [PubMed] [Google Scholar]
- 20.Somasundaram S; Holtan MD; Easley CJ, Understanding Signal and Background in a Thermally Resolved, Single-Branched DNA Assay Using Square Wave Voltammetry. Analytical chemistry 2018, 90 (5), 3584–3591. [DOI] [PMC free article] [PubMed] [Google Scholar]
- 21.Huang KC; White RJ, Random walk on a leash: a simple single-molecule diffusion model for surface-tethered redox molecules with flexible linkers. Journal of the American Chemical Society 2013, 135 (34), 12808–17. [DOI] [PubMed] [Google Scholar]
- 22.White RJ; Plaxco KW, Exploiting binding-induced changes in probe flexibility for the optimization of electrochemical biosensors. Analytical chemistry 2010, 82 (1), 73–6. [DOI] [PMC free article] [PubMed] [Google Scholar]
- 23.Lubin AA; Hunt BV; White RJ; Plaxco KW, Effects of probe length, probe geometry, and redox-tag placement on the performance of the electrochemical E-DNA sensor. Analytical chemistry 2009, 81 (6), 2150–8. [DOI] [PubMed] [Google Scholar]
- 24.Mayer AD; Dmitrewski J; Squifflet J-P; Besse T; Grabensee B; Klein B; Eigler FW; Heemann U; Pichlmayr R; Behrend M; Vanrenterghem Y; Donck J; van Hooff J; Christiaans M; Morales JM; Andres A; Johnson RWG; Short C; Buchholz B; Rehmert N; Land W; Schleibner S; Forsythe JLR; Talbot D; Neumayer H-H; Hauser I; Ericzon B-G; Brattström C; Claesson K; Mühlbacher F; Pohanka E, Multicenter randomized trial comparing tacrolimus (FK506) and cyclosporine in the prevention of renal allograft rejection: a report of the European Tacrolimus Multicenter Renal Study Group. Transplantation 1997, 64 (3), 436–443. [DOI] [PubMed] [Google Scholar]
- 25.Shokati T; Bodenberger N; Gadpaille H; Schniedewind B; Vinks AA; Jiang W; Alloway RR; Christians U, Quantification of the Immunosuppressant Tacrolimus on Dried Blood Spots Using LC-MS/MS. J. Vis. Exp. 2015, No. 105, e52424. [DOI] [PMC free article] [PubMed] [Google Scholar]
- 26.Holt DW; Armstrong VW; Griesmacher A; Morris RG; Napoli KL; Shaw LM, International Federation of Clinical Chemistry/International Association of Therapeutic Drug Monitoring and Clinical Toxicology working group on immunosuppressive drug monitoring. Ther. Drug Monit. 2002, e (1), 59–67. [DOI] [PubMed] [Google Scholar]
- 27.Bargnoux AS; Sutra T; Badiou S; Kuster N; Dupuy AM; Mourad G; Pageaux GP; Le Quintrec M; Cristol JP, Evaluation of the New Siemens Tacrolimus Assay on the Dimension EXL Integrated Chemistry System Analyzer: Comparison With an Ultra-Performance Liquid Chromatography-Tandem Mass Spectrometry Method. Ther. Drug Monit. 2016, 38 (6), 808–812. [DOI] [PubMed] [Google Scholar]
Associated Data
This section collects any data citations, data availability statements, or supplementary materials included in this article.


