

Abstract
Angelman syndrome (AS) is a neurodevelopmental disorder due to a functional deficit, usually a deletion, of the UBE3A gene located in the 15q11–q13 chromosome region. We report the first microarray analysis of gene expression in AS using a custom cDNA microarray to compare expression patterns from lymphoblastoid cell lines from control males and AS subjects with a 15q deletion or uniparental paternal disomy 15. Expression patterns of genes known to be biallelically expressed or paternally or maternally expressed were consistent with expectations. We detected paternal or maternal allelic bias in the expression of several genes and transcripts (e.g., GABRA5, GABRB3, WI-14946). Additionally, mechanisms controlling paternal allele expression appear to be faithfully replicated in each paternal chromosome in individuals with paternal disomy. Our results indicate that interconnected mechanisms can produce subtle and unexpected changes in gene expression that may help explain the phenotypic differences observed among the genetic subtypes of AS.
Keywords: Angelman syndrome, Prader–Willi syndrome, Gene expression, Microarray, Imprinting, UPD, UBE3A, ATP10A
Angelman syndrome (AS) is a neurodevelopmental disorder (with or without epileptic seizures) characterized by severe learning difficulties, ataxia, subtle dysmorphic facial features, and a happy, sociable disposition [1]. AS is the result of functional defects in the UBE3A gene caused by a variety of genetic abnormalities involving the chromosome 15q11–q13 region, which is subject to genomic imprinting. These include maternal deletion (65–75%), paternal uniparental disomy (UPD; 3–5%), imprinting defects (ID; 3–10%), and point mutations or small deletions within the UBE3A gene (5–10%), which lies within 15q11–q13, and the remaining AS patients have no identifiable molecular abnormality (10–14%) [2]. UBE3A shows tissue-specific imprinting, being expressed exclusively from the maternal allele in brain tissue. Different mechanisms of UBE3A inactivation (i.e., different genetic subtypes) correlate with clinical phenotypes of varying severity [3].
The 15q11–q13 region contains about 4 million base pairs of DNA and as many as 50–100 genes/transcripts. Recent evidence supports the existence of at least 30 presumed genes in the region (see Fig. 1). At least two genes in this region are maternally expressed in some tissues [UBE3A and ATP10C (approved gene symbol ATP10A)] [4]. To date, several genes with paternal expression have been located in this region. The lack of paternal expression of several candidate genes (e.g., SNRPN and associated sno RNAs) causes Prader–Willi syndrome (PWS), a clinically different disorder but also associated with genomic imprinting of the 15q11–q13 region.
Fig. 1.
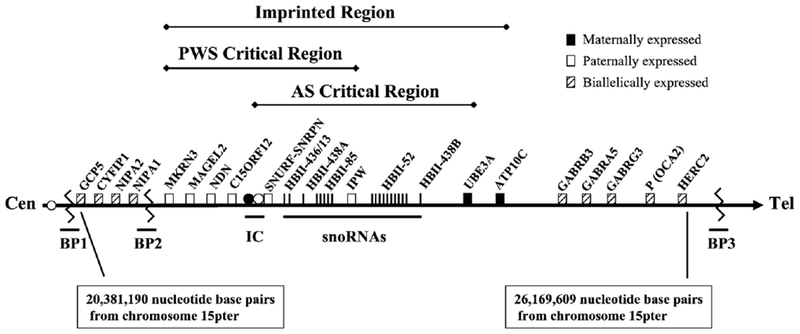
Schematic diagram of human chromosomal region 15q11–q13. White boxes represent genes expressed from the paternal chromosome only, black boxes represent genes expressed from the maternal chromosome only, and boxes with diagonal lines represent genes expressed from both chromosomes. The imprinting centers (IC) for AS (black) and PWS (white) are shown. BP1, BP2, and BP3 represent the two proximal breakpoints and one distal breakpoint observed in both AS and PWS associated with the typical 15q11–q13 deletions. Nucleotide numbers represent the proximal and distal nucleotide base pairs for GCP5 and HERC2, respectively, relative to the chromosome 15p terminus and taken from the UCSC Genome Browser (http://genome.ucsc.edu).
We previously analyzed more than 70 genes/transcripts within or distal to the 15q11–q13 region using a custom-made microarray [5]. Our findings indicated that PWS gene expression was perturbed in unexpected ways, resulting from a paternal deletion of 15q11—q13 or the presence of two maternal copies of chromosome 15 (maternal UPD). Our data suggested that the expression of genes and transcripts in and distal to 15q11—q13 in PWS were influenced by chromatin structure and context, as well as the imprinting center.
Several reports indicate that subjects with AS or PWS with 15q11–q13 deletions have different clinical presentations than subjects with UPD [3,6–10]. AS patients with deletions tend to have the most classical and severe phenotype. They achieve developmental milestones later and to a lesser degree than the other classes. AS deletion patients also have the highest incidence of severe seizures and hypopigmentation of all AS classes. In contrast, AS patients with paternal UPD or ID, as groups, are indistinguishable from each other and are much less severely affected. They have a low incidence of hypopigmentation, microcephaly, and severe seizures [3]. AS subjects with UBE3A mutations have a clinical presentation that is intermediate to the deletion and UPD and ID patients [3]. They are more like deletion patients with respect to seizures, absence of speech, and microcephaly. However, they are similar to UPD and ID patients in the development of motor skills, ability to follow simple commands, and weight gain. The differences between AS subjects with different genetic subtypes must be related, at least in part, to the underlying differences in gene expression of the subtypes.
To gain a better understanding of the complex nature of gene expression in the 15q11–q13 region we performed microarray analysis using RNA from young male individuals with AS and controls to compare with our previously reported gene expression studies in PWS. To our knowledge this is the first report of microarray gene expression studies in AS.
Results
The target sequences from AS subjects (either UPD or deletion) were labeled with Alexa 647 (red) and the target sequences from the male control subjects were labeled with Alexa 555 (green). Fig. 2 is a visual presentation of the similarity in replicated spot intensities seen within the arrays. In general, after normalization, spot intensities for each probe were similar across arrays as represented by the standard errors shown in Fig. 3.
Fig. 2.
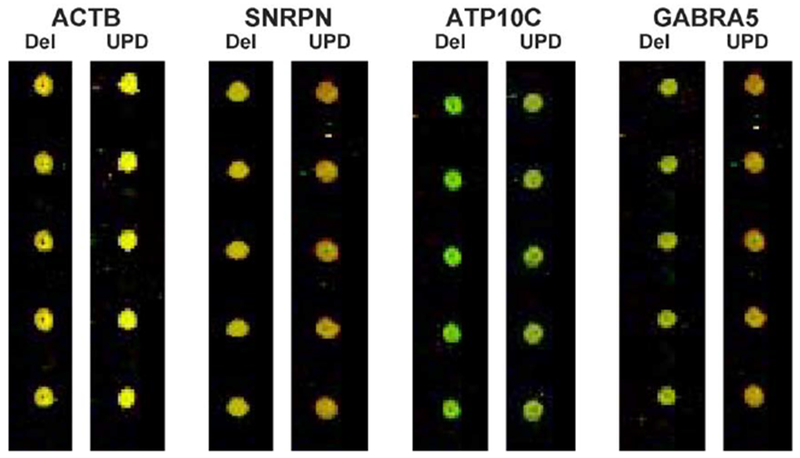
Replicate hybridization spots from the custom cDNA array. Target sequences from the AS subjects resulting from 15q11–q13 deletions (Del) or uniparental paternal disomy (UPD) were labeled with Alexa 647 (red) and target sequences from controls were labeled with Alexa 555 (green).
Fig. 3.
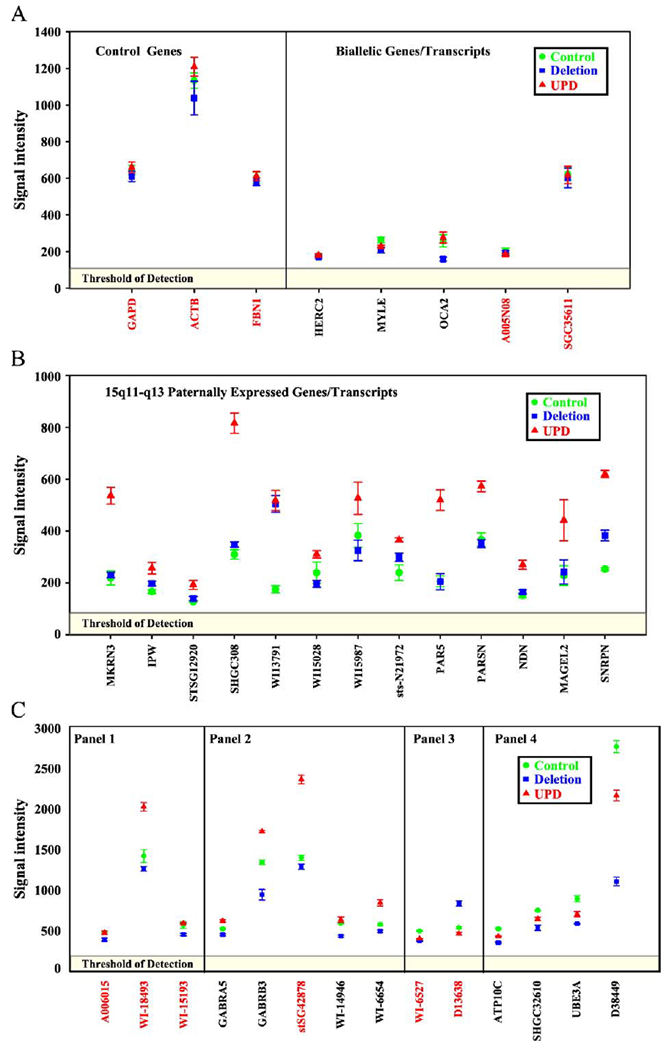
Comparative expression levels of genes/transcripts. Data represent the normalized means ± the standard error. Each probe was replicated 10 times on each of four arrays, two labeled with Alexa 555 and two labeled with Alexa 647. (A) Control and biallelically expressed genes/transcripts. (B) Paternally expressed genes/transcripts from 15q11–q13. (C) Genes/transcripts with variant expression levels [panel 1, PWS UPD < PWS deletion and control; panel 2, paternal bias; panel 3, PWS deletion > control & PWS UPD; panel 4, maternal bias (panel 1–panel 4 adapted from Bittel et al. [5]; used by permission of the publisher)]. Red lettering indicates sequences that map outside the 15q11–q13 region.
The custom array used for our analyses contained several genes both within (e.g., OCA2) and outside of (e.g., GAPD, ACTB, and FBNl) the 15q11–q13 region and known to be biallelically expressed. The expression levels of these genes were all very similar in the individuals and the groups examined (Fig. 3A). In addition, the 15q11–q13 region is known to contain several imprinted genes/transcripts that express only from the paternal allele [11,12]. AS subjects with deletions are missing the maternal allele; therefore the deletion should have no impact on the expression of these alleles. Indeed there was generally no significant difference between the expression of paternally expressed genes in the AS deletion subjects and the controls (Fig. 3B). However, since the subjects with AS due to paternal UPD have two paternal copies of chromosome 15, it might be expected that the expression of paternally expressed genes would be approximately twice that of controls or AS individuals with deletions. Those genes known to be paternally expressed all produced signal intensities from the AS subjects with UPD approximately twice those of the controls and AS individuals with deletions (Fig. 3B). Apparently, the regulatory mechanism that establishes and maintains the expression level from these genes is faithfully replicated in both paternal copies of chromosome 15 in AS subjects with UPD.
Previously we observed 14 genes/transcripts that produced signal intensities from PWS cell lines that were inconsistent with equal expression from both alleles (biallelic) or monoallelic expression from the paternal allele [5]. We divided these 14 genes/transcripts into four categories based on the relationship of the expression intensities between the subject groups examined. These genes were of particular interest in the present study on AS and remained grouped based on their expression in PWS.
The first group contained three transcripts that had significantly less expression in cell cultures derived from PWS subjects with UPD than either of the other two groups. These three transcripts were all located outside the 15q11—q13 region, suggesting that the expression from the maternal allele is reduced relative to the paternal allele. If this pattern is maintained in AS, significantly more expression in the AS UPD subjects would be expected since they have two paternal alleles for each of these transcripts. One of the transcripts, WI-18493, did produce significantly greater expression in the AS UPD group relative to the AS deletion or control groups (Fig. 3C, panel 1).
The second group contained genes/transcripts whereby expression from PWS deletion subjects was significantly less than half that of the controls. Expression from the PWS UPD cell lines was greater than that from the deletion lines but significantly less than that from the control. This suggested paternal bias in the allelic expression pattern of these genes/transcripts. As with the first group, if the paternal allele is transcribed preferentially compared with the maternal allele, one would predict that two copies of paternally derived alleles (as present in AS UPD subjects) should produce greater expression than the control. All five genes/transcripts in the second group had significantly greater expression in cells derived from AS UPD subjects (Fig. 3C, panel 2). This is consistent with our previous observations of paternal bias in the expression of these genes/transcripts.
The third group contained two transcripts from outside the 15q11–q13 region and the intensity levels from the PWS deletion cell cultures were significantly greater than either the control or the PWS UPD cell cultures. Although these transcripts were not deleted, we hypothesized that repositioning relative to the centromere may have increased their transcription level. If repositioning due to the deletion has the same impact on the maternal allele as on the paternal allele, then the AS deletion subjects would have greater expression of these genes than the control. One transcript, D13638, did indeed have greater expression in the cell lines from AS deletion subjects compared to the cell lines derived from AS UPD subjects or controls (Fig. 3C, panel 3).
The fourth group contained genes/transcripts with intensity levels significantly higher in the PWS UPD cell cultures, suggesting that expression was exclusively, or at least primarily, from the maternal allele. Two of the genes in the fourth group, UBE3A and ATP10C, are maternally expressed in some tissues, including the brain [4]. Expression of UBE3A and ATP10C was detectable in lymphoblasts from all individuals (AS and controls) but higher expression was observed in the controls. Therefore, deleting the maternal allele should reduce the total expression by more than 50%, and having two paternal alleles should produce less RNA than the control. The four genes/transcripts in this group agreed with our previous observation of maternal bias in our PWS studies, with greater expression in the controls with an intact maternal 15q11–q13 region (Fig. 3C, panel 4).
Several of the genes were chosen for validation by quantitative RT-PCR. CT values generated from at least six replicated quantitative RT-PCRs for each individual and calculations of fold change in gene expression were in agreement with the microarray data (data not shown). Fig. 4 shows a representative example using GABRB3 of a single set of curves generated by quantitative RT-PCR.
Fig. 4.
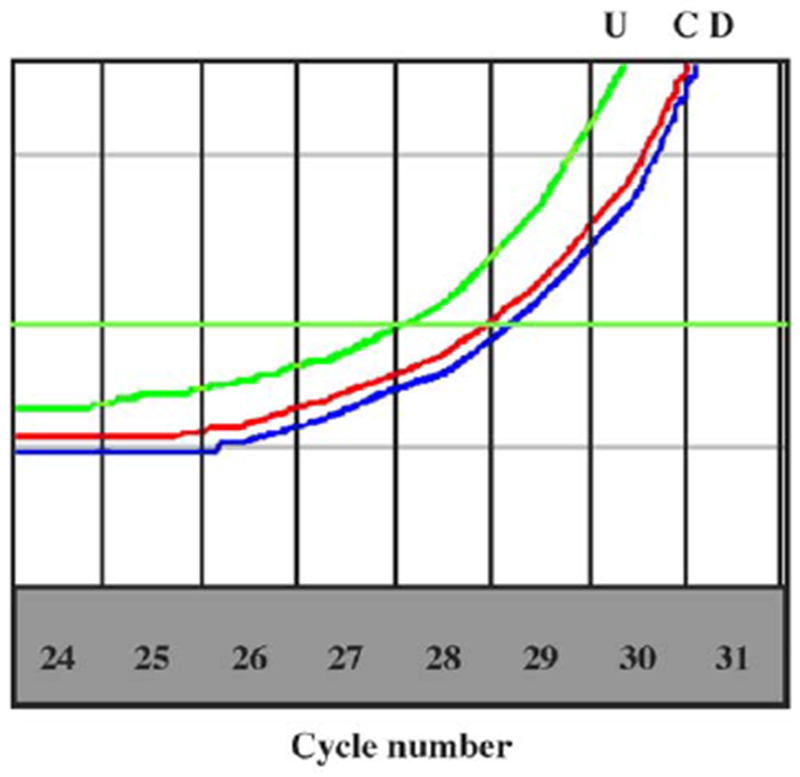
Representative quantitative RT-PCR using primers specific for GABRB3. Total RNA was extracted from actively growing lymphoblast cultures and equal quantities were used in a QuantiTect all-in-one RT-PCR using Sybr green fluorescence to quantify the amplicon. The CT was set at the narrowest portion of the logarithmic phase of amplification (C, control; U, AS UPD; D, AS deletion). The cycle difference between the control (27.7 cycles) and AS UPD (26.9 cycles) was 0.8 cycle, which corresponds to a fold change in expression of 1.7 indicating a higher expression in AS UPD. For the deletion group, the cycle was 28.2, which represents a difference of 0.5 cycle, which corresponds to a −1.4-fold change in expression compared with the control, indicating a lower expression in AS deletion.
Discussion
The regulatory mechanisms that control gene expression in the 15q11–q13 region are not clearly understood. We report the first study using a custom cDNA microarray to analyze and compare gene expression in lymphoblastoid cells from male subjects with AS with either the 15q11–q13 deletion or UPD and comparison males. Gene expression in lymphoblastoid cell lines may be different from gene expression in other tissues; however, lymphoblast cells were used because they were readily accessible.
In general, sequences from outside the 15q11–q13 region produced signal intensities that were similar in the AS and the control subjects (see Fig. 3A for representative examples). Genes and transcripts previously identified as maternally imprinted (paternally expressed) produced no detectable signal in the cell lines from reported PWS individuals, with the exception of transcripts WI-15028, WI-15987, and N21972, which were slightly above the threshold in PWS individuals, probably as a result of cross-hybridization [5]. The paternally expressed transcripts all produced significantly greater signals in the AS UPD samples. This is consistent with the fact that they have two paternal copies of each of these genes/transcripts. Apparently, the mechanism that establishes allele specificity is dependent only on parent of origin and is allele copy number independent. Therefore, both paternally derived alleles in the AS UPD subjects behave similarly (i.e., expressed).
The remaining genes and transcripts were divided into four categories based on the expression in PWS (see [5]). First, three transcripts, all located distal to 15q11–q13, had significantly less expression in the PWS UPD cell lines than in either the PWS deletion or the control cell lines (Fig. 3C, panel 1), suggesting paternal bias in their expression pattern [5]. If the paternal allele is overexpressed in AS cell cultures, then the AS UPD cells should have greater expression than the controls. One of these three transcripts, WI-18493, had greater expression in the AS UPD cell cultures, indicating that this transcript does indeed have greater expression of the paternal allele. However, the other two transcripts, A006015 and WI-15193, had approximately the same expression level in the AS UPD subjects as in the control subjects but higher than in AS deletion subjects. The imprinting domain varies in size and scope depending on maternal or paternal origin. Due to this parent of origin variation and location close to the centromere, differences in expression of maternal and paternal genes within and near the 15q11—q13 region may occur. Apparently, the presence of two copies of the maternal chromosome 15 (PWS UPD) has a more obvious effect on the expression of these two transcripts (i.e., less detectable expression relative to control), whereas the presence of two paternal chromosomes (AS UPD) has less of an impact on expression of the transcripts (i.e., similar expression relative to the control). Our gene expression data provide evidence that repositioning of nearby genes outside of the imprinted region as a result of a deletion may produce altered gene expression. This may relate to differences in imprinting or methylation status, repositioning of genes closer to the centromere, or change in chromatin structure.
The second group of transcripts (Fig. 3C, panel 2) contained several sequences from within the 15q11–q13 region and showed expression patterns indicating paternal bias (the paternal allele expressed significantly more than the maternal allele in PWS cell cultures). By comparing the expression level of single paternal alleles (AS deletion subjects) and single maternal alleles (PWS deletion subjects) with the expression of those genes from control subjects with both alleles, a clear bias in the expression of the paternal allele was evident. This suggests that at least in this group of genes/transcripts, the mechanism that determines allele specificity (paternal vs maternal) is maintained in both AS and PWS subjects. Furthermore, AS subjects with UPD (two sets of paternal alleles) had significantly greater expression of these genes than did the control subjects (one set of paternal and one set of maternal alleles), indicating that the regulatory mechanism is maintained by both paternal alleles. The mechanism controlling the unequal expression from paternal and maternal alleles is not known; however, it does seem clear that epigenetic control of gene expression influences expression in ways that subtly alter allele-specific expression. The group of paternally biased genes also included the GABA receptor subunit genes, which supported our previous gene expression data in PWS [5].
The third group (Fig. 3C, panel 3) included two transcripts from outside the 15q11—q13 region that expressed at higher levels in the PWS deletion subjects compared to either PWS UPD or control subjects [5]. We hypothesized that repositioning the transcript as a result of the deletion could change the proximal regulatory sequences, which may alter gene expression. This repositioning effect may occur in the presence of a maternal deletion as it did on the paternal chromosome. However, the paternal and maternal chromosomes are not equivalent and a deletion of maternal origin may not necessarily affect the transcripts the same way. D13638 did have increased expression in the AS deletion cell cultures, suggesting that repositioning the maternal allele of this transcript upregulated its expression. The expression of the other two transcripts, however, was unaffected by repositioning. This suggests that the effect we observed when the deletion occurred on the paternal chromosome [5] did not have the same affect on maternal alleles, most likely as a result of differing regulatory elements (e.g., methylation patterns) associated with maternal inheritance.
The fourth group (Fig. 3C, panel 4), including AS candidate genes UBE3A and ATP10C, had greater expression in the PWS UPD cells than in the controls, indicating maternal bias of expression [5]. UBE3A and ATP10C are known to be maternally expressed, although for UBE3A only in the brain [5,13]. The AS UPD cell cultures (with two sets of paternal alleles) produced less RNA from these genes than in the control cells, in agreement with our previous observation, although SHGC32610 was inconclusive.
We included on this microarray four newly identified genes, NIPA1, NIPA2, GCP5, and CYFIP1, recently mapped between breakpoint 1 (BP1) and breakpoint 2 (BP2) in 15q11 [14]. We saw no evidence of epigenetic control of these genes (e.g., imprinting or allele-specific bias), which is in agreement with previous observations. NIPA1 is a candidate gene for hereditary spastic paraplegia [15]. These four genes located between BP1 and BP2 (see Fig. 1) may contribute to the recently reported differences observed between PWS individuals with different deletion sizes [16].
These data add further support to our previous observation that expression of genes and transcripts in the 15q11–q13 region are regulated by multiple interacting mechanisms. Phenotypic and cognitive differences between the genetic subtypes of AS and PWS suggest that there are underlying gene expression patterns between the subtypes, which contribute to the observed variation. Our sample size was too small to determine accurate genotype/phenotype correlations. However, we noted that expression of the P gene (OCA2) in the AS subjects with deletions was approximately half of that seen in UPD and control subjects, which agrees with reduced pigmentation in the deletion subjects. Our data should support additional studies with larger numbers of subjects to associate phenotypic differences with gene expression patterns in the genetic subtypes of both AS and PWS.
Subjects and methods
Subjects
Our study subjects included young males, six with AS [3 with 15q11–q13 deletion (mean age 5.3 years) and three with UPD (mean age 14.9 years)] and three nonsyndromic comparison males (mean age 14.3 years). Chromosomal status in the AS subjects was confirmed by FISH and microsatellite analysis using standard techniques.
Methods
Briefly, 77 nonredundant sequences mapping to the 15q11–q13 region, the majority within the 15q11–q13 region, were chosen for the microarray as previously described [5]. Four of these were sequences mapped proximal to the D15S1035 locus, 25 were mapped between D15S1035 and D15S122 anchor markers, 6 between D15S122 and D15S156, 11 between D15S156 and D15S165, 7 between D15S165 and D15S144, and 7 between D15S144 and D15S118, and 17 were distal to D15S118. Microarrays were generated by spotting cDNA following PCR amplification of reverse-transcribed mRNA isolated from actively growing lymphoblastoid cell lines or from adult brain cDNA (Stratagene, La Jolla, CA, USA). PCR products were purified and electrophoresed to verify the presence of a single band of the correct size for each gene/transcript. The products were purified and resuspended in 50% DMSO. Each probe (cDNA) was spotted 10 times onto CGAP slides (Corning, Corning, NY, USA) using an Affymetrix 427 arrayer.
Target total RNA was isolated, using the Trizol reagent (Invitrogen, Foster City, CA, USA), from actively growing lymphoblastoid cell cultures from each of the nine male individuals. Total RNA from lymphoblast cell cultures derived from the AS and comparison subjects was alternately labeled with fluorochromes Alexa 555 (green) and Alexa 647 (red) (Molecular Probes, Eugene, OR, USA). This was accomplished by reverse transcription of the RNA using Super Script II (Invitrogen). The reaction used equal quantities of total RNA as the template and an oligo(dT) primer while incorporating aminoallyl dUTP. The fluorochromes were then chemically linked to the aminoallyl modified cDNA following the manufacturer’s instructions. Two alternately labeled cDNAs were pooled and applied to the microarray. The hybridizations were done in 3× SSC, 0.1% SDS, and 0.1 μg/μl human Cot DNA (Invitrogen) at 55°C overnight in a humidified hybridization chamber (Boekel, Feasterville, PA, USA). The following day the slides were washed in 2× SSC, 0.1% SDS at 50°C, followed by two washes with 0.1× SSC, 0.1% SDS at room temperature, followed by four washes in 0.1× SSC and one wash in distilled water, with a final rinse in 100% ethanol, and dried by centrifugation. The slides were scanned with an Affymetrix 428 slide scanner and the data analyzed with Jaguar v.2 software (Affymetrix, Santa Clara, CA, USA).
To maximize the total number of comparisons, the arrays were performed in sets following a looping design [17] (e.g., Set 1 compared control subjects to AS deletion subjects, Set 2 compared control subjects to AS UPD subjects, and Set 3 compared AS deletion subjects to AS UPD subjects as described in [5]). This looping design for the total of nine subjects required the use of 18 custommade microarray slides. Within each set, each individual target was labeled with both Alexa 555 and Alexa 647 and compared to different subjects, respectively. Thus, each target was arrayed 10 times, replicated twice for each color of dye, and hybridized in four different combinations. Therefore, the average signal intensity per subject was calculated from 40 replicate spots per gene/transcript for Alexa 555 and 40 replicate spots per gene/transcript for Alexa 647.
Additionally, quantitative RT-PCR was performed on a subset of genes/transcripts using a QuantiTect SYBR Green RT-PCR kit (Qiagen, Valencia, CA, USA) according to the manufacturer’s directions. Briefly, an equal quantity of total RNA from an individual subject, together with primers specific to the gene/transcript being quantified, was added to a reaction mix containing all components necessary for reverse transcription and PCR. The reaction was carried out in an ABI 7000 system (Applied Biosystems, Foster City, CA) beginning with a 30-min step at 50°C to allow for reverse transcription, followed by 15 min at 95°C. The PCR followed for 45 to 50 cycles, during which the intensity of the Sybr green fluorescence was measured at the extension step of each PCR cycle. The point at which the intensity level crossed the threshold (CT, defined as the narrowest point between individual reactions in the logarithmic phase of the reaction) was used to compare individual reactions. All samples were run at least three times. A dissociation curve was generated for all reactions and run on agarose gels to verify the presence of a single band. In addition, a quantitative RT-PCR was done using primers specific to GAPD, a housekeeping gene, on all RNA samples. This allowed for normalization of all samples relative to GAPD.
Analysis
Multiple cDNAs with no hybridizing signal, including several plant genes, as well as artificial sequences from the Lucidea kit (Amersham, Piscataway, NJ, USA) were spotted to define the threshold of detection. Our threshold was defined as the average signal intensity from the negative probes plus 2 standard deviations. Signal intensities below the threshold were designated as not detectable. The slides were normalized to account for slide to slide variability and differences in dye intensity using the calibration probes from the Lucidea kit. Average signal intensities for each sequence were determined for each subject and used to generate the mean signal intensity and standard error for the group. Statistically significant differences in expression levels of genes in the three groups were determined by independent t tests.
References
- [1].Cassidy SB, Dykens E, Williams CA, Prader–Willi and Angelman syndromes: sister imprinted disorders, Am. J. Med. Genet. 97 (2000) 136–146. [DOI] [PubMed] [Google Scholar]
- [2].Jiang Y, Lev-Lehman E, Bressler J, Tsai TF, Beaudet AL, Genetics of Angelman syndrome, Am. J. Hum. Genet. 65 (1999) 1–6. [DOI] [PMC free article] [PubMed] [Google Scholar]
- [3].Lossie AC, et al. , Distinct phenotypes distinguish the molecular classes of Angelman syndrome, J. Med. Genet. 38 (2001) 834–845. [DOI] [PMC free article] [PubMed] [Google Scholar]
- [4].Meguro M, et al. , A novel maternally expressed gene, ATP10C, encodes a putative aminophospholipid translocase associated with Angelman syndrome, Nat. Genet. 28 (2001) 19–20. [DOI] [PubMed] [Google Scholar]
- [5].Bittel DC, Kibiryeva N, Talebizadeh Z, Butler MG, Microarray analysis of gene/transcript expression in Prader–Willi syndrome: deletion versus UPD, J. Med. Genet. 40 (2003) 568–574. [DOI] [PMC free article] [PubMed] [Google Scholar]
- [6].Butler MG, Thompson T, Prader–Willi syndrome: clinical and genetic findings, Endocrinology 10 (2000) 35–165. [DOI] [PMC free article] [PubMed] [Google Scholar]
- [7].Cassidy SB, et al. , Comparison of phenotype between patients with Prader–Willi syndrome due to deletion 15q and uniparental disomy 15, Am. J. Med. Genet 68 (1997) 433–440. [PubMed] [Google Scholar]
- [8].Dykens EM, Are jigsaw puzzle skills ‘spared’ in persons with Prader–Willi syndrome? J. Child Psychol. Psychiatry 43 (2002) 343–352. [DOI] [PubMed] [Google Scholar]
- [9].Dykens EM, Cassidy SB, King BH, Maladaptive behavior differences in Prader–Willi syndrome due to paternal deletion versus maternal uniparental disomy, Am. J. Ment. Retard. 104 (1999) 67–77. [DOI] [PubMed] [Google Scholar]
- [10].Roof E, Stone W, MacLean W, Feurer ID, Thompson T, Butler MG, Intellectual characteristics of Prader–Willi syndrome: comparison of genetic subtypes, J. Intellect. Disabil. Res. 44 (Pt 1) (2000) 25–30. [DOI] [PMC free article] [PubMed] [Google Scholar]
- [11].Meguro M, et al. , Large-scale evaluation of imprinting status in the Prader–Willi syndrome region: an imprinted direct repeat cluster resembling small nucleolar RNA genes, Hum. Mol. Genet. 10 (2001) 383–394. [DOI] [PubMed] [Google Scholar]
- [12].Lee S, Wevrick R, Identification of novel imprinted transcripts in the Prader–Willi syndrome and Angelman syndrome deletion region: further evidence for regional imprinting control, Am. J. Hum. Genet. 66 (2000) 848–858. [DOI] [PMC free article] [PubMed] [Google Scholar]
- [13].Nicholls RD, Knepper JL, Genome organization, function, and imprinting in Prader–Willi and Angelman syndromes, Annu. Rev. Genom. Hum. Genet. 2 (2001) 153–175. [DOI] [PubMed] [Google Scholar]
- [14].Chai JH, et al. , Identification of four highly conserved genes between breakpoint hotspots BP1 and BP2 of the Prader–Willi/Angelman syndromes deletion region that have undergone evolutionary transposition mediated by flanking duplicons, Am. J. Hum. Genet. 73 (2003) 898–925. [DOI] [PMC free article] [PubMed] [Google Scholar]
- [15].Rainier S, Chai JH, Tokarz D, Nicholls RD, Fink JK, NIPA1 gene mutations cause autosomal dominant hereditary spastic paraplegia (SPG6), Am. J. Hum. Genet. 73 (2003) 967–971. [DOI] [PMC free article] [PubMed] [Google Scholar]
- [16].Butler MG, Bittel DC, Kibiryeva N, Talebizadeh Z, Thompson T, Behavioral differences among subjects with Prader–Willi syndrome and type I or type II deletion and maternal disomy, Pediatrics 113 (2004) 565–573. [DOI] [PMC free article] [PubMed] [Google Scholar]
- [17].Churchill GA, Fundamentals of experimental design for cDNA microarrays, Nat. Genet. 32 Suppl (2002) 490–495. [DOI] [PubMed] [Google Scholar]