Evaluating probabilistic forecasts in the context of a real-time public health surveillance system is a complicated business. We agree with Bracher’s (1) observations that the scores established by the US Centers for Disease Control and Prevention (CDC) and used to evaluate our forecasts of seasonal influenza in the United States are not “proper” by definition (2). We thank him for raising this important issue.
A key advantage of proper scoring is that it incentivizes forecasters to provide their best probabilistic estimates of the fundamental unit of prediction. In the case of the FluSight competition targets, the units are intervals or bins containing dates or values representing influenza-like illness (ILI) activity. A forecast assigns probabilities to each bin.
During the evolution of the FluSight challenge, the organizers at CDC made a conscious decision to use a “moving window” or “multibin” score that rewards forecasts for assigning substantial probability to values within a window of the eventually observed value. This decision was driven by the need to find a balance between 1) strictly proper scoring and high-resolution binning (e.g., at 0.1% increments for ILI values) and 2) the need for coarser categorizations for communication and decision-making purposes. Because final observations from a surveillance system are only estimates of an underlying “ground truth” measure of disease activity, a wider window for evaluating accuracy was considered. In the end, CDC elected to allow nearby “windows” of the truth to be considered accurate (e.g., within ±0.5% of the observed ILI value), understanding that there was a downside to not using a proper score.
Given the increasing visibility and public availability of infectious disease forecasts, such as those from the FluSight challenge (3), forecasts are being used and interpreted for multiple purposes by more end users than when the challenge was originally conceived. Using a proper logarithmic score would require that forecasts be evaluated at a fixed resolution, e.g., for prespecified bins of 0.1% or 0.5%. Even if forecasts were optimized for and formally evaluated at one specific resolution, this use would not preclude the transformation of forecast outputs to a variety of resolutions appropriate for the specific decision or communication. Therefore, Bracher’s (1) letter raises an interesting and timely question about whether to institute a proper scoring rule for evaluating these public health forecasts.
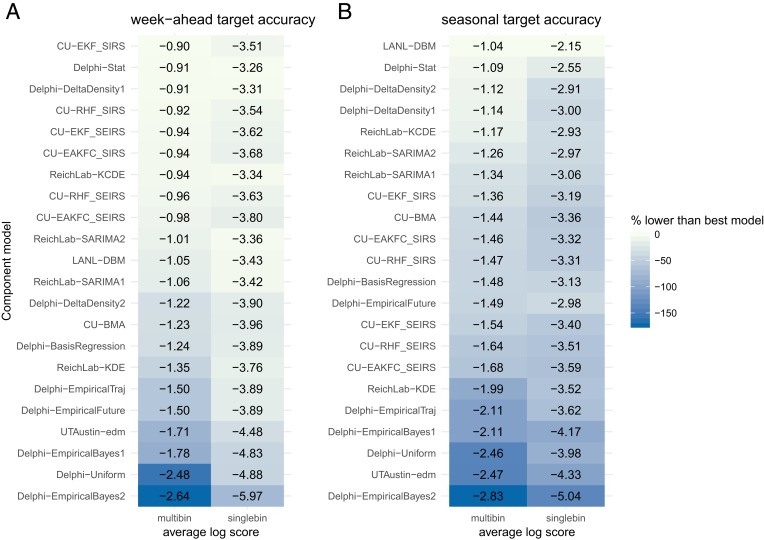
Regarding the impact of the impropriety of the score on the results in our original paper, we confirm that none of the forecasts presented in our original paper were manipulated in the way that Bracher shows is possible (4). Furthermore, evaluating forecasts by the proper logarithmic score metric does not substantially change the quality of the component models relative to each other (Fig. 1).
Fig. 1.
(A and B) Average logarithmic scores for all component models, shown separately for week-ahead targets (A) and seasonal targets (B). The component models are sorted with the best model according to the multibin score at the top for each panel separately. Within each panel, Left column shows the average log score calculated using the improper multibin rule and Right column shows the average log score calculated using the proper single-bin rule. The color coding indicates the percentage by which the given model is lower in score than the best model (darker colors indicate a larger difference from the best model within each column). Of the top 10 most accurate models according to the multibin scoring rule for both week-ahead and seasonal targets, 8 are in the top 10 according to single-bin scoring.
Bracher’s (1) letter contributes to an existing and robust dialogue among quantitative modelers and public health decision makers about how to meaningfully evaluate probabilistic forecasts and support effective real-time decision making. We welcome this ongoing public discussion of both scientific and public policy considerations in the evaluation of forecasts.
Acknowledgments
The findings and conclusions in this reply are those of the authors and do not necessarily represent the official position of the Centers for Disease Control and Prevention.
Footnotes
Conflict of interest statement: J.S. and Columbia University disclose partial ownership of SK Analytics.
References
- 1.Bracher J., On the multibin logarithmic score used in the FluSight competitions. Proc. Natl. Acad. Sci. U.S.A. 116, 20809–20810 (2019). [DOI] [PMC free article] [PubMed] [Google Scholar]
- 2.Gneiting T., Raftery A. E., Strictly proper scoring rules, prediction and estimation. J. Am. Stat. Assoc. 102, 359–378 (2007). [Google Scholar]
- 3.US Centers for Disease Control and Prevention , FluSight: Flu Forecasting (2019). https://www.cdc.gov/flu/weekly/flusight/index.html. Accessed 7 August 2019.
- 4.Reich N. G., et al. , A collaborative multiyear, multimodel assessment of seasonal influenza forecasting in the United States. Proc. Natl. Acad. Sci. U.S.A. 116, 3146–3154 (2019). [DOI] [PMC free article] [PubMed] [Google Scholar]


