The FluSight challenges (1) represent an outstanding collaborative effort and have “pioneered infectious disease forecasting in a formal way” (ref. 2, p. 2803). However, I wish to initiate a discussion about the employed evaluation measure.
The competitions feature discrete or discretized targets related to the US influenza season. E.g., for the peak timing , a forecast distribution consists of probabilities for the wk of the season. Such forecasts can be evaluated using the log score (3, 4)
where is the observed value. This score is strictly proper; i.e., its expectation is uniquely maximized by the true distribution of . In the FluSight competitions the logS is applied in a multibin version,
to measure “accuracy of practical significance” (ref. 1, p. 3153). Depending on the target, is either 1 or 5. Following the competitions, this score has become widely used (5–10), even though as also mentioned in ref. 1, it is improper. This may be problematic as improper scores incentivize dishonest forecasts. Assume and
| [1] |
i.e., probability 0 for the extreme categories. Now define a “blurred” distribution with
| [2] |
where for and and Eq. 1 ensures . This implies
i.e., the MBlogS is essentially the logS applied to a blurred version of . To optimize the expected MBlogS under their true belief , forecasters should therefore not report , but a sharper forecast so that the blurred version (with derived from as in Eq. 2) is close or equal to . This follows from the propriety of the logS. An optimal is found by maximizing with respect to .
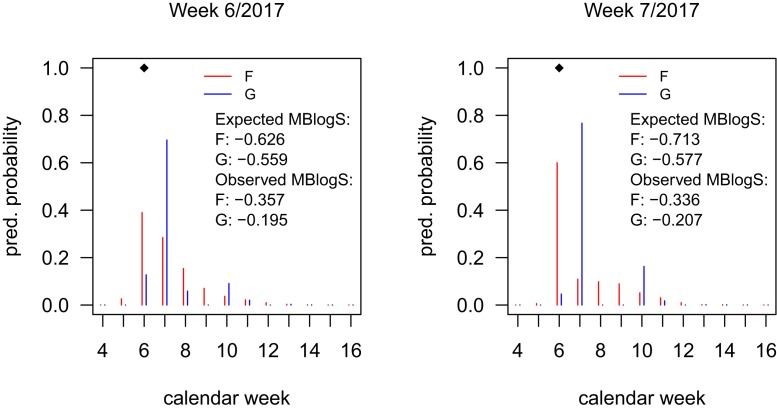
This optimal can differ considerably from the original , as Fig. 1 shows for forecasts of the 2016 to 2017 national-level peak timing by the Los Alamos National Laboratory (LANL) team (9) (downloaded from https://github.com/FluSightNetwork/cdc-flusight-ensemble/). The optimized s (with ) often have their mode shifted by 1 wk and tend to be multimodal, even for unimodal . Averaged over the 2016 to 2017 season they yield improved MBlogS for the peak timing (−0.434 vs. −0.484). This illustrates that the MBlogS may be gamed, even though we strongly doubt participants have tried to. The logS, like any other proper score, could avoid such pitfalls.
Fig. 1.
Forecasts for the peak week, submitted by the LANL team in weeks 6 to 7, 2017, and optimized versions . Diamonds mark the observed peak week. Expected scores are computed under .
Acknowledgments
I thank T. Gneiting for helpful discussions and the FluSight Collaboration for making its forecasts publicly available.
Footnotes
The author declares no conflict of interest.
References
- 1.Reich N. G., et al. , A collaborative multiyear, multimodel assessment of seasonal influenza forecasting in the United States. Proc. Natl. Acad. Sci. U.S.A. 116, 3146–3154 (2019). [DOI] [PMC free article] [PubMed] [Google Scholar]
- 2.Viboud C., Vespignani A., The future of influenza forecasts. Proc. Natl. Acad. Sci. U.S.A. 116, 2802–2804 (2019). [DOI] [PMC free article] [PubMed] [Google Scholar]
- 3.Gneiting T., Raftery A. E., Strictly proper scoring rules, prediction, and estimation. J. Am. Stat. Assoc. 102, 359–378 (2007). [Google Scholar]
- 4.Held L., Meyer S., Bracher J., Probabilistic forecasting in infectious disease epidemiology: The 13th Armitage lecture. Stat. Med. 36, 3443–3460 (2017). [DOI] [PubMed] [Google Scholar]
- 5.Brooks L. C., Farrow D. C., Hyun S., Tibshirani R. J., Rosenfeld R., Nonmechanistic forecasts of seasonal influenza with iterative one-week-ahead distributions. PLoS Comput. Biol. 14, 1–29 (2018). [DOI] [PMC free article] [PubMed] [Google Scholar]
- 6.Kandula S., et al. , Evaluation of mechanistic and statistical methods in forecasting influenza-like illness. J. R. Soc. Interface 15, 20180174 (2018). [DOI] [PMC free article] [PubMed] [Google Scholar]
- 7.Kandula S., Shaman J., Near-term forecasts of influenza-like illness: An evaluation of autoregressive time series approaches. Epidemics 27, 41–51 (2019). [DOI] [PubMed] [Google Scholar]
- 8.McGowan C. J., et al. , Collaborative efforts to forecast seasonal influenza in the United States, 2015–2016. Sci. Rep. 9, 683 (2019). [DOI] [PMC free article] [PubMed] [Google Scholar]
- 9.Osthus D., Gattiker J., Priedhorsky R., Del Valle S. Y., Dynamic Bayesian influenza forecasting in the United States with hierarchical discrepancy (with discussion). Bayesian Anal. 14, 261–312 (2019). [Google Scholar]
- 10.Osthus D., Daughton A. R., Priedhorsky R., Even a good influenza forecasting model can benefit from internet-based nowcasts, but those benefits are limited. PLoS Comput. Biol. 15, 1–19 (2019). [DOI] [PMC free article] [PubMed] [Google Scholar]


