FIGURE 5.
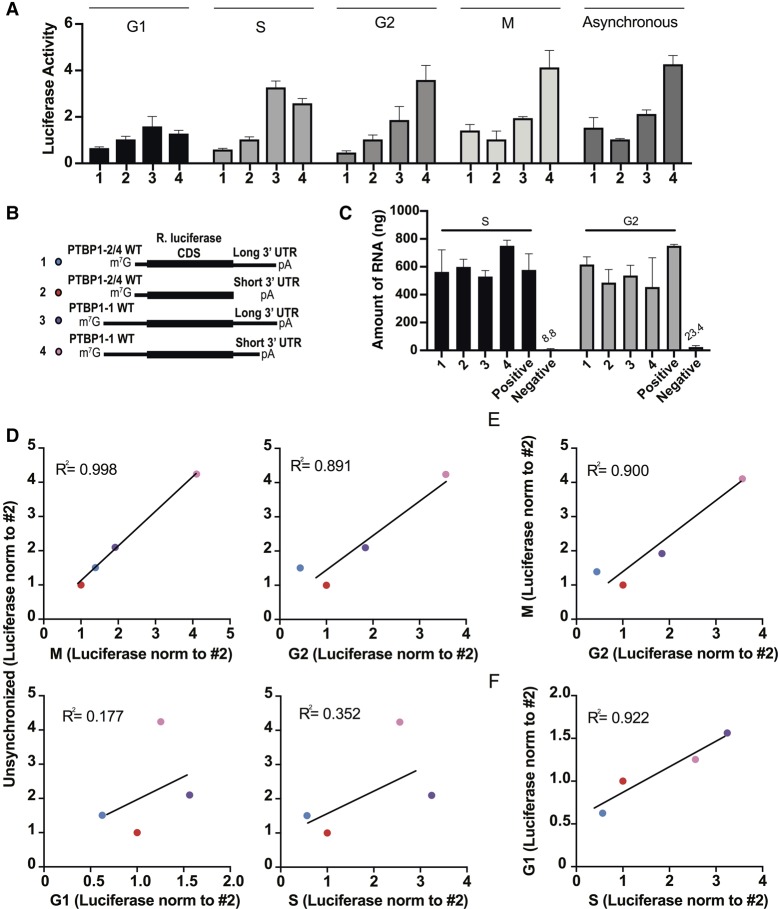
Translation profile of luciferase reporters with PTBP1 5′-UTR and 3′-UTR elements in different phases of the cell cycle. (A) Luciferase reporter readout for the experiments as diagrammed in Figure 4. All experiments were carried out in biological triplicate, with standard deviations shown. (B) Schematics of the luciferase reporters, with PTBP1 5′-UTR and 3′-UTR elements. (C) Determination of mRNA stability during the timecourse of the transfection experiment (6 h). We used the PSMB6 5′-UTR and short random 3′-UTR as positive control and water transfection as a negative control for background. (D) Luciferase activity from transcripts from the G1, S, G2, and M experiments in Figure 4A plotted against a mixed population of untreated cells. (E) Luciferase activity from transcripts from the M experiment in Figure 4A plotted against the G2 phase experiment in Figure 4A. (F) Luciferase activity from transcripts from the G1 experiment in Figure 4A plotted against the S phase experiment in Figure 4A. In panels A–F, transcripts are numbered according to the schematic in Figure 5B. In all panels, the experiments were carried out in biological triplicate, with standard deviations shown.

