INTRODUCTION
Nonsyndromic craniosynostosis (NSC) has an incidence as high as 0.4 to 1 per 1000 live births, with sagittal synostosis accounting for the highest percentage of cases.1,2 In recent years, the rates of metopic synostosis have risen for unknown reasons, and have overtaken unilateral coronal synostosis as the second most common form of NSC.2-4 Depending on the suture that has prematurely fused, calvarial growth is affected in predictable patterns that lead to aberrant changes in head shape.5
It has been unclear, however, how these calvarial and skull base changes affect neurodevelopment. In the past, restrictions in cranial development during periods of rapid brain growth were believed to damage the brain through local increases in intracranial pressure (ICP).6 In early studies, there appeared to be a correlation between cognitive performance and the type of head shape; patients with multiple fused sutures had greater impairments, and worse intellectual outcome correlated with ICP changes for certain head shapes but not others.7 Other studies could not show that surgery had a significant effect on mental development, which supported the belief that surgical correction of NSC was primarily cosmetic.8 A limitation to understanding the functional sequelae of craniosynostosis is that few tests exist for infant neurocognitive testing, and several of the early studies focused on methods that have been demonstrated to be poor predictors of future cognitive impairment.9
In recent years, adolescent testing has begun to elucidate the neurocognitive effects of NSC with improved granularity. While there may not be dramatic intellectual impairments in these patients, there are subtle, long-term neurocognitive deficits such as learning disorders and behavioral problems.10-14 In one cohort of sagittal synostosis patients, up to 50% had a learning disorder, which is diagnosed in the setting of normal intellectual quotient.10 Other studies have found that NSC patients perform worse than typically-developing controls on neurocognitive testing, particularly in math achievement and full-scale intelligence quotient.11 In addition to achievement, several studies have sought to characterize executive function and behavior in NSC patients; however, these studies are limited to using parental and clinician questionnaires.13-15 In general, NSC patients have higher rates of documented behavioral issues compared to controls, with SSO patients having less impairment.13,14
Despite these known aberrations, there has been no conclusive evidence to date about the neurologic loci of this dysfunction. Functional magnetic resonance imaging (fMRI) is an imaging modality with capabilities of spatially localizing brain activity and connectivity under various states.16 Functional MRI operates by characterizing the hemodynamic response, or blood-oxygen-level-dependent (BOLD) contrast signal, at each voxel in the brain for different neural states, including the resting state. By examining the resting brain in a task-independent setting, fMRI can identify how different regions of the brain fluctuate in BOLD contrast signal in patients with craniosynostosis compared to controls. Additionally, by performing these tests in adolescents, this form of study can understand how functional connectivity is affected in the long term.
Alterations in resting-state intrinsic connectivity have been previously found in nonsyndromic sagittal synostosis patients.17 These include decreased activation differences in the left angular gyrus and left superior parietal lobule (Brodmann’s Areas (BA) 7, 39, and 40), as well as increased activation differences in the cerebellum and medial frontal cortex (BA 8) in patients compared to controls. This previous study, however, used a more liberal threshold of p < 0.1 and cluster size (k = 150).17 Since that study, there has been a paradigm shift in how to best process clusterwise inference data for neuroimaging.18 The previously used parametric methods of cluster correction tended to have increased rates of false positives, while newer methods based on nonparametric permutation tests can best control for these false positives.18 The aim of this study is to determine if there are long-term functional connectivity changes in patients with nonsyndromic sagittal synostosis, right unilateral coronal synostosis, and metopic synostosis using a nonparametric permutation method for cluster correction.
MATERIALS AND METHODS
This was an IRB-approved prospective cohort study. Patients (7-15 years old) with nonsyndromic sagittal synostosis (SSO), right unilateral coronal synostosis (UCS), and metopic synostosis (MSO) were recruited from the Yale Craniofacial Center, and typically-developing controls were recruited at the Yale Child Study Center. The subgroup of severe metopic synostosis (SMS) was determined based on the degree of deformity of the endocranial bifrontal angle (EBA).19 To calculate the EBA, CT-DICOM data was retrieved for preoperative CT scans for all patients with metopic synostosis. Patients without available CT imaging were excluded from the SMS subgroup. Three-dimensional reconstruction of the CT-DICOM data was performed in Materialise Mimics 20.0 (Leuven, Belgium). The EBA was then calculated at the level of the most superior point of the crista galli, with the vertex of the angle located at the midline of the endocranial side of the frontal bone, and the end points at the lateral border of the orbital aperture on each side. Patients with an EBA of less than 124 degrees were included in the SMS subgroup, as used in previous literature.3,19
Craniosynostosis patients were individually matched to controls by age, gender, and handedness. All test subjects underwent magnetic resonance imaging in a 3T Siemens TIM Trio scanner (Erlangen, Germany) with a 32-coil polarized head coil. Subjects were awake in the scanner and underwent a localizing scan, an MP-RAGE scan for anatomical detail (160 slices, 1.0 mm thick, FOV 256 mm, TR 1900 msec, TE 2.96 msec), and then resting state functional MRI (34 slices, 4.0 mm thick, FOV 220 mm, matrix size 64 × 64) using a T1-weighted sequence (TR 270 msec, TE 2.46 msec, FOV 220 mm, matrix size 256 × 256, flip angle 60 degrees). Resting state fMRI was acquired in a dark room isolated from any visual or auditory distractions to minimize aberrant stimuli. Subjects wore ear plugs and noise-cancelling headphones and were instructed to focus on a black digital display with a 1-inch white plus sign visible inside the scanner. Test subjects were able to understand directions and staff ensured that subjects were not asleep or moving during scans. After the scan, subjects with gross neuroanatomical aberrations were excluded from analysis. All scans were individually inspected for head motion and underwent nuisance regression with three translation and three rotation motion parameters using SPM (University College London) to correct for small movements. Data then underwent cerebrospinal fluid and white matter signal regression and was registered to Montreal Neurological Institute (MNI) space. Group degree analysis was used to generate output correlation maps, which were then smoothed to account for individual differences in registration and localization. BioImage Suite (Yale School of Medicine) was then used to analyze whole-brain intrinsic connectivity by generating four-dimensional group outputs for each cohort. These resulting group-level t-maps were cluster-corrected using nonparametric permutation tests in FSL (FMRIB, Oxford, UK) with up to 5000 permutations.20 Cluster-based thresholding was corrected for multiple comparisons by using the null distribution of the maximum cluster size with a voxel-level threshold of p<0.05. This then generated corrected p-value maps, and significance was set to alpha equals 0.05. MNI coordinates of areas with significant findings were converted to Brodmann Areas based on a previously-defined atlas.21,22 Figures were generated by visualizing corrected p-value maps in BioImage Suite, with white-colored overlays representing areas that have altered intrinsic connectivity in patients compared to controls. P-values were generated by recording the lowest-possible threshold that would show a difference in intrinsic connectivity in the corrected p-value map.
Next, a region-of-interest (ROI) analysis was performed for seeds based on left hemisphere Brodmann Areas (BA) 7, 39, and 40. These regions were selected for their involvement in language processing and visuomotor attention, as well as their suggested implication in NSC in previous literature.17 The ROIs were generated in MNI space in accordance with previous studies.17 Analysis was then conducted as above with intrinsic connectivity.
RESULTS
Twenty-four participants with surgically-treated NSC (11 SSO, 7 UCS, 6 MSO) were scanned. One MSO patient and one UCS patient were excluded because they could not be appropriately matched to same-handed controls. Another UCS patient was excluded after a hematoma was found upon completing the MRI. The majority of the unicoronal synostosis population seen at Yale Craniofacial Clinic during this study period were right unicoronal synostosis patients, similar to previous reports.2 As a result, this study only examined right-sided synostosis for the UCS group. One SSO patient was excluded after an arachnoid cyst was found on the MRI. In total, twenty patients (10 SSO, 5 UCS, 5 MSO) were included in the study, and demographics for cases and matched controls are shown in Table 1. Patients were between 10-12 years of age, and all subjects were right-handed. Three MSO patients had EBAs that were classified into the SMS subgroup, which had an average EBA of 116.77±1.53 degrees.
Table 1.
Patient Demographics
| Group | n | Gender | Average Age |
|---|---|---|---|
| Sagittal Synostosis (SSO) | 10 | 8 M, 2 F | 11.9 years |
| SSO Matched Controls | 10 | 8 M, 2 F | 12.6 years |
| Right Unilateral Coronal Synostosis (UCS) | 5 | 4 M, 1 F | 11.9 years |
| UCS Matched Controls | 5 | 4 M, 1 F | 11.9 years |
| Metopic Synostosis (MSO) | 5 | 3 M, 2 F | 10.8 years |
| MSO Matched Controls | 5 | 3 M, 2 F | 11.1 years |
| Severe Metopic Synostosis (SMS) | 3 | 3 M, 0 F | 10.2 years |
| SMS Matched Controls | 3 | 3 M, 0 F | 10.4 years |
Intrinsic Connectivity
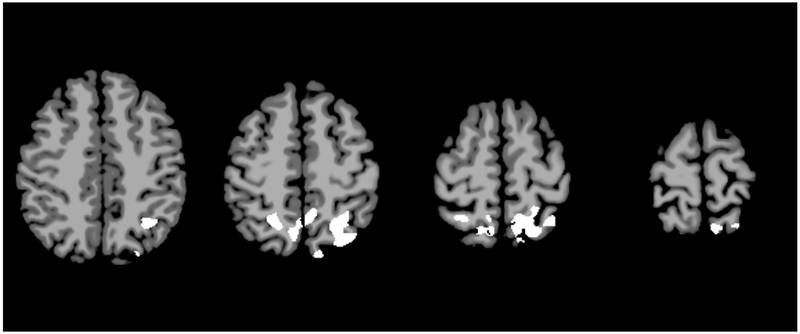
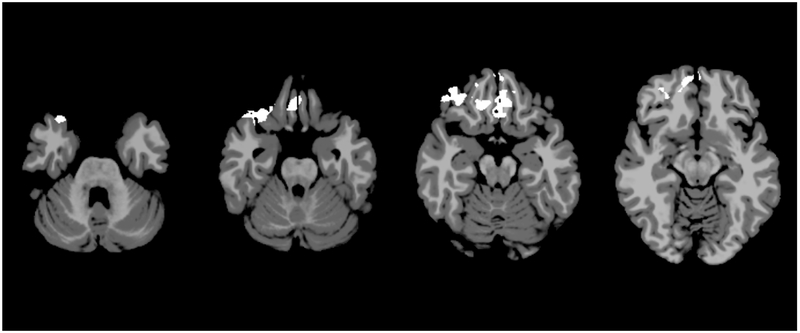
On intrinsic connectivity analysis, SSO patients demonstrated areas of decreased connectivity compared to controls. Notably, these areas were localized in the bilateral Brodmann Areas 7, which are the superior parietal lobules, and the left BA-39, which is the angular gyrus component of the inferior parietal lobule (Figure 1, p=0.071, not statistically significant). The UCS patients also demonstrated areas of decreased connectivity, primarily in the bilateral BA-11, right BA-38, and right BA-47 (Figure 2, p=0.031). BA-11 is the orbitofrontal cortex, which is the medioventral portion of the frontal lobe. BA-38 is the temporal pole, or the most anterior point of the temporal lobe. BA-47 is a portion of the inferior frontal gyrus located next to BA-11 and the orbitofrontal cortex. The MSO patients did not demonstrate any significant areas of altered connectivity up to a threshold of alpha equals 0.100.
Figure 1.
Intrinsic connectivity analysis for sagittal synostosis patients. Axial slices represent MNI z=46, 54, 62, and 70. White areas represent areas of decreased activation in SSO subjects compared to controls (p=0.071, not statistically significant).
Figure 2.
Intrinsic connectivity analysis for right unilateral coronal synostosis patients. Axial slices represent MNI z=−31, −25, −19, and −13. White areas represent areas of significantly decreased activation in UCS subjects compared to controls (p=0.031).
Left Brodmann Area 7 Seed
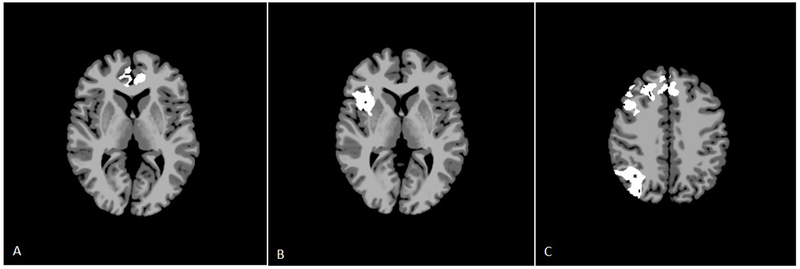
On seed-based analysis, the left BA-7 region of interest did not demonstrate any changes in connectivity in SSO at an alpha of 0.100. The UCS patients demonstrated areas of increased connectivity with the left BA-7 seed (Figure 3a). These areas included the right BA-8, left BA-24, bilateral BA-10, bilateral BA-11, and bilateral BA-32 (p=0.065, not statistically significant). BA-8 is a portion of the prefrontal cortex, BA-24 is a part of the anterior cingulate gyrus, BA-10 is the anteriormost portion of the prefrontal cortex, and BA-32 surrounds the outside of the anterior cingulate gyrus.
Figure 3.
a.Seed-based analysis for right unilateral coronal synostosis patients for the left BA-7 seed. Axial slice represents MNI z=4. White areas represent areas of increased connectivity with the BA-7 seed in UCS subjects compared to the same regions in controls (p=0.065, not statistically significant).
b. Seed-based analysis for metopic synostosis patients for the left BA-7 seed. Axial slice represents MNI z=3. White areas represent areas of increased connectivity with the BA-7 seed in MSO subjects compared to the same regions in controls (p=0.090, not statistically significant).
c. Seed-based analysis for right unilateral coronal synostosis patients for the left BA-40 seed. Axial slice represents MNI z=40. White areas represent areas of increased connectivity with the BA-40 seed in UCS subjects compared to the same regions in controls (p=0.050, except in * where p=0.077).
MSO patients also demonstrated areas of increased connectivity with right BA-44, right BA-45, the right insula, the right putamen, right BA-22, and right BA-47; however, these differences were observed at p=0.090 (not statistically significant, Figure3b). Brodmann Areas 44 and 45 are parts of the inferior frontal gyrus, which comprise Broca’s area in the dominant hemisphere. BA-22 is part of the superior temporal gyrus.
Left Brodmann Area 39 Seed
The left BA-39 seed did not demonstrate significantly altered connectivity in any group up to an alpha of 0.100.
Left Brodmann Area 40 Seed
The left BA-40 seed did not demonstrate altered connectivity in the SSO or MSO groups up to an alpha of 0.100. In the UCS patients, there was increased connectivity between this region and several areas, including bilateral BA-6, bilateral BA-8, bilateral BA-9, left BA-32 (p=0.050, statistically significant), and right BA-7 and right BA-39 (p=0.077, not statistically significant, Figure 3c). BA-6 is the premotor cortex, and BA-9 contributes to the dorsolateral and medial prefrontal cortices.
Severe Metopic Synostosis Subgroup
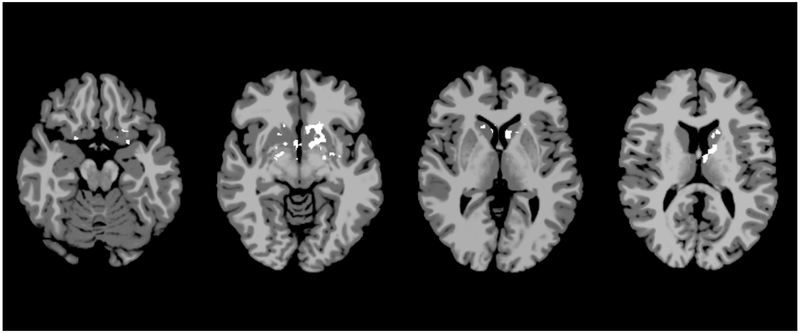
On intrinsic connectivity analysis, the SMS subgroup demonstrated several areas with significantly decreased intrinsic connectivity (Figure 4). These were primarily localized in the bilateral caudate lobes, the left thalamus, the left putamen, the left insula, and the right hypothalamus (p=0.041). For the region of interest analysis, the left BA-7 seed demonstrated significant areas of decreased connectivity throughout the left hemisphere, including BA-6, 8, 9, 10, 20, 21, 22, 44, 45, 46, 47, as well as the bilateral fusiform gyri, the right hippocampus, and the right parahippocampus (p=0.050, Figure 5). The left BA-39 seed also demonstrated significant areas of decreased connectivity with the bilateral caudate lobes, the bilateral hypothalami, the left thalamus, the left putamen, and the left amygdala (p=0.050, Figure 5). Finally, the left BA-40 seed had decreased connectivity with the bilateral visual association cortices and the bilateral primary visual cortices, the right BA-19, 20, 23, 31, the fusiform gyrus, and the parahippocampus (p=0.100, not statistically significant, Figure 5).
Figure 4.
Intrinsic connectivity analysis for severe metopic synostosis patients. Axial slices represent MNI z=−18, −8, 2, and 12. White areas represent areas of significantly decreased activation in SMS subjects compared to controls (p=0.041).
Figure 5.
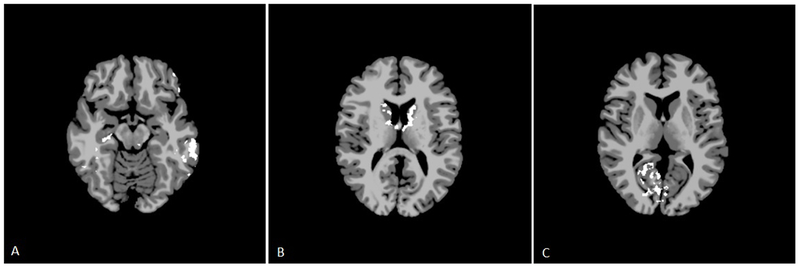
Seed-based analysis for severe metopic synostosis for the (a) left BA-7 seed (slice represents MNI z=−15, with white representing areas of significantly decreased connectivity with the BA-7 seed in SMS subjects compared to the same regions in controls at p=0.050), (b) left BA-39 seed (slice represents MNI z=13, with white representing areas of significantly decreased connectivity with the BA-39 seed in SMS subjects compared to the same regions in controls at p=0.050), and (c) left BA-40 seed (slice represents MNI z=7, with white representing areas of decreased connectivity with the BA-40 seed in SMS subjects compared to the same regions in controls at p=0.100, not significant).
DISCUSSION
Recent neurocognitive studies have identified various deficits in patients with NSC. SSO patients have been shown to have visuospatial defects, visual memory recall deficits, and attention deficits.12 Additionally, UCS patients have been found to have issues with verbal fluency and language, working memory, and also visuo-attention skills.11,12 Given findings such as these, neuroimaging studies are required to understand the etiopathogenesis of these changes.
Previously, significant white matter tract aberrations have been observed in syndromic forms of craniosynostosis.23 These findings suggest that the mutations responsible for syndromic disease may also lead to primary brain disorders that are not secondary to skull deformity or ICP.24 While mutational drivers of NSC have been elucidated in some cases, the vast majority of cases is unknown in etiology.25,26 Beckett et al. demonstrated that brain functional connectivity and white matter structure may be altered in SSO, although these results were preliminary and an expanded study is needed.17 As a result, this study is the first to identify statistically significant changes in brain functional connectivity in NSC, and that these changes vary depending on the original suture of fusion. This study additionally uses novel, nonparametric cluster-correction methods to effectively reduce the false-positive rate.18
On intrinsic connectivity analysis, the SSO cohort demonstrated decreased connectivity in the parietal lobe, in areas associated with visuomotor attention and coordination, higher-level processing and language use, and memory retrieval and attention.27-30 The UCS cohort demonstrated decreased intrinsic connectivity as well; but in contrast to the SSO patients, these changes occurred in the prefrontal cortex in areas associated with decision-making, complex behavior planning, reasoning, and social behavior.31-33 Several of these regions are involved in disorders of executive function.34 While NSC patients have been shown to have a higher rate of behavioral abnormalities compared to controls, future studies are needed to evaluate the relationship between these abnormalities and brain connectivity changes.
In this study, the MSO cohort did not demonstrate any connectivity changes. The SMS subgroup, however, had significant areas of decreased connectivity found in the insular cortex and subcortical areas such as the basal ganglia and thalamus. These subcortical structures serve as relay stations for the brain that are crucial in brain development, and connectivity changes may affect cognitive performance in early life.35-37 This further supports that the phenotype of MSO may be associated with the degree of neurocognitive impairment, which has been suggested in a previous infant study.3 This may have consequences for operative decision-making for these patients.38 It is not clear, however, whether the severity of trigonocephaly directly impacts neurocognitive outcome, or if primary genetic factors separately govern both phenotype and neurocognitive outcome.
Resting-state fMRI provides a baseline for understanding how the brain is affected in the absence of stimulus, but future studies will need to assess these patients using task-based fMRI paradigms. These may include spatial memory tasks and a go/no-go task to study attention, visuospatial processing, and behavioral inhibition.33 These paradigms can analyze how the brain is affected in settings that are relevant to real-world situations and academic achievement. Not only can these studies be used to correlate with results from neurocognitive testing studies, but may also provide specific information that cannot be fully captured by questionnaires. This resting-state study provides the first baseline analysis of connectivity changes in NSC, and can serve as a comparison for future task-based studies.
Recent infant neuroimaging studies have suggested that many neuropsychiatric diseases may have origins in utero, while the developing brain is still highly plastic.35,39 In fact, early changes in functional connectivity have been correlated with early measures of cognitive performance.36,37 Because of the relative clinical novelty of fMRI, there are no preoperative scans available to serve as an internal longitudinal comparison for these adolescent patients, which is a limitation of this study. Additionally, because brain networks are not fully mature in infancy, preoperative fMRI data may not serve as an adequate baseline for adolescent scans. However, with recent developments in building longitudinal fMRI libraries from infancy into adulthood, there may be data that can serve as an appropriate comparison for future fMRI studies on infants with craniosynostosis.40,41 Parcellation of the infant brain for fMRI is still not fully delineated; but it is known that the infant brain undergoes dramatic, non-linear developmental changes in local subdivision.42 Specifically, while primary networks may already be developed in infancy, higher order networks have not yet finished development in neonatal life.41 In addition to the maturation of higher order networks, synaptic pruning in infancy leads to the reorganization of existing brain networks, which further complicates comparison studies in infants.35,43 Because of these drastic developmental changes and the current understanding of the field, adult and infant fMRI data cannot be directly compared. While it is ideal to use adolescent patients with untreated NSC as comparisons, this is not feasible. As a result, this study used age-, gender-, and handedness-matched typically-developing controls as comparisons.
Another limitation of this study is the sample size. To account for this limitation, this study uses a rigorous subject-selection methodology and a highly conservative nonparametric cluster-correction method.18 In literature, prior parametric methods can have false-positive rates as high as 70%, while the nonparametric methods used in this study can produce the expected 5% false-positive rate.18 Despite the sample sizes, several findings in this study were highly significant at p<0.05. In the interest of developing working hypotheses for all to test against, it is appropriate to present this information to stimulate further analysis.
CONCLUSION
Through the use of functional MRI, this study provides preliminary evidence that patients with nonsyndromic craniosynostosis may have long-term alterations in their neural networks despite early surgical correction. Additionally, the changes appear to vary depending on the initial suture of fusion. Sagittal synostosis patients demonstrated nonsignificantly decreased connectivity in regions of the parietal cortex associated with spatial cognition, visuomotor integration, and attention. Right unilateral coronal patients demonstrated significantly decreased connectivity in the prefrontal cortex, which plays a crucial role in executive function. Metopic synostosis patients had no notable changes, but the severe metopic synostosis subgroup demonstrated areas with significantly decreased subcortical connectivity. While the affected regions of the brain are known to be associated with certain functions, the application of functional neuroimaging to craniofacial disease is still not a completely understood field. Additional studies are needed to further corroborate and characterize these imaging results, and to continue to test this hypothesis with larger cohorts to understand if imaging findings may underlie phenotypes of neurocognitive and behavioral impairment. By better understanding the basis for neurocognitive impairment in nonsyndromic craniosynostosis, providers may be able to better tailor both operative and other supportive management for these patients.
Acknowledgments
SOURCES OF SUPPORT:
Parts of this research were supported by grants from the American Society of Maxillofacial Surgeons and Komedyplast awarded to John Persing, MD. Alexander Sun, Carolyn Chuang and Eric Brooks received research support from the NIH Clinical Translational Science Award Multidisciplinary Pre-Doctoral Training Program in Translational Research (NIH CTSA TL1). No author has any commercial associations or financial disclosures that may create a conflict of interest with information presented in this manuscript.
REFERENCES
- 1.Patel A, Terner J, Travieso R, et al. On Bernard Sarnat’s 100th birthday: pathology and management of craniosynostosis. J Craniofac Surg. 2012;23(1):105–112. [DOI] [PubMed] [Google Scholar]
- 2.Kolar JC. An Epidemiological Study of Nonsyndromal Craniosynostoses. J Craniofac Surg. 2011;22(1):47–49. [DOI] [PubMed] [Google Scholar]
- 3.Yang JF, Brooks ED, Hashim PW, et al. The Severity of Deformity in Metopic Craniosynostosis Is Correlated with the Degree of Neurologic Dysfunction. Plast Reconstr Surg. 2017;139(2):442–447. [DOI] [PubMed] [Google Scholar]
- 4.Selber J, Reid RR, Chike-Obi CJ, et al. The changing epidemiologic spectrum of single-suture synostoses. Plast Reconstr Surg. 2008;122(2):527–533. [DOI] [PubMed] [Google Scholar]
- 5.Cunningham ML, Heike CL. Evaluation of the infant with an abnormal skull shape. Curr Opin Pediatr. 2007;19(6):645–651. [DOI] [PubMed] [Google Scholar]
- 6.Anderson FM, Geiger L. Craniosynostosis: A survey of 204 cases. J Neurosurg. 1965;22:229–240. [DOI] [PubMed] [Google Scholar]
- 7.Renier D Intracranial pressure in craniosynostosis: Pre- and postoperative recordings—Correlation with functional results In: Persing JA, ed. Scientific Foundations and Surgical Treatment of Craniosynostosis. Baltimore, Maryland: Williams & Wilkins; 1989:263–269. [Google Scholar]
- 8.Kapp-Simon KA, Figueroa A, Jocher CA, et al. Longitudinal assessment of mental development in infants with nonsyndromic craniosynostosis with and without cranial release and reconstruction. Plast Reconstr Surg. 1993;92(5):831–839; discussion 840-831. [PubMed] [Google Scholar]
- 9.Anderson PJ, Burnett A. Assessing developmental delay in early childhood - concerns with the Bayley-III scales. Clin Neuropsychol. 2017;31(2):371–381. [DOI] [PubMed] [Google Scholar]
- 10.Magge SN, Westerveld M, Pruzinsky T, et al. Long-term neuropsychological effects of sagittal craniosynostosis on child development. J Craniofac Surg. 2002;13(1):99–104. [DOI] [PubMed] [Google Scholar]
- 11.Kapp-Simon KA, Wallace E, Collett BR, et al. Language, learning, and memory in children with and without single-suture craniosynostosis. J Neurosurg Pediatr. 2016;17(5):578–588. [DOI] [PubMed] [Google Scholar]
- 12.Chieffo D, Tamburrini G, Massimi L, et al. Long-term neuropsychological development in single-suture craniosynostosis treated early. J Neurosurg Pediatr. 2010;5(3):232–237. [DOI] [PubMed] [Google Scholar]
- 13.Becker DB, Petersen JD, Kane AA, et al. Speech, cognitive, and behavioral outcomes in nonsyndromic craniosynostosis. Plast Reconstr Surg. 2005;116(2):400–407. [DOI] [PubMed] [Google Scholar]
- 14.Speltz ML, Collett BR, Wallace ER, et al. Behavioral Adjustment of School-Age Children with and without Single-Suture Craniosynostosis. Plast Reconstr Surg. 2016;138(2):435–445. [DOI] [PubMed] [Google Scholar]
- 15.Collett BR, Kapp-Simon KA, Wallace E, et al. Attention and executive function in children with and without single-suture craniosynostosis. Child Neuropsychol. 2017;23(1):83–98. [DOI] [PMC free article] [PubMed] [Google Scholar]
- 16.Logothetis NK. What we can do and what we cannot do with fMRI. Nature. 2008;453(7197):869–878. [DOI] [PubMed] [Google Scholar]
- 17.Beckett JS, Brooks ED, Lacadie C, et al. Altered brain connectivity in sagittal craniosynostosis. J Neurosurg Pediatr. 2014;13(6):690–698. [DOI] [PubMed] [Google Scholar]
- 18.Eklund A, Nichols TE, Knutsson H. Cluster failure: Why fMRI inferences for spatial extent have inflated false-positive rates. Proc Natl Acad Sci U S A. 2016;113(28):7900–7905. [DOI] [PMC free article] [PubMed] [Google Scholar]
- 19.Beckett JS, Chadha P, Persing JA, et al. Classification of trigonocephaly in metopic synostosis. Plast Reconstr Surg. 2012;130(3):442e–447e. [DOI] [PubMed] [Google Scholar]
- 20.Jenkinson M, Beckmann CF, Behrens TE, et al. FSL. Neuroimage. 2012;62(2):782–790. [DOI] [PubMed] [Google Scholar]
- 21.Lacadie CM, Fulbright RK, Constable RT, et al. More Accurate Talairach Coordinates for NeuroImaging using Nonlinear Registration. Neuroimage. 2008;42(2):717–725. [DOI] [PMC free article] [PubMed] [Google Scholar]
- 22.Lacadie C, Fulbright R, Arora J, et al. Brodmann Areas defined in MNI space using a new Tracing Tool in BioImage Suite. Paper presented at: 14th Annual Meeting of the Organization for Human Brain Mapping2008; Melbourne, Australia. [Google Scholar]
- 23.Florisson JM, Dudink J, Koning IV, et al. Assessment of white matter microstructural integrity in children with syndromic craniosynostosis: a diffusion-tensor imaging study. Radiology. 2011;261(2):534–541. [DOI] [PubMed] [Google Scholar]
- 24.Raybaud C, Di Rocco C. Brain malformation in syndromic craniosynostoses, a primary disorder of white matter: a review. Childs Nerv Syst. 2007;23(12):1379–1388. [DOI] [PubMed] [Google Scholar]
- 25.Timberlake AT, Choi J, Zaidi S, et al. Two locus inheritance of non-syndromic midline craniosynostosis via rare SMAD6 and common BMP2 alleles. Elife. 2016;5. [DOI] [PMC free article] [PubMed] [Google Scholar]
- 26.Lattanzi W, Barba M, Di Pietro L, et al. Genetic advances in craniosynostosis. Am J Med Genet A. 2017;173(5):1406–1429. [DOI] [PMC free article] [PubMed] [Google Scholar]
- 27.Caplan JB, Luks TL, Simpson GV, et al. Parallel networks operating across attentional deployment and motion processing: a multi-seed partial least squares fMRI study. Neuroimage. 2006;29(4):1192–1202. [DOI] [PubMed] [Google Scholar]
- 28.Seghier ML, Lazeyras F, Pegna AJ, et al. Variability of fMRI activation during a phonological and semantic language task in healthy subjects. Hum Brain Mapp. 2004;23(3):140–155. [DOI] [PMC free article] [PubMed] [Google Scholar]
- 29.Zarahn E, Aguirre G, D’Esposito M. Replication and further studies of neural mechanisms of spatial mnemonic processing in humans. Brain Res Cogn Brain Res. 2000;9(1):1–17. [DOI] [PubMed] [Google Scholar]
- 30.Catalan MJ, Honda M, Weeks RA, et al. The functional neuroanatomy of simple and complex sequential finger movements: a PET study. Brain. 1998;121 (Pt 2):253–264. [DOI] [PubMed] [Google Scholar]
- 31.Ernst M, Nelson EE, McClure EB, et al. Choice selection and reward anticipation: an fMRI study. Neuropsychologia. 2004;42(12):1585–1597. [DOI] [PubMed] [Google Scholar]
- 32.Rogers RD, Owen AM, Middleton HC, et al. Choosing between small, likely rewards and large, unlikely rewards activates inferior and orbital prefrontal cortex. J Neurosci. 1999;19(20):9029–9038. [DOI] [PMC free article] [PubMed] [Google Scholar]
- 33.Vollm B, Richardson P, McKie S, et al. Serotonergic modulation of neuronal responses to behavioural inhibition and reinforcing stimuli: an fMRI study in healthy volunteers. Eur J Neurosci. 2006;23(2):552–560. [DOI] [PubMed] [Google Scholar]
- 34.Arnsten AF, Li BM. Neurobiology of executive functions: catecholamine influences on prefrontal cortical functions. Biol Psychiatry. 2005;57(11):1377–1384. [DOI] [PubMed] [Google Scholar]
- 35.Gao W, Lin W, Grewen K, et al. Functional Connectivity of the Infant Human Brain: Plastic and Modifiable. Neuroscientist. 2016. [DOI] [PMC free article] [PubMed] [Google Scholar]
- 36.Alcauter S, Lin W, Smith JK, et al. Development of thalamocortical connectivity during infancy and its cognitive correlations. J Neurosci. 2014;34(27):9067–9075. [DOI] [PMC free article] [PubMed] [Google Scholar]
- 37.Ball G, Pazderova L, Chew A, et al. Thalamocortical Connectivity Predicts Cognition in Children Born Preterm. Cereb Cortex. 2015;25(11):4310–4318. [DOI] [PMC free article] [PubMed] [Google Scholar]
- 38.Anolik RA, Allori AC, Pourtaheri N, et al. Objective Assessment of the Interfrontal Angle for Severity Grading and Operative Decision-Making in Metopic Synostosis. Plast Reconstr Surg. 2016;137(5):1548–1555. [DOI] [PubMed] [Google Scholar]
- 39.Beardslee WR, Chien PL, Bell CC. Prevention of mental disorders, substance abuse, and problem behaviors: a developmental perspective. Psychiatr Serv. 2011;62(3):247–254. [DOI] [PubMed] [Google Scholar]
- 40.Gao W, Alcauter S, Elton A, et al. Functional Network Development During the First Year: Relative Sequence and Socioeconomic Correlations. Cereb Cortex. 2015;25(9):2919–2928. [DOI] [PMC free article] [PubMed] [Google Scholar]
- 41.Gao W, Alcauter S, Smith JK, et al. Development of human brain cortical network architecture during infancy. Brain Struct Funct. 2015;220(2):1173–1186. [DOI] [PMC free article] [PubMed] [Google Scholar]
- 42.Shi F, Salzwedel AP, Lin W, et al. Functional Brain Parcellations of the Infant Brain and the Associated Developmental Trends. Cereb Cortex. 2017:1–11. [DOI] [PMC free article] [PubMed] [Google Scholar]
- 43.Levitt P Structural and functional maturation of the developing primate brain. J Pediatr. 2003;143(4 Suppl):S35–45. [DOI] [PubMed] [Google Scholar]


