Abstract
Purpose:
There are several important positron emission tomography (PET) imaging scenarios that require imaging with very low photon statistics, for which both quantitative accuracy and visual quality should not be neglected. For example, PET imaging with the low photon statistics is closely related to active efforts to significantly reduce radiation exposure from radiopharmaceuticals. We investigated two examples of low-count PET imaging: a) Imaging [90Y]microsphere radioembolization that suffers the very small positron emission fraction of Y-90’s decay processes, and b) cancer imaging with [68Ga]citrate with uptake time of 3–4 half-lives, necessary for visualizing tumors. In particular, we investigated a type of penalized likelihood reconstruction algorithm, block sequential regularized expectation maximization (BSREM), for improving both image quality and quantitative accuracy of these low-count PET imaging cases.
Procedures:
The NEMA/IEC Body phantom filled with aqueous solution of Y-90 or Ga-68 was scanned to mimic the low-count scenarios of corresponding patient data acquisitions on a time-of-flight (TOF) PET/magnetic resonance imaging system. Contrast recovery, background variation, and signal-to-noise ratio were evaluated in different sets of count densities using both conventional TOF ordered subsets expectation (TOF-OSEM) and TOF-BSREM algorithms. The regularization parameter, beta, in BSREM that controls the tradeoff between image noise and resolution was evaluated to find a value for improved confidence in image interpretation. Visual quality assessment of the images obtained from patients administered with [68Ga]citrate (n = 6) was performed. We also made preliminary visual image quality assessment for one patient with [90Y]microspheres. In Y-90 imaging, the effect of 511 keV energy window selection for minimizing the number of random events was also evaluated.
Results:
Quantitatively, phantom images reconstructed with TOF-BSREM showed improved contrast recovery, background variation, and signal-to-noise ratio values over images reconstructed with TOF-OSEM. Both phantom and patient studies of delayed imaging of [68Ga]citrate show that TOF-BSREM with beta = 500 gives the best tradeoff between image noise and image resolution based on visual assessment by the readers. The NEMA-IQ phantom study with [90Y]microspheres shows that the narrow energy window (460–562 keV) recovers activity concentrations in small spheres better than the regular energy window (425–650 keV) with the beta value of 2000 using the TOF-BSREM algorithm. For the images obtained from patients with [68Ga]citrate using TOF-BSREM with beta=500, the visual analogue scale (VAS) was improved by 17% and the Likert score was increased by 1 point on average, both in comparison to corresponding scores for images reconstructed using TOF-OSEM.
Conclusion:
Our investigation shows that the TOF-BSREM algorithm improves the image quality and quantitative accuracy in low-count PET imaging scenarios. However, the beta value in this algorithm needed to be adjusted for each radiopharmaceutical and counting statistics at the time of scans.
Keywords: Low-count PET, [90Y]microspheres, [68Ga]citrate, PET, PET/MRI, regularized EM, BSREM
Introduction
Positron emission tomography (PET) requires an appropriate number of photons detected so that tomographic image generation through a reconstruction algorithm results in high-quality images. As a counting device, PET also provides the counting statistics that can be used as quantification of radiopharmaceutical distribution. However, without appropriate photon statistics, quality of images and quantitative accuracy can be reduced. For both the quality and quantitative accuracy [1], the noise property determined by photon statistics is the most important deterministic effect that needs to be controlled.
The number of photons counted for image reconstruction is significantly reduced in a couple of imaging scenarios. First, the number of photons is reduced in administration protocols designed to minimize radiation exposure from PET radiopharmaceuticals. The awareness of ionizing radiation exposure risk from PET radiopharmaceuticals is widespread, and any effort of lowering the dose, without harming the diagnostic performance of PET imaging, is highly desirable for any PET radiopharmaceuticals including the most commonly used 2-deoxy-2-[18F]fluoro-D-glucose [2–11]. Second, there are several radiopharmaceuticals that can be imaged by PET, but suffer low-counts of positron emissions because of either low positron emission branching ratio of its decay processes (such as in PET imaging of [90Y]microsphere radioembolization), or desirable delayed time-point imaging after many half-lives of radiopharmaceuticals. For example, delayed imaging of [68Ga]PSMA I&T at 3 hours postinjection showed improved lesion contrast [12].
At our institution, we paid particular attention to two representative radiopharmaceuticals in the second scenario to improve both quality and quantitative accuracy of images using a reconstruction algorithm advancement. Yttrium-90 microspheres are 20–40 μm particles that emit beta radiation, with average particle energy of 936.7 keV. The beta particles emitted during its radioactive decay have an average tissue penetration of 2.5 mm and a maximum penetration of approximately 8 mm. The physical half-life of the particles is 64.1 h (approximately 2.67 days). In addition to beta decay, its decay process includes a small internal pair production that emits positrons with the branching ratio of 3.186×10⁻⁵, which makes it a weak, but useful PET imaging agent when a large activity is used as in radioembolization. PET imaging of [90Y]microspheres is gaining in popularity as a tool to verify the targeted delivery of this therapeutic radiopharmaceutical. Gallium-68 citrate is an emerging cancer imaging agent that we have developed to measure MYC activity in tumor cells [13]. [68Ga]citrate PET imaging showed its feasibility in imaging prostate cancer [13, 14] and hepatocellular carcinoma [15]. As an iron mimetic in vivo, [68Ga]citrate binds to apo-transferrin in blood, and requires 3–4 hours to appreciably accumulate in tumor cells. Hence, this imaging scenario using [68Ga]citrate naturally presents a necessity of extremely low-count PET imaging.
Iterative reconstruction algorithms like OSEM (ordered-subsets expectation maximization) are widely used in clinical practice for PET image reconstruction; however OSEM is limited in accurately reconstructing low-count PET images such as in [90Y]microspheres and [68Ga]citrate imaging. This is because either reconstruction in an iterative loop is stopped prematurely to control image noise which results in insufficient lesion recovery, or a heavy post-filtering is applied which blurs the lesions and results in lower standardized uptake values (SUVs) [16]. On the other hand, the penalized likelihood (PL) algorithms [17], where a penalty term is added to the cost function to control the image quality, provide a better way to the tradeoff between image quality and image resolution. Here, in our investigation, we have used the block sequential regularized expectation maximization (BSREM) [18–25] reconstruction method as in the commercialized version (Q.Clear, GE Healthcare, Waukesha, WI), a type of PL algorithm which uses the relative difference penalty [26, 27] to reconstruct low-count PET images of [90Y]microspheres and [68Ga]citrate. Although the use of BSREM reconstruction for [90Y]microspheres was reported by Rowley et al. on the datasets acquired using a PET/x-ray computed tomography scanner (CT) [28], investigation of BSREM for low-count [68Ga]citrate cancer imaging has not been reported. In addition, since most of modern PET scanners (PET/CTs and PET/magnetic resonance imaging (MRI)) provide excellent time-of-flight (TOF) PET data acquisition capabilities, investigation of BSREM with TOF is appropriate; thus, all our BSREM investigations in this article are based on TOF-BSREM.
The parameter that controls the tradeoff between image noise and resolution is called beta in the BSREM algorithm. Increasing beta improves the signal-to-noise ratio (SNR) but also results in more blurring (i.e., lower resolution), and decreasing beta improves resolution but also results in lower SNR. In this investigation, in addition to applying the BSREM algorithm in low-count PET image reconstruction, we evaluated the different values of beta in image appearance in the BSREM reconstruction method for [90Y]microspheres and [68Ga]citrate PET imaging using both phantom and patient data.
Materials and Methods
Phantom data acquisition, reconstruction, and analysis
The NEMA-IQ phantom [29] containing aqueous solution of 20 MBq of [68Ga]citrate with 4:1 ratio of lesion to background was scanned for 4 hours. In order to generate multiple image frames that have similar counts to corresponding patient data with [68Ga]citrate on a PET/MRI system (SIGNA PET/MR, GE Healthcare, Waukesha, WI), 30 frames with 6 different durations (30 s, 1 min, 2 min, 4 min, and 8 min) at 5 different postinjection times (30 min, 1 h, 2 h, 3 h, and 4h postinjection) from the 4-hour long list-mode data were created. Nine frames from these 30 frames that contain the counts between 15 and 30 million (average: 22.4 million, standard deviation: 6.9 million) were selected for our analysis to match the average count (19.1 million; range: 15–30 million; standard deviation: 8 million) from all bed positions of the patient data. All nine frames of data were reconstructed using conventional TOF-OSEM algorithm with 28 subsets, 2 iterations, and spatial Gaussian filter with 4 mm and 8 mm FWHM, as well as TOFBSREM algorithm with beta values of 350, 500, 1000 and 2000.
The NEMA-IQ phantom containing aqueous solution of 1,850 MBq of [90Y]DOTATOC with the 4:1 ratio of lesion to background was scanned for 60 min twice on the same PET/MRI system using the normal 425–650 keV energy window and using the narrow 460–562 keV energy window, respectively. The narrow energy window setting was chosen as ± 10% of 511 keV. These two scans were performed consecutively with a very small time gap between them. Considering the half-life of Y-90 (64.1 h), the time difference between these two scans was negligible. For this phantom experiment, we used the fully labeled [90Y]DOTATOC aqueous solution to avoid the Y-90 containing molecules sticking to the surface of the plastic phantom as reported previously when [90Y]YCl3 was used in a phantom experiment [30]. The energy window variation was intended for investigating differences in random counts, specifically for Y-90 data acquisition. The images were reconstructed using TOF-OSEM with 28 subsets, 2 iterations, and spatial Gaussian filter with 4 mm full-width at half maximum (FWHM), as well as TOF-BSREM with beta values of 500, 1000, 2000, 4000, and 8000.
The contrast recovery (CR, measured activity concentration over true activity concentration), background variation (BV, standard deviation over mean value), and signal to noise ratio (SNR, mean over standard deviation) for each sphere inside the NEMA-IQ phantom were measured for each frame and their mean values were calculated to investigate the trend of these variables over the sizes of the spheres in phantom images.
Patient data acquisition, reconstruction, and analysis
Written consent forms were obtained according to the local Institutional Review Board prior to all human imaging studies.
Six patients (all males with histologic evidence of prostate cancer with castration-resistant disease 65.5 ± 6.2 years old, 90.3 ± 1.71 kg; body mass-index: 28.9 ± 3.6) administered with approximately 250 MBq (average: 242.35 MBq; range: 203.5–259 MBq) of [68Ga]citrate and scanned between 3.5 and 4 h (average: 3.7 h; range: 3.5–4 h) after the injection were included in our analysis investigating the quality and quantitative accuracy of the TOF-BSREM algorithm with several beta values. The scan time for [68Ga]citrate was 4–8 min per scan bed, resulting in the average of 19.1 million counts per frame (standard deviation: 8 million). The images were reconstructed using (28 subsets, 2 iterations and spatial Gaussian filter with 4 mm and 8 mm cut-off frequencies) and TOF-BSREM (with beta values of 350, 500 and 1000). All reconstructions were performed on the PET/MR scanner console. The software version was MP26. The image quality was assessed blindly by two nuclear medicine physicians (RRF and SCB) using a visual analogue scale (VAS) with the range between 0 and 100 %, and a Likert score (1-poor to 10-excellent) on screenshots generated from reconstructed patient images. The scores were all independently generated on each image set. For comparison between the reconstruction methods, VAS and Likert scores were averaged over all six patients and two reviewers.
Using the list-mode dataset from one patient administered with 3,600 MBq of [90Y]microspheres and scanned for 30 min, 20 h after the radioembolization, the images were reconstructed using with 28 subsets, 2 iterations and spatial Gaussian filter with 4 mm FWHM and TOF-BSREM with beta values of 1000, 2000 and 4000. Qualitative visual assessment was made by the two readers for a preliminary image quality evaluation on these reconstructed images.
Results
Quality and accuracy assessment of low-count Ga-68 images of phantom and patients
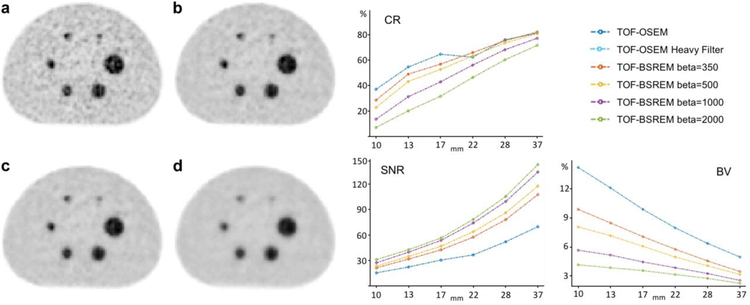
Figure 1 shows representative [68Ga]citrate NEMA-IQ phantom images reconstructed with (Fig. 1a) and (Fig. 1b–d) TOF-BSREM with beta = 350, 500 and 1000 respectively for one of the nine frames of data we analyzed. This frame was a 4 min frame, 2 h post-injection consisting of 30 million counts. The data analysis of all nine frames shows that the image noise decreases with increasing beta, at the expense of more image blurring (Fig. 1). The image reconstructed by using spatial Gaussian filter with 4 mm full-width at half maximum (FWHM) shows the largest background variation. Figure 1 also shows the average of contrast recovery (CR), background variation (BV) and signal-to-noise (SNR) ratio of all NEMA-IQ phantom spheres over the 10 frames with 15 to 30 million counts, using and TOF-BSREM reconstruction methods. As it can be seen from Fig. 1, the CR of using spatial filter with 4 mm FWHM and TOF-BSREM with beta values of 350 and 500 are very close especially for the larger spheres; however, the BV is decreased and SNR is increased in TOF-BSREM. By using a heavy spatial filter with 8 mm FWHM, the shows similar background variation to TOF-BSREM with beta = 350; however, its contrast recovery and signal-to-noise ratio are inferior compared to TOF-BSREM. TOF-BSREM with beta = 500 is picked as the preferred reconstruction method from the readers’ assessment, which gives a high contrast recovery ratio and signal-to-noise ration while lowering the background variation for all spheres, which is generally in line with our phantom data analysis on CR, SNR, and BV.
Figure 1.
NEMA-IQ phantom study with [68Ga]citrate for a frame consisting of 30 million countx a TOF-OSEM reconstruction, b–d: TOF-BSREM reconstructions with beta values of 350, 500 and 1000 respectively. The average of contrast recovery (CR), signal-to-noise ratio (SNR) and background variation (BV) curves over all 9 frames that contain 15 to 30 million counts are shown.
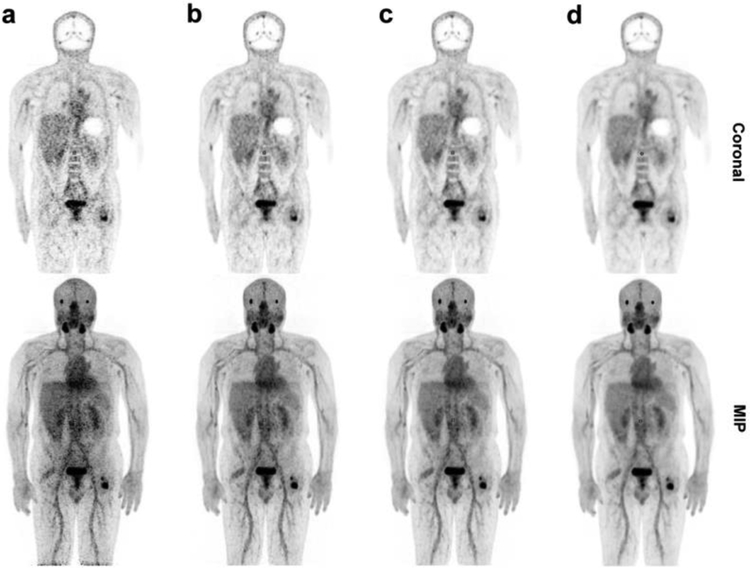
Figure 2a and b compares with 4 mm and 8 mm FWHM spatial Gaussian filter and (Fig. 2c–e) TOF-BSREM with beta = 350, 500 and 1000 reconstruction methods respectively in a patient with stable widespread bone metastatic disease. Top row shows a coronal slice and bottom row shows the coronal maximum intensity projection (MIP). As expected for a low-count PET imaging the standard using a spatial filter with 4 mm FWHM is very noisy. using spatial filter with 8 mm FWHM reduces the background noise but it also results in image blurring as it is shown by red arrows. The TOF-BSREM with beta = 500 is considered as a preferred tradeoff between background noise and image resolution from the readers’ assessment. The review of all 6 patients’ images reconstructed with using a spatial filter with 8 mm FWHM and TOF-BSREM with beta values of 350, 500, 1000, and 2000 by 2 nuclear medicine physicians showed that TOFBSREM with beta value of 500 was the best reconstruction method from qualitative VAS and Likert scoring. The visual analogue scale (VAS) by TOF-BSREM with beta = 500, was improved by 17% compared to, and the Likert score was increased by 1 point on average. On average, The SUVmean values of all lesions for TOF-BSREM with beta=500 reached 96% of same value for TOF-BSREM with beta = 350, while this value was 89% for beta=1000 and 87% for using a spatial filter with 8 mm FWHM. The summary of the readers’ assessment comparing the images reconstructed using TOF-OSEM and TOF-BSREM is provided in Table 1.
Figure 2.
Comparing a & b TOF-OSEM with 4 mm and 8 mm FWHM spatial filter respectively and c - e TOF-BSREM with beta=350, 500 and 1000 reconstruction methods respectively in a patient with stable widespread bone metastatic disease in [68Ga]citrate PET imaging. Top row shows a coronal slice and bottom row shows the coronal MIP.
Table 1.
Summary of readers’ assessment using visual analogue scale (VAS) and Likert score on [68Ga]citrate images reconstructed using TOF-OSEM and TOF-BSREM. Average and standard deviation values of SUVmean’s for liver, blood pool, and bones (right sacrem and right femur) are also shown. Average and standard deviation values of SUVmax’s are noted for all the lesions identified on images for these two reconstruction methods. For TOF-BSREM, beta values of 350, 500, and 1000 were used.
| TOF-OSEM | TOF-BSREM (b350) |
TOF-BSREM (b500) |
TOF-BSREM (b1000) |
|
|---|---|---|---|---|
| Average VAS | 54.2±1.73 | 63.8±2.19 | 71.7±1.98 | 69.6±1.63 |
| Average Likert Score (Confidence) | 6.9±1.95 | 7.8±2.70 | 8.1±2.49 | 7.9±2.21 |
| Average SUVmean of Liver | 2.92±1.72 | 3.13±2.23 | 3.14±2.22 | 3.12±2.22 |
| Average SUVmean of Blood pool | 4.16±0.67 | 3.64±1.04 | 3.62±1.03 | 3.59±1.01 |
| Average SUVmean (Osseous Right Sacrum) | 1.30±0.41 | 1.49±0.47 | 1.50±0.46 | 1.52±0.45 |
| Average SUVmean (Osseous Right Femur) | 1.21±0.73 | 1.34±1.09 | 1.32±1.03 | 1.26±0.90 |
| Average SUVmax of all lesions | 6.66±1.74 | 7.90±2.50 | 7.29±2.17 | 6.04±1.73 |
Quality and accuracy assessment of low-count Y-90 images of phantom and patient
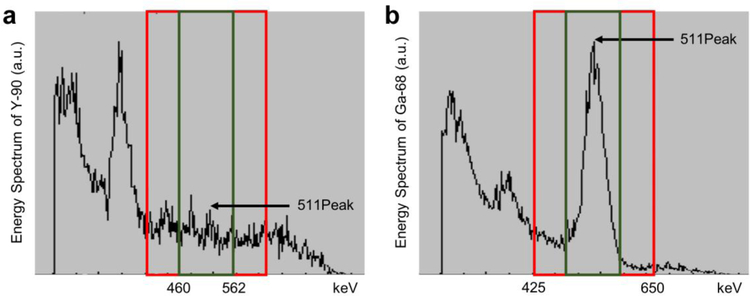
Figure 3 shows the energy spectra for Y-90 and Ga-68 (as a comparison to the Y-90 spectrum) obtained by the scanner. The 511 keV peak, which is clearly visible on Ga-68 energy spectrum, cannot be located on the Y-90 energy spectrum due to its small positron emission fraction, which is about 32 positrons per 1 MBq. The regular system energy window which is 425–650 keV on this system is shown by a red rectangle. Due to the small positron fraction of Y-90 decays, most of the recorded events with the regular energy window are random events. In order to reduce the number of random events, a new narrow energy window of 460–562 keV is defined (shown by the green rectangle), which is a 20% window around the peak (i.e. 511 ± 10%). The narrow energy window resulted in 88% reduction of random events compared to the regular energy window acquisition. The total counts were approximately 20 million and 3.7 million for the regular energy window and the narrow energy window settings, respectively. The difference between the total number of true events between the two acquisitions was only 14%.
Figure 3.
a Regular (425–650 keV) and b narrow (460–562 keV) energy windows in red and green respectively, shown over the 511 peak of energy spectrum of Y-90 and Ga-68.
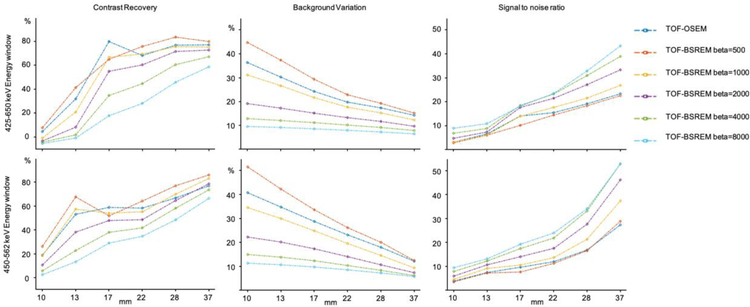
Figure 4 shows the contrast recovery, background variation, and signal-to-noise ratio of NEMA-IQ spheres for regular and narrow energy window acquisitions respectively. The regular energy window acquisition shows negative contrast recovery ratio for the 10 mm sphere with TOF-BSREM and beta >1000, which is improved substantially by using the narrow energy window. The background variation is increased for the narrow energy window, while the SNR curve is generally better than that for the regular energy window. For the wide energy window, the TOF-BSREM with beta = 1000 is considered as a preferred choice as it results in less background variation while keeping the contrast recovery ratio similar to and TOF-BSREM with beta = 500. For the narrow energy window, the TOF-BSREM with beta = 2000 is a preferred choice as it results in higher SNR while keeping the contrast recovery ratio similar to and TOF-BSREM with beta = 500 and 1000.
Figure 4.
NEMA–IQ phantom image comparison between TOF-OSEM and TOF-BSREM reconstruction methods with Y–90 using the regular (425–650 keV) and narrow (450–562 keV) energy windows. The contrast recovery (CR), signal-to-noise ratio (SNR) and background variation (BV) curves are shown.
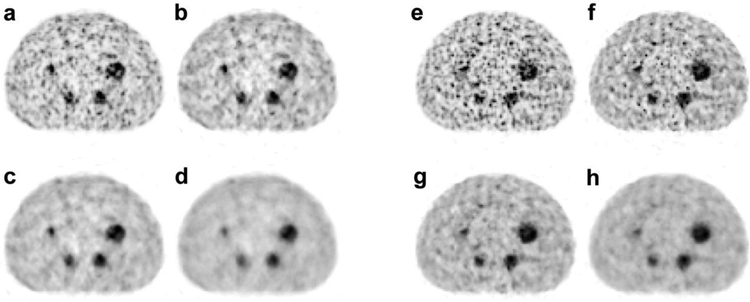
Figure 5 shows the NEMA-IQ phantom images of Y-90 study using using a spatial filter with 4 mm FWHM and TOF-BSREM with beta values of 1000, 2000, and 4000 both for regular energy window and narrow energy window acquisitions. As it can be seen from this figure, the narrow energy window improves the image resolution as it recovers the two smallest spheres i.e. 10 mm and 13 mm spheres, which cannot be observed on the regular energy window acquisition. It also confirms that the TOF-BSREM with beta = 1000 and 2000 are the preferred reconstruction methods for the regular energy window and narrow energy window acquisitions respectively.
Figure 5.
NEMA-IQ phantom study with Y-90 a – reconstruction, b–d-: TOF-BSREM reconstructions with beta values of 1000, 2000 and 4000 respectively using the regular energy window (425–650 keV). e TOF-OSEM reconstruction, f - h: TOF-BSREM reconstructions with beta values of 1000, 2000 and 4000 respectively using the narrow energy window (460–562 keV).
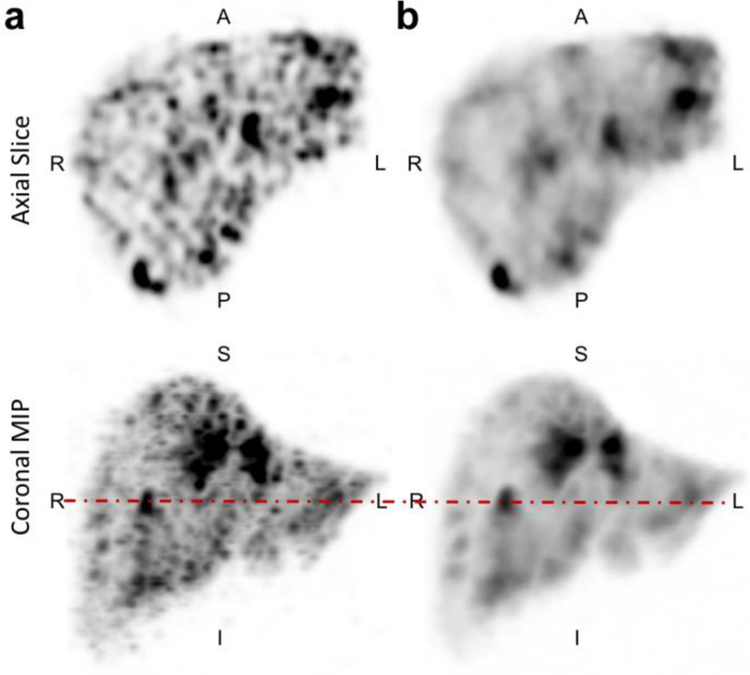
Finally, Figure 6 shows a comparison between TOF-OSEM using a spatial filter with 4 mm FWHM and TOF-BSREM with beta = 2000 reconstruction methods on a patient injected with [90Y]microspheres and demonstrates the image quality improvement by TOF-BSREM method when they were evaluated by our readers.
Figure 6.
Comparing a TOF-OSEM and b TOF-BSREM with beta=2000 reconstruction methods in a patient with liver metastasis disease. Top row shows an axial slice and bottom row shows the coronal MIP. The dashed line in the coronal MIP images is where the axial slice was taken.
Discussion
As we showed in this investigation, the TOF-BSREM algorithm with a preferred beta value provides improved quality and quantitative accuracy of the PET imaging for low-count situations of imaging [68Ga]citrate and [90Y]microspheres. In combination with efforts of improving the PET scanner sensitivity, the reconstruction algorithm implementation like this is essential to reach the best possible technology.
For the investigation of the narrow energy window (460–562 keV) of Y-90 data acquisition, the scatter correction method was not optimized for the narrow energy window. Basically, the same scatter correction method developed for the regular energy window of 511 keV (425–650 keV) was used for all of our images generated and analyzed. However, the model that was used for estimating multiple scatter within the scatter correction algorithm was tuned for the usual 425–650 keV energy window and therefore for accurate scatter correction of narrow energy window, this model needs to be tuned for 460–562 keV energy window. For this reason, the trues calculated for the narrow energy window may not represent the actual true coincidences with the correct scatter correction applied for this energy window. Even without the corrected tuned scatter correction applied for the narrow energy window, our Y-90 data still showed significant random and scatter counts reduction and improved image quality assessed by our readers.
Within the scatter estimation algorithm, the scatter tails outside the body boundaries are used for scaling the scatter estimation model. This becomes more challenging with [90Y]microsphere radioembolization imaging due to the source distribution which is limited to the liver; therefore there is a large distance between the activity (which is within the liver) and the system-defined tail boundaries which is outside the body. This results in fewer scatter events in tails and makes tail-scaling prone to errors due to fewer statistics. Potentially, this can be fixed by defining tails at the boundary of the liver for [90Y]microspheres. Also, the use of the narrow energy window reduces the number of events in the scatter tails and therefore could make the tail scaling less accurate. This limitation for the scatter correction in Y-90 PET imaging warrants further investigation and development opportunities.
The total number of events in Y-90 NEMA-IQ phantom study using the narrow energy window is about 4 million counts which is at least an order of magnitude higher than the Lu-176 based intrinsic trues coming from the detector crystal which is lutetium-based. However, in a very low-count regime these intrinsic true counts should be addressed in the reconstruction.
Our method of choosing the preferred beta values in the BSREM algorithm was only based on visual assessment using visual scores like VAS and Likert score by evaluating multiple images generated by different beta values. This type of method was still subjective, and dependent on the reader’s preference of image appearance. A quantitative method like comparing SUVs in images reconstructed using BSREM to images using another algorithm like OSEM as in [23] could replace the qualitative study we performed. However, neither images of BSREM nor images of OSEM can be considered ground truths. Our investigation using phantoms (Fig. 1 and 4) with known ground truths actually shows that BSREM improved contrast recovery, and did not over- or under-estimate activity concentration values. This result indicates that BSREM itself could be as accurate as OSEM, and further evaluation of determining appropriate beta values in the BSREM algorithm is warranted.
Conclusion
Our results show that TOF-BSREM algorithm improves TOF-OSEM in low-count PET imaging scenarios in terms of image quality and quantitative accuracy. However, the beta value in this algorithm needed to be adjusted for each radiopharmaceutical and counting statistics at the time of scans. It also shows that using a narrow energy window reduces the random events significantly for 90Y imaging and has the potential to improve overall image quality and resolution.
Acknowledgments
The authors would like to thank the clinical staff who performed PET/MR imaging studies of [68Ga] citrate and [90Y]microspheres. This work was supported in part by research grant from GE Healthcare and UCSF Department of Radiology and Biomedical Imaging as well as Cancer Center Support Grant from National Cancer Institute (P30CA082103). Y.S. was supported by National Cancer Institute (R01CA154561), National Institute of Biomedical Imaging and Bioengineering (R01EB026331), and National Heart, Lung, and Blood Institute (R01HL135490). M.J.E. was supported by the American Cancer Society (130635-RSG-17-005-01-CCE), the American Brain Tumor Association (DG1700008), the National Cancer Institute (P50CA097257), and the Department of Defense (W81XWH-16-1-0469).
Footnotes
Conflict of Interest
M.M.K., K.A.W., and T.W.D. are employees of GE Healthcare. No other potential conflict of interest relevant to this article was reported.
References
- 1.Walker MD, Asselin MC, Julyan PJ, et al. (2011) Bias in iterative reconstruction of low-statistics PET data: benefits of a resolution model. Phys Med Biol 56:931–949 [DOI] [PubMed] [Google Scholar]
- 2.Seith F, Schmidt H, Kunz J, et al. (2017) Simulation of Tracer Dose Reduction in (18)FFDG PET/MRI: Effects on Oncologic Reading, Image Quality, and Artifacts. J Nucl Med 58:1699–1705 [DOI] [PubMed] [Google Scholar]
- 3.Kadrmas DJ, Oktay MB, Casey ME, Hamill JJ (2012) Effect of Scan Time on Oncologic Lesion Detection in Whole-Body PET. IEEE Trans Nucl Sci 59:1940–1947 [DOI] [PMC free article] [PubMed] [Google Scholar]
- 4.Behr SC, Bahroos E, Hawkins RA, et al. (2018) Quantitative and Visual Assessments toward Potential Sub-mSv or Ultrafast FDG PET Using High-Sensitivity TOF PET in PET/MRI. Mol Imaging Biol 20:492–500 [DOI] [PubMed] [Google Scholar]
- 5.Lima GM, Diodato S, Costabile E, et al. (2018) Low dose radiation 18F-fluoride PET/CT in the assessment of Unilateral Condylar Hyperplasia of the mandible: preliminary results of a single centre experience. Eur J Hybrid Imaging 2:7. [DOI] [PMC free article] [PubMed] [Google Scholar]
- 6.Ohnona J, Michaud L, Balogova S, et al. (2013) Can we achieve a radionuclide radiation dose equal to or less than that of 99mTc-hydroxymethane diphosphonate bone scintigraphy with a low-dose 18F-sodium fluoride time-of-flight PET of diagnostic quality? Nucl Med Commun 34:417–425 [DOI] [PubMed] [Google Scholar]
- 7.Willowson KP, Bailey EA, Bailey DL (2012) A retrospective evaluation of radiation dose associated with low dose FDG protocols in whole-body PET/CT. Australas Phys Eng Sci Med 35:49–53 [DOI] [PubMed] [Google Scholar]
- 8.Zeimpekis KG, Barbosa F, Hullner M, et al. (2015) Clinical Evaluation of PET Image Quality as a Function of Acquisition Time in a New TOF-PET/MRI Compared to TOFPET/CT--Initial Results. Mol Imaging Biol 17:735–744 [DOI] [PubMed] [Google Scholar]
- 9.Murray I, Kalemis A, Glennon J, et al. (2010) Time-of-flight PET/CT using low-activity protocols: potential implications for cancer therapy monitoring. Eur J Nucl Med Mol Imaging 37:1643–1653 [DOI] [PubMed] [Google Scholar]
- 10.Alessio AM, Sammer M, Phillips GS, et al. (2011) Evaluation of optimal acquisition duration or injected activity for pediatric 18F-FDG PET/CT. J Nucl Med 52:1028–1034 [DOI] [PubMed] [Google Scholar]
- 11.Wampl S, Rausch I, Traub-Weidinger T, et al. (2017) Quantification accuracy of neurooncology PET data as a function of emission scan duration in PET/MR compared to PET/CT. Eur J Radiol 95:257–264 [DOI] [PubMed] [Google Scholar]
- 12.Derlin T, Schmuck S, Klot C, et al. (2017) Evaluation of 68Ga-PSMA I&T PET/CT in 240 Patients with Biochemical Relapse After Primary Therapy for Prostate Cancer: Intraindividual Comparison between Standard and Delayed Imaging. J Nucl Med 58: [Google Scholar]
- 13.Aggarwal R, Behr SC, Paris PL, et al. (2017) Real-Time Transferrin-Based PET Detects MYC-Positive Prostate Cancer. Mol Cancer Res 15:1221–1229 [DOI] [PMC free article] [PubMed] [Google Scholar]
- 14.Behr SC, Aggarwal R, Seo Y, et al. (2016) A Feasibility Study Showing [(68)Ga]Citrate PET Detects Prostate Cancer. Mol Imaging Biol 18:946–951 [DOI] [PMC free article] [PubMed] [Google Scholar]
- 15.Mari Aparici C, Behr SC, Seo Y, et al. (2017) Imaging Hepatocellular Carcinoma With 68Ga-Citrate PET: First Clinical Experience. Mol Imaging 16:1536012117723256. [DOI] [PMC free article] [PubMed] [Google Scholar]
- 16.Liow JS, Strother SC (1991) Practical tradeoffs between noise, quantitation, and number of iterations for maximum likelihood-based reconstructions. IEEE Trans Med Imaging 10:563–571 [DOI] [PubMed] [Google Scholar]
- 17.Qi J, Leahy RM (2006) Iterative reconstruction techniques in emission computed tomography. Phys Med Biol 51:R541–578 [DOI] [PubMed] [Google Scholar]
- 18.Sah BR, Stolzmann P, Delso G et al. (2017) Clinical evaluation of a block sequential regularized expectation maximization reconstruction algorithm in 18F-FDG PET/CT studies. Nucl Med Commun 38:57–66 [DOI] [PubMed] [Google Scholar]
- 19.Ahn S, Ross SG, Asma E, et al. (2015) Quantitative comparison of OSEM and penalized likelihood image reconstruction using relative difference penalties for clinical PET. Phys Med Biol 60:5733–5751 [DOI] [PubMed] [Google Scholar]
- 20.Wangerin KA, Ahn S, Ross SG, et al. (2015) Improving lesion detectability in PET imaging with a penalized likelihood reconstruction algorithm. Medical Imaging 2015: Image Perception, Observer Performance, and Technology Assessment 9416: [Google Scholar]
- 21.Behr SC, Mollard BJ, Yang J, et al. (2017) Effect of Time-of-Flight and Regularized Reconstructions on Quantitative Measurements and Qualitative Assessments in Newly Diagnosed Prostate Cancer With F-18-Fluorocholine Dual Time Point PET/MRI. Mol Imaging 16: [DOI] [PMC free article] [PubMed] [Google Scholar]
- 22.Ma H, Asma E, Ahn S, et al. (2013) Clinical evaluation of penalized likelihood reconstruction in whole-body PET studies. Eur J Nucl Med Mol Imaging 40:S109–S109 [Google Scholar]
- 23.Ter Voert E, Muehlematter UJ, Delso G, et al. (2018) Quantitative performance and optimal regularization parameter in block sequential regularized expectation maximization reconstructions in clinical 68Ga-PSMA PET/MR. EJNMMI Res 8:70. [DOI] [PMC free article] [PubMed] [Google Scholar]
- 24.Ahn S, Fessler JA (2003) Globally convergent image reconstruction for emission tomography using relaxed ordered subsets algorithms. IEEE Trans Med Imaging 22:613–626 [DOI] [PubMed] [Google Scholar]
- 25.Teoh EJ, McGowan DR, Macpherson RE, et al. (2015) Phantom and Clinical Evaluation of the Bayesian Penalized Likelihood Reconstruction Algorithm Q.Clear on an LYSO PET/CT System. J Nucl Med 56:1447–1452 [DOI] [PMC free article] [PubMed] [Google Scholar]
- 26.Nuyts J, Beque D, Dupont P, Mortelmans L (2002) A concave prior penalizing relative differences for maximum-a-posteriori reconstruction in emission tomography. IEEE Trans Nucl Sci 49:56–60 [Google Scholar]
- 27.Asma E, Ahn S, Ross SG, et al. (2012) Accurate and Consistent Lesion Quantitation with Clinically Acceptable Penalized Likelihood Images. 2012 Ieee Nuclear Science Symposium and Medical Imaging Conference Record (Nss/Mic) 4062–4066 [Google Scholar]
- 28.Rowley LM, Bradley KM, Boardman P, et al. (2017) Optimization of Image Reconstruction for (90)Y Selective Internal Radiotherapy on a Lutetium Yttrium Orthosilicate PET/CT System Using a Bayesian Penalized Likelihood Reconstruction Algorithm. J Nucl Med 58:658–664 [DOI] [PubMed] [Google Scholar]
- 29.NEMA NU 2–2012 Performance Measurements of Positron Emission Tomographs. InRosslyn, VA: National Electrical Manufacturers Association, 2013. [Google Scholar]
- 30.Pasciak AS, Bourgeois AC, Bradley YC (2014) A Comparison of Techniques for (90)Y PET/CT Image-Based Dosimetry Following Radioembolization with Resin Microspheres. Front Oncol 4:121. [DOI] [PMC free article] [PubMed] [Google Scholar]


