Abstract
Background
Three-dimensional fractional moving blood volume (3D-FMBV) derived from 3D power Doppler (PD) ultrasound has been proposed for non-invasive approximation of perfusion. However, 3D-FMBV has never been applied in animals against a ground-truth.
Purpose
To determine the correlation between 3D-FMBV and the ‘gold-standard’ of fluorescent microspheres to measure renal perfusion in a porcine model.
Materials and Methods
From February 2017 to September 2017, adult pigs received an administration of fluorescent microspheres (FMS) before and after measurement of renal 3D-FMBV at baseline (100%) and approximately 75%, 50% and 25% flow levels using 2 different ultrasound machines (General Electric (GE), Philips). 3D PD ultrasound volumes were converted, segmented and correlations by simple linear regression (r2) were made between FMS and 3D-FMBV. Similarity and reproducibility of manual segmentation was determined by Dice similarity coefficient (DSC) and 3D-FMBV reproducibility (ICC).
Results
13 pigs were studied with 33 flow measurements. Kidney volume (DSC = 0.89 ± 0.01) and renal segmentation (coefficient of variation = 12.6%; ICC = 0.86) were consistent.
3D-FMBV calculations had high reproducibility (ICC = 0.97 (95% CI = 0.96 – 0.98)). 3D-FMBV per-pig correlation showed excellent correlation for both GE and Philips ultrasound (GE mean r2 = 0.96, range = 0.92–1.0; Philips mean r2 = 0.93, range = 0.784 – 1.0). The correlation between 3D-FMBV and perfusion measured by microspheres was high (GE r2 = 0.80, p < 0.001; Philips r2 = 0.70, p < 0.001).
Conclusion
The strong correlation between 3D-FMBV and fluorescent microspheres indicates 3D-FMBV correlates to perfusion well and shows good reproducibility.
Summary Statement
Using 3D Power Doppler ultrasound, fractional moving blood volume was accurate and reproducible for determining renal perfusion in a porcine model.
Introduction
Numerous pathological states are characterized by altered vascularity (number of blood vessels per unit tissue volume) or perfusion (expressed as volume blood flow (ml/sec) per unit tissue mass or ml/kg/sec). Currently, no easily available clinical tool exists for quantification of tissue or organ blood flow and perfusion.
Perfusion estimation using near-infra red spectroscopy (NIRS), MRI or CT has been attempted but there are several challenges for clinical adoption. NIRS provides no visual display to indicate the anatomical site where tissue oxygenation is being measured. MRI allows imaging and but is inherently expensive, temporally and spatially limited and dependent on the type of sequence used (arterial spin labelling (ASL) or blood oxygenation level-dependent (BOLD)). CT requires ionising radiation and tracer. Ultrasound would be, therefore, an obvious candidate for non-invasive volumetric perfusion imaging that can be performed in most clinical settings. With a validated method, the ability to understand where organ perfusion has changed versus absolute measurements (against a known reference range), or as relative measurements (for example in response to therapy or surgery including transplantation) would be valuable to detect and determine the severity of perfusion changes and lead to earlier interventions. These would have obvious applications in emergency care, transplantation and oncology where estimation of perfusion would be a useful additional diagnostic tool.
Power Doppler ultrasound has advantages for flow quantification due to its ability to detect low velocity signals, its detection of multidirectional flow, and lack of aliasing (1). Sources of error include signal attenuation due to depth, as well as patient habitus and tissue inhomogeneity, reducing the possibility for comparison over time or between patients. To compensate, a technique called Fractional Moving Blood Volume (FMBV) has been proposed to allow standardization within an image or volume of tissue relative to an adjacent region of known 100% vascular amplitude (generally a large local vessel)(2, 3). This technique uses the cumulative power distribution function to define a stable intravascular point and correct mathematically for rouleaux if present, resulting in an internally standardized, absolute value for vascularity for inter-case comparison (4).
A prior two-dimensional (2D) ultrasound study showed that the FMBV technique could be validated against microspheres (5); however 2D imaging has limitations, particularly the potential for isolated large vessels to influence measures of ‘perfusion’ and corresponding need for precision in the selection of the plane being insonated.
To solve these problems, a technique for measurement of 3D-FMBV was developed using an offline image analysis technique applied to raw exported 3D power Doppler ultrasound image data (6). Subsequently, 3D-FMBV has shown decreased first-trimester placental vascularity in pre-eclampsia (7). While these early results were highly encouraging, before further clinical evaluation we wished to experimentally validate and test the correlation between 3D-FMBV and microspheres; the latter as a reference standard for perfusion evaluation. In this study, we hypothesized that 3D FMBV would estimate perfusion was well as previously reported 2D estimates. Our aim is to compare 3D-FMBV with both FMS and a ultrasonic volume flow measurement, as well as comparing two separate ultrasound machines to evaluate the cross-platform potential of this tool.
Materials and Methods
This study was conducted from February - September 2017 with the protocol approved by the University of Michigan Institutional Animal Care and Use Committee (ref. #: 7167). This study is a within-subjects, repeated measures design with 4 levels (flow conditions) for 3 measures (3D-FMBV, FMS and volumetric flow). A detailed explanation of the animal preparation and microsphere processing are included with the supplemental materials.
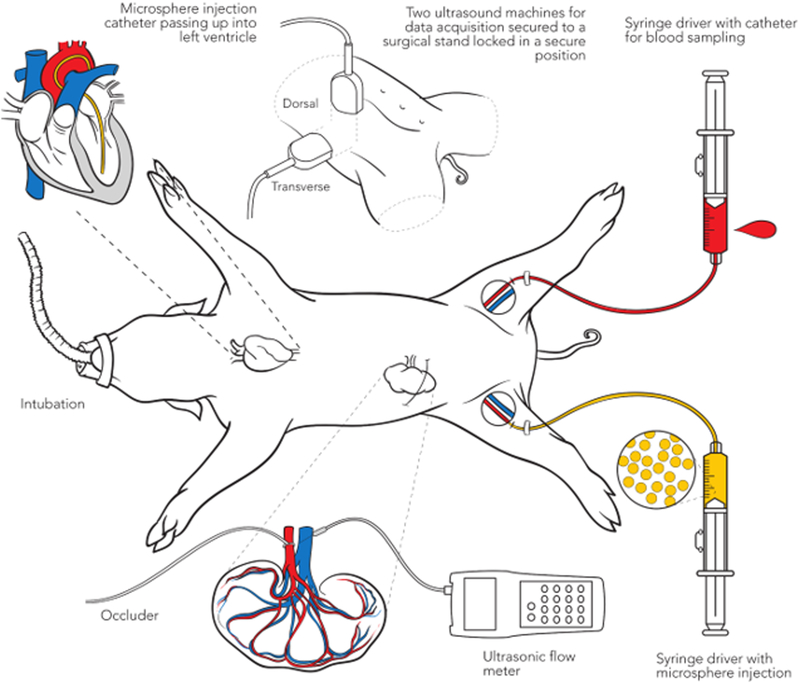
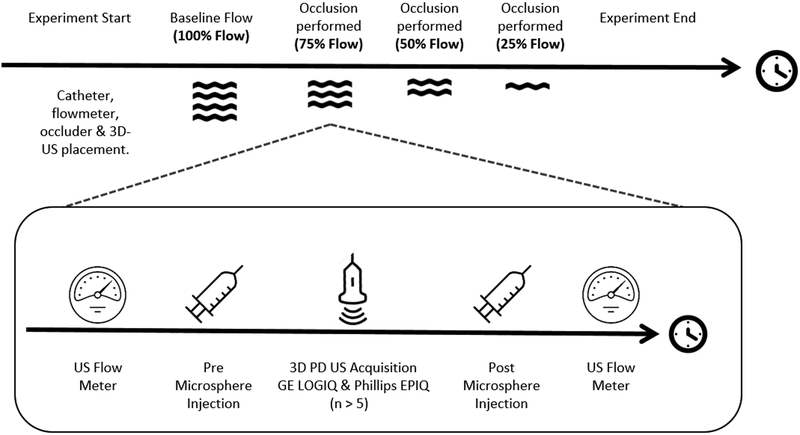
A schematic describing the procedure is shown in Figure 1A and temporal design of the experiment in Figure 1B. We measured 3D-FMBV, FMS and volumetric flow at four flow conditions resulting from renal arterial vascular occlusion: baseline (100%); approximately 75%; 50%; 25% flow. At each level, an initial flow meter recording was stored, followed by microsphere injection. A reference blood sample was generated by withdrawing 6ml of arterial blood over 3 minutes, starting at 20 seconds prior to the injection of MS from the contralateral femoral artery catheter using a computerized syringe driver (NE1000, New Era Pump Systems Inc., Farmingdale, NY). The 20 seconds was used to confirm that the catheter was successfully drawing blood with no issues (e.g. air or clotting) that would preclude the successful capture of a withdrawal sample, making any MS injection invalid.
Figure 1.
A schematic diagram illustrating the setup (A) and the experimental protocol (B) showing the 75% flow condition procedure performed for all pigs.
Ultrasound Acquisition:
Two ultrasound machines were used for 3D power Doppler (PD) data acquisition: LOGIQ 9 (GE Healthcare Milwaukee, WI) and EPIQ 7G (Phillips, Cambridge, Massachusetts) with 4D3C-L (2–5MHz) and X6–1 (1–6MHz) transducers, respectively. Each transducer was secured to a surgical stand locked in a secure position throughout our study; the LOGIQ transducer acquired data dorsally and the EPIQ transversely as shown in Figure 1C and D. For each volume acquisition, breathing artifacts were avoided by breath-hold using the ventilator, with sufficient recuperation between breath holds based on vital sign monitoring. The LOGIQ system acquired data using the Renal preset and the following settings: Center frequency 3.1MHz, pulse repetition frequency (PRF) 0.4kHz, wall-motion filter (WMF) 52Hz, Line filter 2, Duplex On, Quality Hi2. The EPIQ system used the following settings: Center frequency 2.6 MHz, PRF 0.35kHz, WMF 31 Hz, Line Density High, Freq. Opt Adapt, Flow Opt Low. Persistence Off. PD gain for both machines was set using the customized, sub-noise gain selection as described previously (1, 8–10)
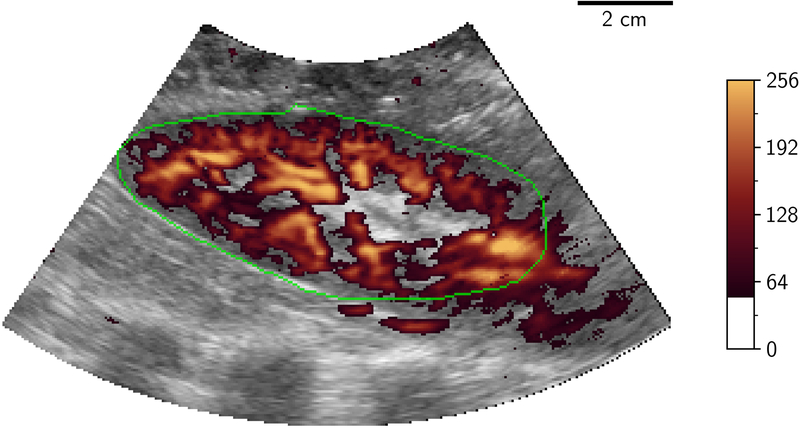
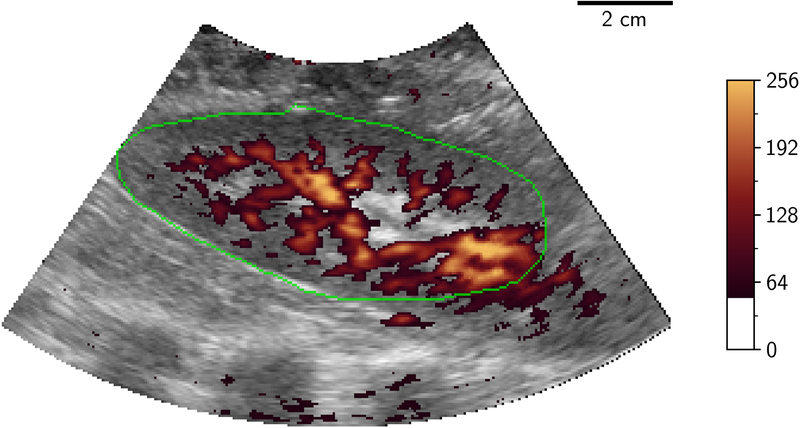
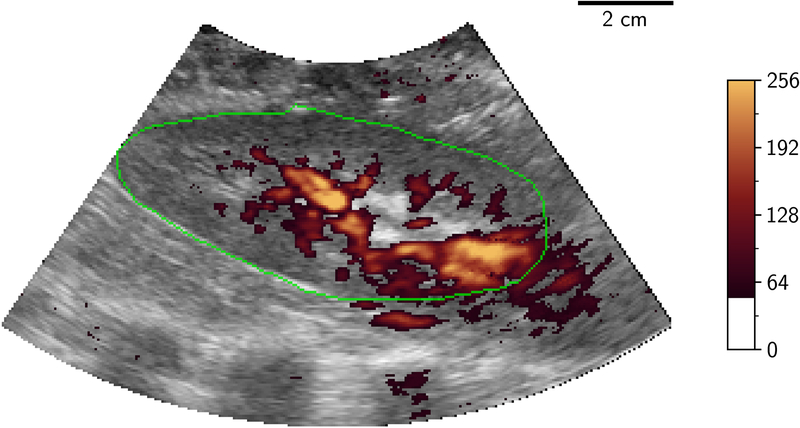
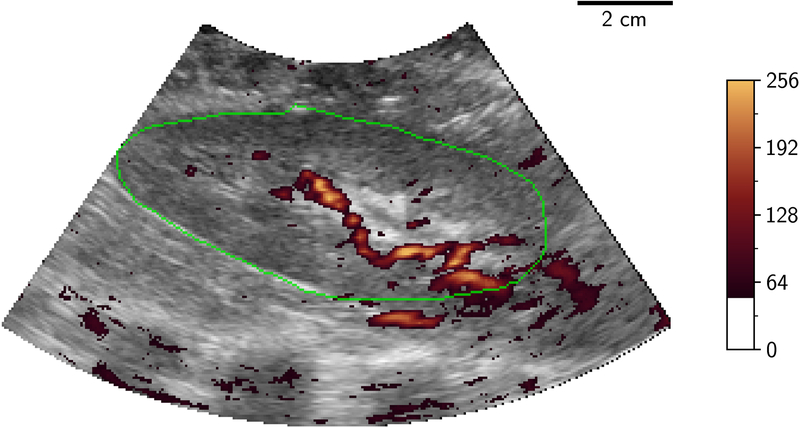
Volumetric image data were then stored from initially the LOGIQ system then the EPIQ system with a minimum of 5 volumes being stored from each at a given flow rate. Following storage of these ultrasound volumes, a further injection of microspheres was performed followed by a further measurement of flow using the flowmeter, to evaluate the physiological and experimental stability of measured flow during the ultrasound acquisition time period. Only one ultrasound source was transmitting at any one time to eliminate interference/cross-talk between the systems. Examples of 2D-PD slices of 3D volumes at differing levels of occlusion are shown in Figure 2.
Figure 2.
2D B-mode (greyscale) slice of 3D-US volume with power Doppler mapping (orange) of porcine kidney demonstrating perfusion at different flow conditions: 100%, 75%, 50% and 25% (A to D). The renal outline is highlighted with the green line. 2D two dimensional; 3D three dimensional; US ultrasound.
Image Processing:
Raw data from the 3D power Doppler ultrasound volumes were converted from their scan-line representation off-line into a 3D Cartesian volume in Neuroimaging Informatics Technology Initiative (NIFTI) image format (11) for visualization and manual segmentation. Segmentation was performed using the 3D medical imaging application ITK-SNAP (v3.6, University of Pennsylvania, Philadelphia PA) (12). Volumes were visually examined for consistency of sampling location to ensure no movement of the transducer had occurred during the experiment. If movement occurred, the segmentation process described below was reinitiated after the 3D-US field of view was stabilized and applied to subsequent volumes.
A single observer (GS; 8 years’ experience in 3D-US labelling) segmented the entire kidney for each pig in triplicate, the segmentation being made on the first volume and then being ‘pasted’ through the remainder of the 20 volumes (at least 5 at each of 4 flow states) per pig kidney to ensure measurement stability.
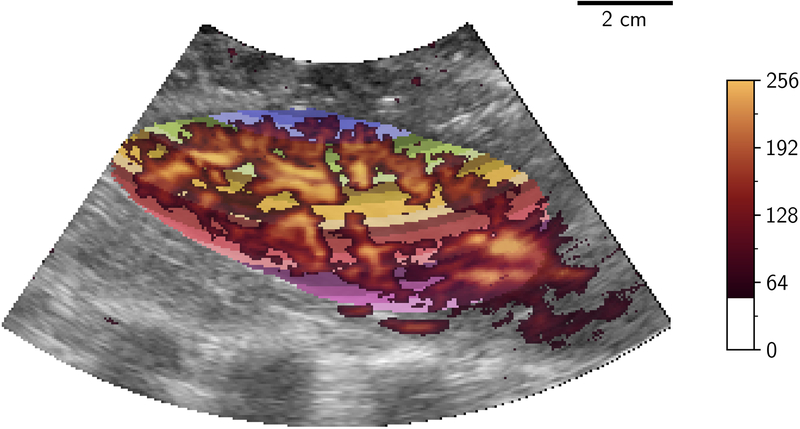
Differences in volumetric segmentation were investigated in terms of total volume variability. For the segmented volume data, Dice Similarity Coefficients (DSC) for overlap (13) and Hausdorff distances were evaluated for locational consistency. The segmentation was then processed using a 3D version of the FMBV method previously described (4, 14), to provide a percentage measure of vascularity. In brief, this algorithm used a set of 3D volumes of interest that were determined by transforming the 3D Cartesian segmentation of the kidney back into the toroidal (scan-line) geometry (Figure 3a). Then a distance-map providing discrete millimeter distances from the transducer (shown in Figure 3b) was generated.
Figure 3.
Distance transform showing millimeter distances (multi-color) in which 3D-FMBV values were calculated in toroidal (A) space where a mean 3D-FMBV value was calculated at each discrete millimeter interval and then transformed back into the Cartesian display space (B). 3D three dimensional; FMBV fractional moving blood volume.
At each of these volumes of interest, FMBV was computed upon this particular set of PD voxels where standardization was performed as per the technique of Rubin et al (4), using the voxels containing 100% blood within each level as a standardisation point from which a percentage FMBV value was generated. This provided a set of FMBV values from which the mean FMBV was calculated. When less than 400 voxels were present at a particular distance, FMBV was not computed as there was insufficient samples to make an estimate. FMBV measures were generated in a minimum of 5 image volumes per flow condition and the mean value used to represent 3D FMBV when compared to FMS and volumetric flow. The labelling was triplicated for each volume, providing at least 15 values from which variability was assessed. For each flow-condition, repeatability was investigated on a per-volume and per-state basis to assess further potential sources of variability in the image analysis process.
Stability of perfusion as evaluated by FMS during the time of ultrasound volume storage was evaluated for the 33 time points, by comparing mean FMS concentration (from the 6 renal cortical samples) before and after image storage.
Statistical Analysis:
The significance threshold was set at p < 0.05. All statistical analysis was performed using the Anaconda build system (v. 4.6.7, 2019, Anaconda, Inc, Austin, TX) incorporating the Python (v. 3.6) and R (v. 3.5.1) languages using the scipy (v. 1.2.1), pandas (v. 0.24.2), statsmodels (v 0.9), matplotlib (v 3.10) and irr (v. 0.84.1) libraries (15–19). Associations between vascularity measurements using 3D-FMBV, ultrasonic flow measurement and FMS estimation of perfusion were compared using Regression using generalized estimating equations and simple linear regression to compute coefficient of determination (r2), for both per-case and absolute correlations. Where multiple measurements were recorded (per-anatomical volume; per-flow condition) repeatability was assessed using coefficients of variability and intra-class correlation coefficients (two-way mixed effects, single, absolute; ICC(2,1))).
Results
We analyzed a total of 13 adult pigs; pigs 1 and 2 were used for technical evaluation and experimental setup and a further 11 pigs were analyzed using the protocol as described in the methods, Figure 1 illustrates the experimental setup. For two of these 11 pigs (pigs 4 and 5), blood withdrawal errors led to microsphere results that could not be evaluated, leaving 9 experimental pigs. One pig had a single episode of failed blood withdrawal and another pig had two measurement states after resuscitative administration of epinephrine that were discarded due to potential drug influence. This left 33 complete flow measurement states from 9 pigs included in the experimental analysis.
Reproducibility:
Per pig, mean kidney volume (± SD) was estimated at 112 ml ± 4 ml. Similarity was measured using Mean Dice Similarity Coefficient (DSC; ± SD) which was 0.89 ± 0.01 and mean Hausdorff value (± SD) was 9.8 mm ± 1.5 mm. The DSC scores are similar to intra-observer DSC presented in 3D-US studies in adult (0.92) and fetal (0.90) studies (20, 21). Variability in segmentation of the whole kidney in 9 pigs in triplication resulted in a coefficient of variation (CoV) of 12.6% and ICC of 0.86 (95% CI; 0.64 – 0.96). When FMBV was calculated for each of these segmentations the ICC between segmentations was 0.97 (95% CI; 0.96 – 0.97). For each flow condition, mean CoV was 6.48% (95% CI; 0.62 – 12.13). Reproducibility was estimated at each flow condition (ICC values (+/− 95% CI)) for both machines. At baseline the ICC was 0.86 (0.79 – 0.91) for the GE system with an increase in value as flow reduced. At 75% ICC was 0.89 (0.83 – 0.93), at 50% was 0.95 (0.92 – 0.97) and at 25% was 0.95 (0.92 – 0.97)). At baseline flow conditions ICC for the Philips was 0.85 (0.78 – 0.90). ICC also increased as flow conditions (75%, 50% and 25%) reduced: 0.86 (0.80 – 0.91); 0.94 (0.91 – 0.96); 0.97 (0.95 – 0.98)).
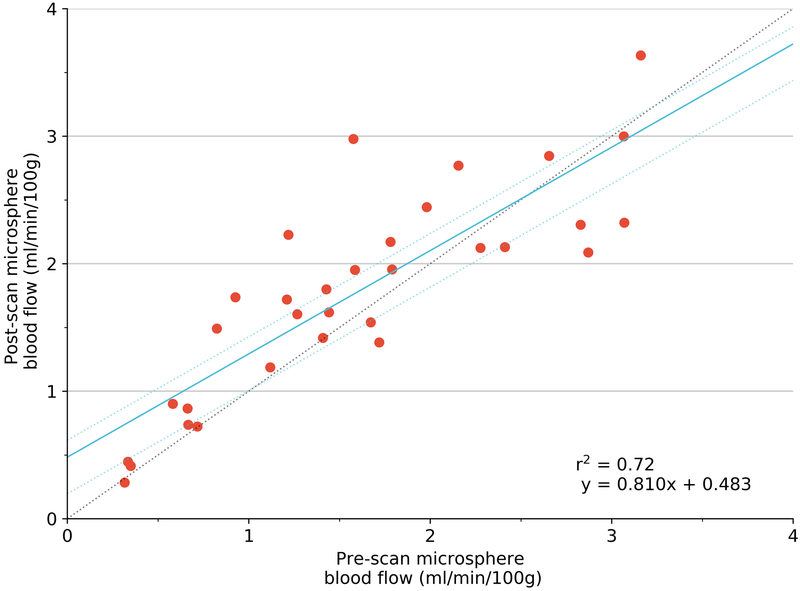
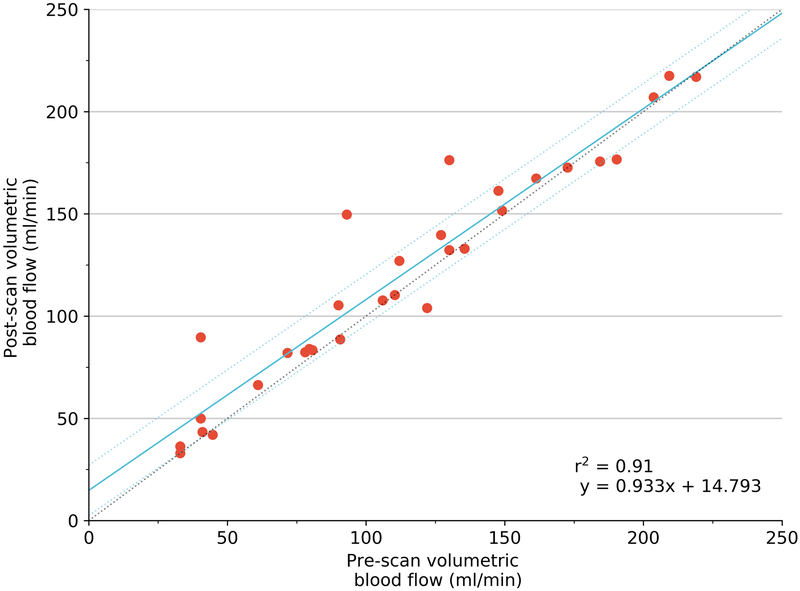
FMS concentration (from the 6 renal cortical samples) was relatively stable (r2=0.72), though this variation may have influenced final measurement of correlation. The stability of volumetric blood flow as evaluated by the ultrasonic flow meter was higher (r2 = 0.91).
Measurement Comparison:
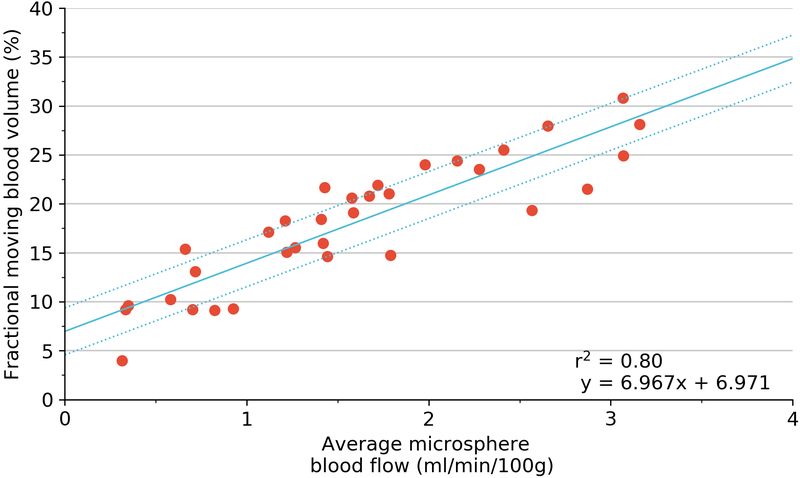
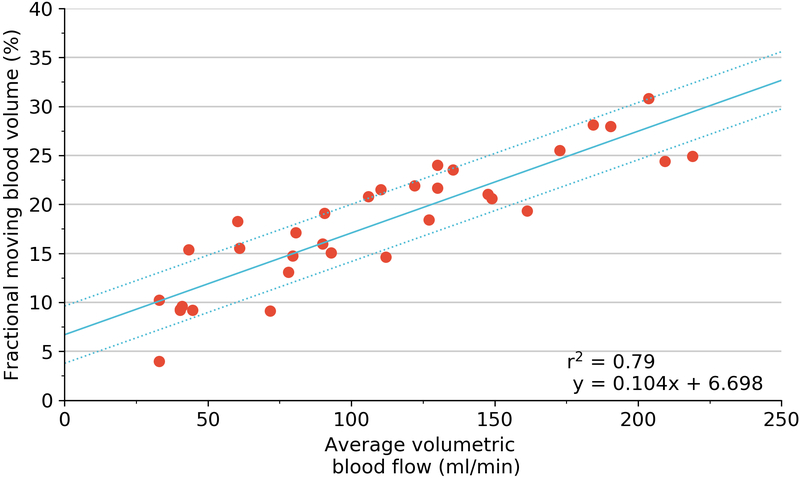
Plots of all regression testing performed are shown in Figure 6 and as Supplementary Figures 2 and 3. For each pig, there was an excellent correlation for both GE and Philips machines (GE mean r2=0.96, range 0.92–1.00; Philips mean r2= 0.93, range 0.78–1.00). As an absolute measure for all 33 states, there was a strong positive correlation albeit with a non-zero intercept for both GE and Philips machines (GE r2 =0.80, p <0.001; Philips r2 =0.70, p<0.001).
Figure 6.
Regression using generalized estimating equation (blue) with 95% confidence limits (dotted line) of 3D fractional moving blood volume (FMBV) using GE LOGIQ against FMS measured perfusion (A); and volumetric blood flow for absolute values (B). Coefficient of determination (r2) provided by simple linear regression. 3D three dimensional; FMBV fractional moving blood volume; FMS fluorescent microspheres.
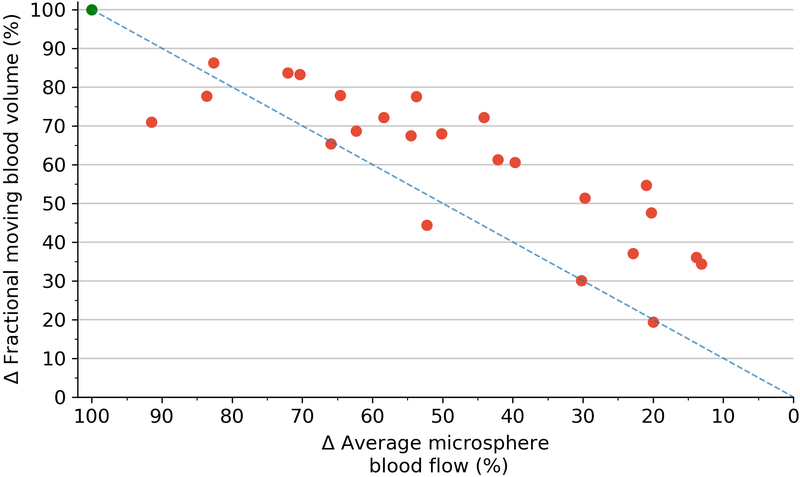
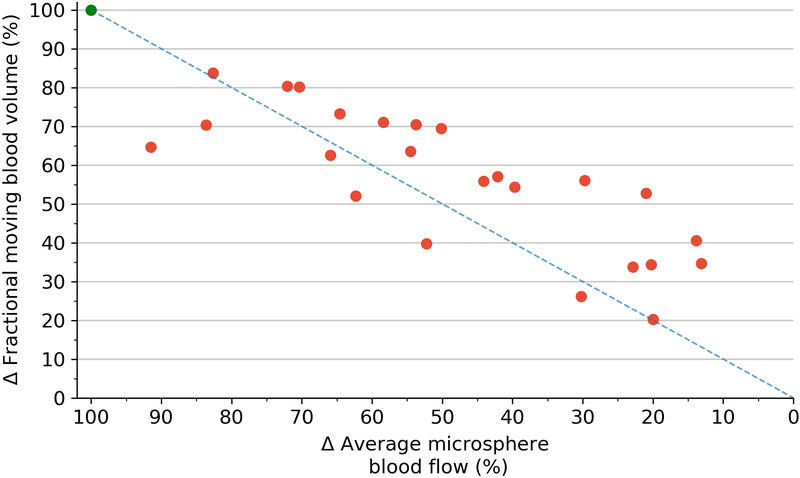
Correlations between 3D-FMBV and volumetric flow showed similar results. Per-pig correlations showed strong agreements for both machines (GE mean r2 = 0.98, range 0.91–1.00; Philips mean r2 = 0.97, range 0.86–0.99). As an absolute measure for all 33 states the correlation remained high (GE r2 = 0.79, p<0.001; Philips r2 = 0.74, p<0.001). Correlations between volumetric flow and microspheres were positive and significant (p < 0.001). As an absolute measure for all 33 states, the r2 was 0.78 with an individual per-pig range of 0.91 – 1.00. Correlation between the 3D-FMBV values as calculated from data from both machines was also high (r2 = 0.94). When the three techniques were regressed against each other, there was a strong correlation for both machines (GE mean r2 = 0.78, range 0.91–1.00; Philips mean r2 = 0.78, range 0.91–1.00). Pairwise correlation between the three methods for the two machines showed consistently strong correlations (0.70–0.84). Further correlation was made between the relative value of perfusion as assessed by 3D-FMBV against change in FMS from baseline (expressed as delta values), as shown in Figure 7.
Figure 7.
Scatterplot of the difference (Δ) in 3D-FMBV as measured by GE plotted against the difference (Δ) in average microsphere blood flow from their respective baseline measurements (A); difference (Δ) in 3D-FMBV measured by Philips system (B). Line of equality (dotted line). 3D three dimensional; FMBV fractional moving blood volume.
Discussion
Alterations in tissue perfusion occur in the majority of human and animal pathological conditions (eg, hypertension, obesity and diabetes mellitus) (22). A portable, non-invasive and cost-effective method for evaluation of vascularity would be clinically ideal but remains elusive. We have shown in a porcine renal model that 3D power Doppler (PD) ultrasound using 3D fractional moving blood volume (FMBV) correlates highly with established techniques for evaluation of perfusion, namely fluorescent microspheres (FMS) (23) and volumetric flow as measured by an ultrasonic flowmeter (24, 25) Our results also show an excellent absolute correlation with both established measures of perfusion and volume flow, and this correlation is high for two different ultrasound platforms. The absolute correlations (r2) for the two machines were 0.80 (p < 0.05) and 0.70 (p < 0.05) against fluorescent microspheres and 0.79 and 0.74 against volumetric flow, indicating that 3D FMBV can be determined independent of these ultrasound system manufacturers. Correlations of 3D FMBV and FMS from both machines show a non-zero intercept (Logiq 6.7; Philips 5.1) for FMBV (Fig. 6a and Sup. 2a) which we postulate is due to two factors; the contribution of PD noise and the presence of venous blood that would be a factor in the 3D FMBV calculation but not considered by FMS. Therefore, low values of FMBV may exist when no blood flow is present as the linear relationship indicates a fixed offset in FMBV.
Numerous recent studies include ours (5, 26–32) have evaluated imaging techniques for estimation of perfusion as summarized in Table 1. Our results show that 3D-FMBV performs as well as previous techniques, aside from the MRI and ultrasound study of Warmuth et al.(26). That dual-modality study required porcine kidneys to be exteriorized and then imaged ex-vivo, which would not easily translate to a clinical setting. The other study that shows greater correlation is Lemoine et al. where CT and radioactive tracers were used to measure perfusion, which have obvious disadvantages for application in popular ultrasound settings such as obstetrics and neonatology. A comparable ultrasound study by Hernandez-Andrade et al., using 2D-FMBV showed a similar correlation with perfusion as measured by radioactive microspheres (5). However, there are limitations with 2D imaging, specifically the need to select precise anatomical planes and the inability to evaluate whole regions or organs.
Table 1:
Correlation between perfusion and imaging measurement techniques performed in in various animal studies.
| Study author | Year | 2D / 3D | Validation | Modality | r |
|---|---|---|---|---|---|
| This work; Welsh et al. | 2018 | 3D | FMS | PD-US | 0.89 (GE) |
| 0.84 (Philips) | |||||
| Lemoine et al. (26) | 2011 | 3D | FMS | CT | 0.93 |
| Artz et al. (27) | 2011 | 3D | FMS | MRI | 0.81 |
| Morel et al. (28) | 2010 | 3D | US F-M | PD-US | 0.81 |
| Sridharan et al. (29) | 2013 | 3D | FMS | US HI | 0.62 |
| Hernandez-Andrade et al. (9) | 2004 | 2D | RMS | PD-US | 0.93* |
| Acharya et al. (30) | 2007 | 2D | FMS | 2D Dplr US | 0.76 |
| Forsberg et al. (31) | 2006 | 2D | FMS | US HI | 0.57 |
| Warmuth et al. (25) | 2007 | 3D | US F-M & FMS | MRI/US | 0.98 |
Key: MS = microspheres; FMS / RMS = fluorescent / radioactive MS; PD = power Doppler; HI = Harmonic Imaging; HI = harmonic Imaging; US = ultrasound; MRI = magnetic resonance imaging; F-M = flow-meter; CT = computed tomography;
= per-sheep;
GE = LOGIQ; PI = Philips EPIQ 7G
It is unclear whether 3D-FMBV precisely represents perfusion, vascularity or flow, but our results clearly show strong correlation of 3D FMBV with measures of perfusion and volumetric flow through the tissue volume. Each of these measures are approximations for true perfusion. Volumetric flow measurements were taken for the whole porcine kidney; this was not normalized by a measure for volume of tissue, as this would have been a measurement for average renal perfusion, whereas the FMS measurements were taken from the renal cortex only; potentially introducing a comparative error. We are undertaking further phantom-based laboratory experiments to try and determine precisely which aspect of regional blood flow (perfusion, flow or blood volume) 3D-FMBV best reflects.
Our study has some limitations. Our results reveal inherent experimental and physiological variability. Perfect correlation between the three measures would have been impossible. Comparison between pre- and post- FMS injection measures for perfusion (r2 = 0.72) shows the relative stability of the experiment during the time period of FMS injection and 3D PD US acquisition. The lack of perfect correlation indicates either physiological fluctuation in perfusion or possible inconsistencies in the FMS technique during this time period. Consequently, the correlation between 3D-FMBV and FMS would be influenced by this relative physiological instability, indicating that the correlation may in fact be higher than our measurements suggest. Of note, the ultrasonic flowmeter appeared to show much better pre- and post-FMS correlation suggesting stability as assessed by this tool (r2 = 0.91) despite these measurements being taken at a longer time interval than the respective FMS pre- and post- measurements. As the study regressed repeated events with different flow conditions within the same animal this violates the assumption of independence and identical distribution (i.i.d) of points. However, we believe that we have used the best approximation available, which allows comparison to other similar studies (Table 1). Unfortunately, there is no further ‘absolute measure’ with which to compare 3D-FMBV, therefore it may be enough to say that in the context of these experiments, it appears to be ‘at least as accurate’ as any of the existing reference-standard methods for perfusion evaluation with the benefit of it being a non-invasive technique.
In summary, using 3D PD-US to estimate 3D FMBV has the potential to be an accurate, cost-effective bedside tool for evaluation of tissue or organ perfusion. We postulate that it could have a role in any medical setting including acute medicine, ambulatory care settings or as part of perioperative assessment. Based on our findings, extensive further clinical evaluation is now indicated to determine its role in clinical practice.
Supplementary Material
Figure 4.
Regression using generalized estimating equation (blue) with 95% confidence limits (dotted line) of pre- versus post- flow conditions of mean perfusion calculated using FMS (A); pre- versus post- volumetric flow as measured by ultrasonic flow meter (B). Coefficient of determination (r2) provided by simple linear regression. FMS fluorescent microspheres.
Figure 5.
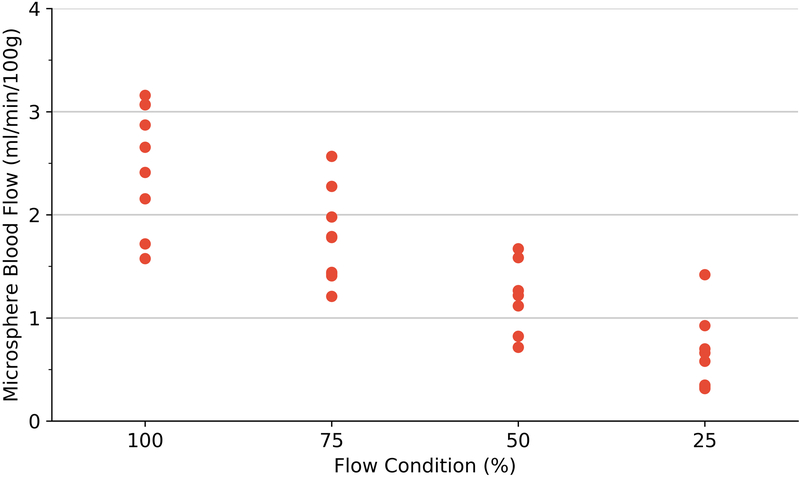
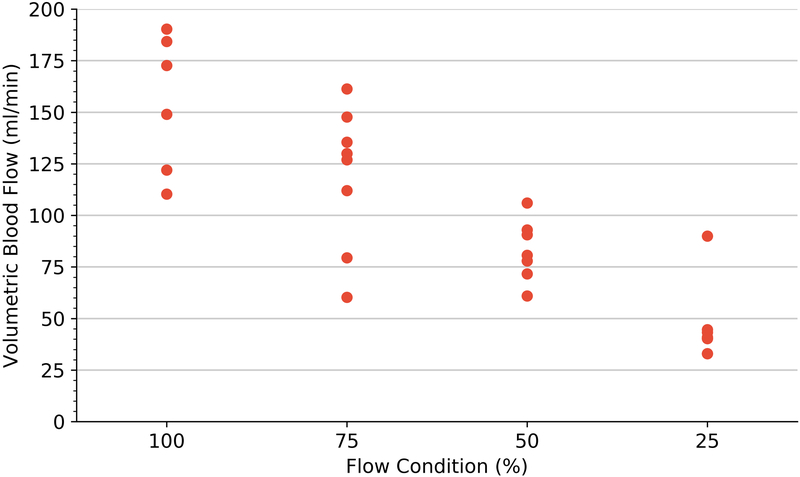
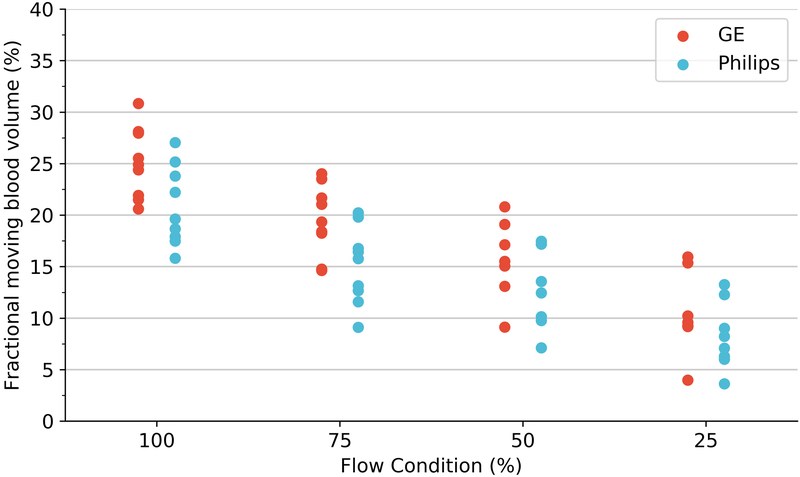
Perfusion estimation by microspheres (A), volumetric blood flow (B) and 3D-FMBV estimated by LOGIQ and Philips systems (C) plotted against the 4 different flow conditions as estimated at baseline, 75%, 50% and 25% flow. 3D three dimensional; FMBV fractional moving blood volume.
Key Results.
In a porcine model, renal kidney perfusion measured by 3D fractional moving blood volume (FMBV) (%) using 3D power Doppler ultrasound by GE (r2 = 0.80; p < 0.05) and Philips (r2 = 0.70; p < 0.05) systems showed a strong correlation to blood flow measured by microspheres.
Manual 3D labelling of the kidney and 3D-FMBV measurement was found to be highly similar (Dice similarity coefficient = 0.89 ± 0.01) and reproducible (ICC = 0.97).
Acknowledgements
The authors would like to thank Lucia Garces for her illustration skills in creating the experimental schematic.
Funding Information
The capital expenditure for this study and support for GS was funded by the Leslie Stevens Fund for Newborn Care, Sydney administered through the University of New South Wales. Sally Collins and Padraig Looney are supported by the Eunice Kennedy Shriver National Institute of Child Health and Human Development (NICHD) Human Placenta Project of the National Institutes of Health, USA under award number UO1-HD087209. The content is solely the responsibility of the authors and does not necessarily represent the official views of the National Institutes of Health
Abbreviations
- 3D
Three Dimensional
- DSC
Dice Similarity Coefficient
- FMBV
Fractional Moving Blood Volume
- ICC
Intra-class Correlation Coefficients
- PD
Power Doppler
- PRF
Pulse repetition frequency
- NIFTI
Neuroimaging Informatics Technology Initiative
- WMF
wall motion filter
Footnotes
Competing Interests:
None Declared
References
- 1.Rubin JM, Bude RO, Carson PL, Bree RL, Adler RS. Power Doppler US: a potentially useful alternative to mean frequency-based color Doppler US. Radiology 1994;190:853. [DOI] [PubMed] [Google Scholar]
- 2.Rubin JM, Adler RS, Fowlkes JB, Spratt S, Pallister JE, Chen JF, Carson PL. Fractional moving blood volume: estimation with power Doppler US. Radiology 1995;197:183. [DOI] [PubMed] [Google Scholar]
- 3.Welsh A. Quantification of power Doppler and the index “fractional moving blood volume” (FMBV). Ultrasound in Obstetrics and Gynecology 2004;23:323–326. [DOI] [PubMed] [Google Scholar]
- 4.Rubin J, Bude R, Fowlkes J, Spratt R, Carson P, Adler R. Normalizing fractional moving blood volume estimates with power Doppler US: defining a stable intravascular point with the cumulative power distribution function. Radiology 1997;205:757. [DOI] [PubMed] [Google Scholar]
- 5.Hernandez-Andrade E, Jansson T, Ley D, Bellander M, Persson M, Lingman G, Marsàl K. Validation of fractional moving blood volume measurement with power Doppler ultrasound in an experimental sheep model. Ultrasound in Obstetrics and Gynecology 2004;23:363–368. [DOI] [PubMed] [Google Scholar]
- 6.Stevenson GN, Collins SL, Welsh AW, Impey LW, Noble JA. A technique for the estimation of fractional moving blood volume by using three-dimensional power Doppler US. Radiology 2014;274(1):230–237. doi: 10.1148/radiol.14132363 [DOI] [PubMed] [Google Scholar]
- 7.Collins SL, Welsh AW, Impey L, Noble JA, Stevenson GN. 3D fractional moving blood volume (3D-FMBV) demonstrates decreased first trimester placental vascularity in pre-eclampsia but not the term, small for gestation age baby. PloS one 2017;12(6):e0178675. [DOI] [PMC free article] [PubMed] [Google Scholar]
- 8.Collins S, Stevenson G, Noble J, Impey L, Welsh A. Influence of power Doppler gain setting on Virtual Organ Computer‐aided AnaLysis indices in vivo: can use of the individual sub‐noise gain level optimize information? Ultrasound in Obstetrics & Gynecology 2012;40(1):75–80. [DOI] [PubMed] [Google Scholar]
- 9.Martinoli C, Derchi LE. Gain setting in power Doppler US. Radiology 1997;202(1):284–285. [DOI] [PubMed] [Google Scholar]
- 10.Sanderson J, Wu L, Mahajan A, Meriki N, Henry A, Welsh AW. Selection of the sub-noise gain level for acquisition of VOCAL data sets: a reliability study. Ultrasound in Medicine & Biology 2014;40:562–567. doi: 10.1016/j.ultrasmedbio.2013.09.004 [DOI] [PubMed] [Google Scholar]
- 11.Cox RW, Ashburner J, Breman H, Fissell K, Haselgrove C, Holmes CJ, Lancaster JL, Rex DE, Smith SM, Woodward JB. A (Sort of) new image data format standard: NIfTI-1: WE 150. Neuroimage 2004;22:e1440. [Google Scholar]
- 12.Yushkevich PA, Pashchinskiy A, Oguz I, Mohan S, Schmitt JE, Stein JM, Zukić D, Vicory J, McCormick M, Yushkevich N, Schwartz N, Gao Y, Gerig G. User-Guided Segmentation of Multi-modality Medical Imaging Datasets with ITK-SNAP. Neuroinformatics 2018. doi: 10.1007/s12021-018-9385-x [DOI] [PMC free article] [PubMed] [Google Scholar]
- 13.Dice LR. Measures of the amount of ecologic association between species. Ecology 1945;26:297–302. [Google Scholar]
- 14.Stevenson GN, Collins SL, Welsh AW, Impey LW, Noble JA. A Technique for the Estimation of Fractional Moving Blood Volume by Using Three-dimensional Power Doppler US. Radiology 2015;274:230–237. doi: 10.1148/radiol.14132363 [DOI] [PubMed] [Google Scholar]
- 15.Jones E, Oliphant T, Peterson P, et al. SciPy: Open source scientific tools for Python, 2001.
- 16.Seabold S, Perktold J. Statsmodels: Econometric and statistical modeling with python. Proceedings of the 9th Python in Science Conference 2010:57–61. [Google Scholar]
- 17.McKinney W. Data structures for statistical computing in python. Proceedings of the 9th Python in Science Conference: Austin, TX, 2010; p. 51–56. [Google Scholar]
- 18.Gamer M, Lemon J, Fellows I, Singh P. irr: Various Coefficients of Interrater Reliability and Agreement, 2010.
- 19.Hunter JD. Matplotlib: A 2D Graphics Environment. Computing in Science & Engineering 2007;9(3):90–95. doi: 10.1109/MCSE.2007.55 [DOI] [Google Scholar]
- 20.Gu B, Stevenson GN, Ferreira A, Pathirana S, Sanderson J, Henry A, Alphonse J, Welsh AW. Applying spatial–temporal image correlation to the fetal kidney: Repeatability of 3D segmentation and volumetric impedance indices. Australasian Journal of Ultrasound in Medicine 2018;21(3):169–178. doi: 10.1002/ajum.12094 [DOI] [PMC free article] [PubMed] [Google Scholar]
- 21.Marsousi M, Plataniotis KN, Stergiopoulos S. An Automated Approach for Kidney Segmentation in Three-Dimensional Ultrasound Images. IEEE Journal of Biomedical and Health Informatics 2017;21(4):1079–1094. doi: 10.1109/JBHI.2016.2580040 [DOI] [PubMed] [Google Scholar]
- 22.Levy BI, Schiffrin EL, Mourad J-J, Agostini D, Vicaut E, Safar ME, Struijker-Boudier HA. Impaired tissue perfusion: a pathology common to hypertension, obesity, and diabetes mellitus. Circulation 2008;118(9):968–976. [DOI] [PubMed] [Google Scholar]
- 23.Prinzen FW, Bassingthwaighte JB. Blood flow distributions by microsphere deposition methods. Cardiovascular research 2000;45(1):13–21. [DOI] [PMC free article] [PubMed] [Google Scholar]
- 24.Lundell A, Bergqvist D, Mattsson E, Nilsson B. Volume blood flow measurements with a transit time flowmeter: an in vivo and in vitro variability and validation study. Clinical physiology 1993;13(5):547–557. [DOI] [PubMed] [Google Scholar]
- 25.Drost CJ. Vessel diameter-independent volume flow measurements using ultrasound. Proc San Diego Biomed 1978;17:299–302. [Google Scholar]
- 26.Warmuth C, Nagel S, Hegemann O, Wlodarczyk W, Lüdemann L. Accuracy of blood flow values determined by arterial spin labeling: a validation study in isolated porcine kidneys. Journal of Magnetic Resonance Imaging: An Official Journal of the International Society for Magnetic Resonance in Medicine 2007;26(2):353–358. [DOI] [PubMed] [Google Scholar]
- 27.Lemoine S, Papillard M, Belloi A, Rognant N, Fouque D, Laville M, Rouvière O, Juillard L. Renal perfusion: noninvasive measurement with multidetector CT versus fluorescent microspheres in a pig model. Radiology 2011;260(2):414–420. [DOI] [PubMed] [Google Scholar]
- 28.Artz NS, Wentland AL, Sadowski EA, Djamali A, Grist TM, Seo S, Fain SB. Comparing kidney perfusion using noncontrast arterial spin labeling MRI and microsphere methods in an interventional swine model. Investigative radiology 2011;46(2):124. [DOI] [PMC free article] [PubMed] [Google Scholar]
- 29.Morel O, Pachy F, Chavatte‐Palmer P, Bonneau M, Gayat E, Laigre P, Evain‐Brion D, Tsatsaris V. Correlation between uteroplacental three‐dimensional power Doppler indices and true uterine blood flow: evaluation in a pregnant sheep model. Ultrasound in Obstetrics and Gynecology 2010;36(5):635–640. [DOI] [PubMed] [Google Scholar]
- 30.Sridharan A, Eisenbrey JR, Liu J-B, Machado P, Halldorsdottir VG, Dave JK, Zhao H, He Y, Park S, Dianis S. Perfusion estimation using contrast enhanced three-dimensional subharmonic ultrasound imaging: an in vivo study. Investigative radiology 2013;48(9):654. [DOI] [PMC free article] [PubMed] [Google Scholar]
- 31.Acharya G, Sitras V, Erkinaro T, Mäkikallio K, Kavasmaa T, Päkkilä M, Huhta J, Räsänen J. Experimental validation of uterine artery volume blood flow measurement by Doppler ultrasonography in pregnant sheep. Ultrasound in Obstetrics and Gynecology: The Official Journal of the International Society of Ultrasound in Obstetrics and Gynecology 2007;29(4):401–406. [DOI] [PubMed] [Google Scholar]
- 32.Forsberg F, Liu J-B, Shi WT, Ro R, Lipcan KJ, Deng X, Hall AL. In vivo perfusion estimation using subharmonic contrast microbubble signals. Journal of ultrasound in medicine 2006;25(1):15–21. [DOI] [PubMed] [Google Scholar]
- 33.Kripfgans OD, Rubin JM, Hall AL, Gordon MB, Fowlkes JB. Measurement of volumetric flow. Journal of ultrasound in medicine 2006;25(10):1305–1311. [DOI] [PubMed] [Google Scholar]
Associated Data
This section collects any data citations, data availability statements, or supplementary materials included in this article.


