

Summary
Since small molecule activators of adenylyl cyclases (AC) impact ACs cell-wide, it is challenging the explore the signaling consequences of AC activity emanating from specific intracellular compartments. We explored this issue using a series of engineered, optogenetic, spatially-restricted, photoactivable adenylyl cyclases (PACs) positioned at the plasma membrane (PM), the outer mitochondrial membrane (OMM), and the nucleus (Nu). The biochemical consequences of brief photostimulation of PAC is primarily limited to the intracellular site occupied by the PAC. By contrast, sustained photostimulation results in distal cAMP-signaling. Prolonged cAMP generation at the OMM profoundly stimulates nuclear PKA activity. We’ve found that phosphodiesterases 3 (OMM and PM) and 4 (PM) modulate proximal (local) cAMP-triggered activity, whereas phosphodiesterase 4 regulates distal cAMP activity as well as the migration of PKA’s catalytic subunit into the nucleus.
Keywords: Optogenetics, Second Messengers, Protein kinases, Phosphodiesterases, Signaling
eTOC Blurb
O’Banion et al. describe the engineering of organelle-directed optogenetic adenylate cyclases and the intra- and inter-organelle biochemical consequences of their photo-activation.
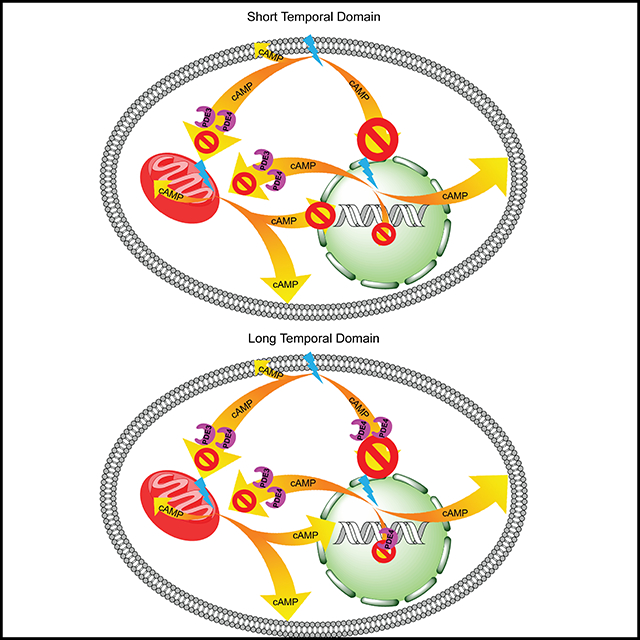
Graphical Abstract
Introduction
Cyclic adenosine monophosphate (cAMP) is a ubiquitous second messenger involved in a wide variety of cellular processes. Although it is present throughout the cell, the consequences of its actions are profoundly subcellular site-specific. For example, cAMP signaling at mitochondria regulates mitochondrial dynamics (Cribbs and Strack, 2007; Monterisi et al., 2017), metabolism (Rinaldi et al., 2018), and cell survival/death (Cribbs and Strack, 2007; Monterisi et al., 2017). By contrast, cAMP signaling in the nucleus (Nu) modulates gene expression (Gonzalez and Montminy, 1989) whereas signaling at the plasma membrane (PM) controls vesicle secretion (Steuer Costa et al., 2017) and axonal branching (Zhou et al., 2016). There are four known downstream effectors of cAMP: the cAMP-dependent protein kinase (PKA), exchange proteins activated by cAMP, cyclic nucleotide gated ion channels, and Popeye domain containing proteins. Of these four effectors, the cAMP-triggered PKA pathway is, by far, the most thoroughly examined. Nonetheless, the complexity associated with PKA-mediated signaling is attributable, in no small part, to the extraordinary array of PKA substrates that vary as a function of distinct cellular compartments. Indeed, a complete accounting of the downstream effectors of the cAMP/PKA pathways and their impact on cellular behaviors remain to be fully resolved on this, the 50th anniversary of PKA’s discovery (Walsh et al., 1968).
Distinct subcellular behaviors are typically presumed to be mediated, at least in part, by spatially proximate signaling pathways. For example, the adenylyl cyclases (ACs), which are positioned at various subcellular sites, are responsible for the local production of cAMP (Steegborn, 2014). In addition, A-kinase anchoring proteins (AKAPs) confine PKA to well-defined subcellular locations and also serve as scaffolds for signaling microdomains containing regulatory molecules and substrates. PKA is present as a tetrameric holoenzyme composed of two regulatory (R) subunits and two catalytic (C) subunits. Binding of cAMP to the R subunits induces a conformational change that releases the C subunit, enabling it to phosphorylate nearby substrates. Although the model of spatially-confined cAMP signaling domains is well accepted (Filadi et al., 2017), the mechanism by which cAMP’s impact is spatially delimited continues to be the subject of intense scrutiny. For example, it has been proposed that the action of readily diffusible cAMP is constrained by local buffering capacity (i.e. neighboring cAMP-binding proteins), by phosphodiesterases (PDEs) (Lomas and Zaccolo, 2014), and/or by intracellular physical impediments (tortuosity) (Richards et al., 2016). Genetically-encoded cAMP and PKA reporters, which were introduced nearly two decades ago, have been used to support the notion of localized cAMP/PKA signaling. These reporters have been primarily used to detect cAMP/PKA signaling induced by isoproterenol (ISO), forskolin (FSK) or various cell permeable cAMP derivatives. These small molecules elicit a global cellular activation of cAMP/PKA. However, simultaneous signaling at multiple sites serves as a significant impediment for characterizing the impact of site-specific activity on the proximal and distal biochemistry and behavior of the cell.
Light-responsive, genetically-encoded (optogenetic) proteins offer the means to control signaling pathway activity with high spatial and temporal resolution (O’Banion and Lawrence, 2018). For example, we recently described the design and characterization of an optogenetic PKA (O’Banion et al., 2018). This species can be recruited to either the outer mitochondrial membrane (OMM) or the plasma membrane (PM), thereby furnishing organelle-selective phosphorylation of substrates. The production of cAMP has likewise been triggered in a light-mediated fashion. Photoactivated adenylyl cyclases (PACs), including bPAC from the bacterium Beggiatoa spp. (Jansen et al., 2017; Tsvetanova and von Zastrow, 2014; Xiao et al., 2015), have been procured from single cell organisms (Blain-Hartung et al., 2018; Ohki et al., 2016; Schröder-Lang et al., 2006; Tanwar et al., 2017). We report herein the design, expression and application of a set of PM, OMM, and Nu targeted PACs for controlling cAMP signaling. As expected, photoactivation of a compartment-localized PAC triggers the phosphorylation of the PKA sensor occupying that compartment. However, we have also found that localized cAMP production can influence distal cellular compartments. Finally, we’ve identified the PDEs that constrain subcellular cAMP signaling.
RESULTS AND DISCUSSION
Generation and characterization of stable PAC MVD7cell lines
We employed the light activatable adenylyl cyclase, bPAC from Beggiatoa spp. (Stierl et al., 2011), to generate PACs targeted to the OMM, PM, or Nu. The mitochondrial localization sequence (MLS) was derived from the first 30 amino acids of AKAP1 (Ma and Taylor, 2002), the PM targeting sequence from the K-Ras CAAX (Apolloni et al., 2000), and the nuclear localization sequence (NLS) from the SV40 large T antigen NLS (Kalderon et al., 1984). In addition, the fluorescent protein mCherry is fused to the N-terminus of bPAC in all constructs to assist in visualizing localization (Figure 1). These constructs were introduced into a lentiviral vector under control of the MCSV 5’ LTR promoter for moderate levels of expression (Cai et al., 2007). Stable MVD7 cell lines were generated via lentiviral transduction and subsequently enriched by fluorescence activated cell sorting (FACS). Western blot analysis of lysates from stably transfected cells revealed similar levels of expression for each engineered PAC (Figure S1). Colocalization analysis of OMM-PAC compared to the mitochondrial Hsp60 confirms that OMM-PAC is positioned at the mitochondria (Pearson’s coefficient: 0.926 ± 0.033) (Figure 1). By contrast, in the case of PM-PAC expressing MVD7 cells, although the majority of PM-PAC is positioned at the PM, some mCherry fluorescence is detected in the cytosol. Quantification of the membrane bound proportion of PM-PAC was determined via cell fractioning by ultracentrifugation and Western blot analysis. Membrane and soluble fractions were assayed for PM-PAC expression and compared to the distribution of PM localized Na+/K+ ATPase alpha subunit. PM-PAC displays a similar cellular distribution to that of the Na+/K+ ATPase alpha subunit, with 66% and 77% membrane-bound, respectively (Figure S1). By comparison, 98% of GAPDH immunoreactivity is found in the soluble fraction (Figure S1). Finally, Nu-PAC is highly localized in the nucleus of stable Nu-PAC-expressing cells. All PAC constructs display a similar jump in adenylyl cyclase activity (20 – 75-fold) to a 10 s pulse of 440 nm LED light (4.1 ± 0.2 μW mm−2) relative to the dark (Figure 1). cAMP quantities produced under dark conditions by OMM-PAC, PM-PAC, and Nu-PAC cells are 0.23 ± 0.05, 0.22 ± 0.06, or 0.22 ± 0.01 pmol/mg protein, respectively. This cAMP quantity is similar to that produced by resting nontransfected MVD7 cells (Table S1). Upon exposure to a single 10 s pulse of 440 nm light, cAMP production in OMM-PAC, PM-PAC, or Nu-PAC cells increases to 11.35 ± 0.86, 4.47 ± 0.18, and 17.08 ± 1.24 pmol/mg protein, respectively. Inhibition of PDE activity with isobutyl methylxanthine (IBMX), a broad spectrum PDE inhibitor, followed by a 10 s pulse of light generates nearly identical levels of cAMP regardless of PAC localization (OMM-PAC = 19.69 ± 3.56, PM-PAC = 16.44 ± 1.12, and Nu-PAC = 18.15 ± 1.10 pmol/mg protein; Figure 1) consistent with the notion that the targeted PACs have the same cyclase activity. It is important to note that a 10 s light pulse is necessary to elicit a detectable response by cAMP ELISA. Experiments using a 1 s pulse are below the detection limit of the assay (data not shown) but a 1 s pulse is sufficient to drive PKA activity (vide infra). In addition, we examined a more robust photoactivation protocol that involved a 20 min light pulse regimen (two 10 s pulses per min) in the absence or presence of IBMX. Under these conditions, IBMX enhances cAMP production in cells expressing OMM-PAC [(−) and (+) IBMX: 38.90 ± 0.13 versus 48.00 ± 2.67 pmol cAMP/mg protein, respectively], PM-PAC [(−) and (+) IBMX: 8.01 ± 1.36 versus 16.89 ± 2.36 pmol cAMP/mg protein, respectively], and Nu-PAC [(−) and (+) IBMX: 23.19 ± 2.60 versus 27.21 ± 4.98 pmol cAMP/mg protein, respectively] (Figure S1). For comparison, nontransfected MVD7 cells treated with 10 μM FSK or 1 μM ISO, produce an increase in cAMP levels of up to three orders of magnitude (Table S1). In short, the quantity of cAMP generated by spatially localized optogenetic bPACs is well below the levels triggered by cell-wide acting pharmacological agents.
Figure 1. Design and characterization of subcellular targeted PACs.

A) Schematic representation of PAC construct architecture. Top: The mitochondrial localization sequence (MLS) was derived from the first 30 amino acids of AKAP1 (Ma and Taylor, 2002). Middle: The nuclear localization sequence (NLS) is the SV40 large T antigen NLS (Kalderon et al., 1984). Bottom: The K-Ras CAAX sequence was used for PM targeting (Apolloni et al., 2000). B) Representative immunofluorescent images confirming localization and expression of targeted PACs (for details see STAR Methods) Scale bar = 20 μm. C) Quantification of light mediated generation of cAMP in cells. MVD7 cells stably expressing PACs were treated where indicated with 10 μM IBMX for 2 min prior to illumination with 440 nm LED light for 10 s. Cells were lysed 10 s after the cessation of illumination (20 s total reaction time) and cAMP concentration was assayed via ELISA.
Assessment of localized PAC activation on subcellular PKA activity
We previously described reporters designed to detect PKA activity at specific subcellular sites (O’Banion et al., 2018). In brief, these reporters are comprised of a sequence derived from the vasodilator-stimulated phosphoprotein (VASP), a PKA-specific substrate (at Ser157) (Lambrechts et al., 2000). The reporter can be positioned the PM (O’Banion et al., 2018), the OMM (O’Banion et al., 2018), or the Nu (Belin et al., 2013) using targeting sequences (Figure 2A). The PM and OMM-targeted reporters have been previously shown to be localized to the desired sites in MVD7 cells (O’Banion et al., 2018). The Nu reporter, which employs the NLS from the SV40 large T antigen, exhibits a pronounced localization to the Nu (Figure 2B).
Figure 2. Design and characterization of Nu-PKA-Reporter and Calibration of the PM-, OMM-, and Nu-PKA-Reporters.

A) Schematic representation of the PKA reporter. B) Confocal images of Nu-PKA-Reporter indicating localization and PKA-dependent phosphorylation. Scale bar = 20 μm. C) Western blot of PKA-dependent phosphorylation of Nu-PKA-Reporter. Top panel of Western blot = phosphorylated reporter. Bottom panel of Western blot = total reporter as assessed by an appended HA tag. All samples were treated with 10 μM forskolin, 500 μM 8Br-cAMP, or 10 μM H-89 for 2 min followed by 10 μM forskolin for 30 min before fixation or lysis for analysis by Western blot, respectively. D) Quantification of the Western blot from C. E) Calibration of reporter phosphorylation using Phos-tag gels. Left: OMM, PM, and Nu-PKA-Reporters are black, blue and red, respectively. λ-PHOS = lambda phosphatase, NT = no treatment, FSK = 10 μM forskolin, PKA-C = protein kinase A catalytic subunit. Cells expressing the PKA reporters were exposed or unexposed to FSK prior to lysis. Reporters were purified from cell lysates via immunoprecipitation with HA-Agarose. For minimum and maximum phosphorylation levels, reporters were treated with λ-PHOS or PKA-C while on resin, respectively. The proportion of phosphorylation is equal to the higher molecular weight band (phosphorylated) divided by the sum of the two bands (total reporter). Right: representative image of Phos-tag blots used for quantification.
MVD7 cells lack all VASP family member proteins (Bear et al., 2000). Consequently, a commercially available phosphoVASPS157 antibody can be used to quantify PKA-Reporter phosphorylation by immunofluorescence without interference from endogenous VASP. We’ve previously shown that exposure of MVD7 cells to the AC activator, FSK, results in the phosphorylation of the OMM-PKA-Reporter and the PM-PKA-Reporter (O’Banion et al., 2018). In the current study, we’ve observed analogous results in MVD7 cells expressing the Nu-PKA-Reporter (Figures 2B–C). The PKA-dependence of Nu-PKA-Reporter phosphorylation is consistent with our observation that FSK-induced phosphorylation is blocked when cells are incubated the PKA inhibitor H89 (Figures 2B–C).
We have found that the basal (dark) level of phosphorylation of the PM-PKA-Reporter is much higher than that of its OMM or Nu counterparts: PM-PKA-Reporter (42.0 ± 5.3%) versus Nu-PKA-Reporter (5.4 ± 1.7%) and OMM-PKA-Reporter (11.2 ± 2.1%) (Figure S2A). These results are given relative to FSK-induced cAMP production. The apparent higher basal PKA activity at the PM agrees with our previous observations (O’Banion et al., 2018) as well as other reports that the PM domain has higher resting cAMP levels than elsewhere in the cell (Musheshe et al., 2018). In order to calibrate our PKA-Reporters and confirm that each construct is similarly sensitive to PKA phosphorylation, we purified reporters from untreated or FSK treated cells and quantified the absolute levels of phosphorylation by electromobility shift using Phostag gels. These experiments revealed that treatment with FSK triggers similar levels of PKA-Reporter phosphorylation amongst the three different reporter constructs (Figure 2E): 42.6 ± 4.7, 48.4 ± 2.7, and 36.9 ± 4.4% absolute phosphorylation of the OMM, PM, and Nu-PKA-Reporters respectively. Furthermore, we validated that each reporter can be phosphorylated and dephosphorylated to the same extent. The purified reporters on resin were exposed to either PKA-C subunit or the nonspecific λ-phosphatase. The PKA-C subunit furnishes a nearly 90% absolute phosphorylation for each reporter. By contrast, phosphatase treatment reduces reporter phosphorylation levels to 5% or less.
The differential impact of brief (1 s) compartmentalized PAC photo-stimulation on subcellular PKA-activity
For our initial studies, we stimulated cells containing spatially localized bPAC and localized PKA-Reporter with a single 1 s pulse of light. The cells were subsequently lysed at various time points following illumination and the level of reporter phosphorylation quantified via Western blot analysis (Figure 3).
Figure 3. Brief stimulation of PAC expressing cells results in differential responses.

A) Schematic of single pulse experiments indicating the time of stimulus and timepoints at which samples were lysed for analysis by Western blot. B) Plots showing activation of PKA at specific subcellular locations after a 1 s pulse of 440 nm light when PAC is expressed at the OMM (black), PM (blue) or Nu (red). C) Plots visualizing non-illuminated (black) versus illuminated maximal (red) reporter phosphorylation at specific subcellular locations when PAC is expressed at the indicated location. Note that maximal reporter phosphorylation at the Nu or PM is 20 s after stimulation but maximal phosphorylation at the OMM is 70 s after stimulation. *Indicates statistical significance by multiple t-tests (P < 0.05) and ## indicates statistical significance by two-way ANOVA followed by Tukey’s multiple comparisons test (P < 0.05). All data presented as mean ± SEM. N = 3. D) Representative confocal images of PKA isoform distribution in non-transfected non-illuminated WT MVD7 cells. ROI panels show ROIs used for quantifying subcellular PKA distribution. Cyan = outer perimeter of cell, Yellow = inner perimeter of cell, Red = mitochondria, Green = nucleus. Graphs below images display subcellular distribution of PKA subunits quantified from single optical sections. Fluorescence density was calculated by dividing the integrated density of the ROI by the area of the ROI and determining the proportion of fluorescent density per compartment within each cell. N = 10 cells per PKA subunit. Data presented as mean ± SD with data points overlaid.
Impact of photostimulation on Nu PKA activity
A single 1 s light pulse fails to induce any significant change in the phosphorylation status of the Nu-PKA-Reporter irrespective of the source of cAMP (i.e. the OMM, the PM, or the Nu) (Figure 3A). Previous studies have demonstrated that exogenously applied FSK does induce Nu PKA activity, but only after long term stimulation (~20 min) (Allen and Zhang, 2006; Zhang et al., 2001).
Impact of photostimulation on PM PKA activity
A single 1 s light pulse generates a rapid increase in the level of phosphorylation for the PM-PKA-Reporter. Furthermore, the rate of light-triggered PM-PKA-reporter phosphorylation is the same in cells expressing PM-PAC or OMM-PAC. Maximal levels of reporter phosphorylation occur within 20 s following light stimulation, with phosphorylation levels analogous to those observed with FSK-treated cells. By contrast, although Nu-PAC triggers PM-PKA-reporter phosphorylation, maximal phosphorylation is delayed (40 s after photo-stimulation) relative to that observed for PM-PAC or OMM-PAC (20 s after photo-stimulation).
Impact of photostimulation on OMM PKA activity
Photoactivation of PAC at the OMM in cells expressing the OMM-PKA-Reporter results in maximal phosphorylation at 70 s (62.8 ± 5.3% of FSK controls) following photo-stimulation (Figure 3B). By contrast, cells expressing cAMP at the PM or the Nu have a less robust impact on OMM-PKA-Reporter phosphorylation: 31.0 ± 3.6% (PM-PAC) or 34.4 ± 6.7% (Nu-PAC). In short, PKA activity stimulation, as assessed by OMM-PKA-Reporter activity (Figure 3B), is significantly more robust when both bPAC and the reporter are positioned at the OMM. We note that the dephosphorylation rate of the OMM-PKA-Reporter following a 1 s stimulus is independent of the site of cAMP generation (Figure S2D).
Expression levels and subcellular distribution of PKA subunits
PKA subunit expression levels were determined via RNAseq. Transcriptomic analysis of WT MVD7 cells indicated that the Cα subunit is the most highly expressed C-subunit and RIα is almost exclusively the only RI subunit expressed. RIIβ is expressed at slightly higher levels than RIIα. Localization of PKA subunits was determined via immunofluorescence and confocal microscopy. Cells were stained for C, RI, or RIIβ subunits. Structural markers were Hoechst 33342 (nuclei), Tom20/Hsp60 (mitochondria), and Alexafluor 647 conjugated phalloidin (cell periphery/plasma membrane). Images were automatically segmented using Otsu thresholding and the integrated density of the C, RI, and RIIβ subunits for each subcellular region calculated (for details see STAR Methods). The C, RI, and RIIβ subunits are present in all four compartments examined, namely the nucleus, mitochondria, plasma membrane, and cytoplasm (Figure 3D).
Only OMM-positioned PAC stimulates Nu PKA activity in response to prolonged (20 min) illumination
In the absence of any appreciable Nu-PKA-Reporter phosphorylation after a 1 s light pulse, we extended the photoactivation protocol to two 10 s pulses per min over 20 min (Figure 4A). Previous studies have demonstrated that prolonged exposure (~20 min) to an AC stimulus is required in order to induce the phosphorylation of Nu-based PKA sensors (Allen and Zhang, 2006; Zhang et al., 2001). Indeed, we confirmed these previous results using our Nu-PKA-Reporter upon FSK exposure (Figure 2). In marked contrast, only photo-stimulation of OMM-PAC is sufficient to drive Nu-PKA-Reporter phosphorylation in a time dependent manner (Figure 4B). Neither Nu-PAC nor PM-PAC stimulation over 20 min results in significant Nu-PKA-Reporter phosphorylation. These results appear to confirm, at least in part, the observations of others concerning PKA-catalyzed CREB phosphorylation, which transpires in the Nu (Sassone-Corsi, 2012). There is mounting evidence that cAMP signaling to the Nu occurs through sustained signaling during GPCR endocytosis. In particular, AC activity at the PM does not support CREB phosphorylation, whereas AC activity at endosomes does (Tsvetanova and von Zastrow, 2014). We confirm that PM AC activity fails to generate significant PKA activity in the Nu in the absence of PDE inhibitors (vide infra). Furthermore, since both endosomal and OMM generated cAMP drives Nu PKA activity, this suggests the existence of a PM constraint that limits the Nu reach of PM generated cAMP.
Figure 4. Sustained stimulation of PAC at the OMM, but not at the PM or in the Nu, furnishes Nu-PKA-Reporter phosphorylation.

A) Schematic of experimental protocol. Cells were pulsed twice per minute for a total of 10 s each, of 440 nm light at the indicated time points before lysis and analysis by Western blot. B) Nu-PKA-Reporter phosphorylation levels upon stimulation with 440 nm light in cells expressing PAC at different locations. There is an apparent upward trend of Nu-PKA-Reporter phosphorylation in Nu and PM-PAC cells however, these results are statistically insignificant. By contrast, illuminated OMM-PAC-expressing cells trigger statistically significant Nu PKA as assessed by Nu reporter phosphorylation. Western blots at bottom are representative data of quantification above. *Indicates statistical significance by two-way ANOVA followed by Sidak’s multiple comparisons test (P < 0.05). Results presented as mean ± SEM. N = 3
Finally, there are several conflicting reports concerning the possible presence of the PKA holoenzyme in the nuclear compartment (Harootunian et al., 1993; Mayr and Montminy, 2001; Sample et al., 2012). We have found that Nu generated cAMP fails to drive Nu PKA activity. We do note that immunostaining reveals the presence of modest quantities of C and R subunits in the nuclear compartment (Figure 3D). The failure to observe phosphorylation of the Nu-PKA-Reporter (upon photo-stimulation of Nu-PAC) could be due to the presence of a Nu PKA that does not respond to cAMP, the presence of Nu PDEs (vide infra), and/or the presence of Nu protein phosphatases that rapidly hydrolyze phospho-Nu-PKA-Reporter. By contrast, Nu-PKA-Reporter phosphorylation is only observed when the levels of cytoplasmic cAMP are sufficiently high enough to drive cytoplasmic C subunit into the Nu (vide infra).
PDEs constrain the effects of brief (1 s) photo-stimulation of PAC
Given the likely role of PDEs in modulating the distal effects of cAMP generated at distinct subcellular locations, we employed IBMX, a broad spectrum PDE inhibitor, to assess the impact of PDEs on optogenetically-induced, spatially-generated, cAMP. Cells were treated with IBMX (10 μM) for 2 min prior to brief (a single 1 s light pulse) photo-stimulation. First, IBMX itself has no effect, in the absence of illumination, on the phosphorylation status of the PKA reporter positioned at the Nu, the OMM, or at the PM (Figure S2A). Second, IBMX treatment in combination with illumination generates a significant increase in phosphorylation of the OMM-PKA-Reporter regardless of the location of PAC (Figure 5B). Third, with one exception, the Nu-PKA-reporter is poorly phosphorylated upon exposure to a single 1 s light pulse, whether in the presence or absence of IBMX. We do observe a modest increase in the phosphorylation status of the Nu-PKA-Reporter when PAC is positioned at the OMM: 10.2 ± 1.6% phosphorylation in the absence of IBMX and 20.8 ± 3.7% phosphorylation in the presence of IBMX. Finally, IBMX enhances PM-PKA-Reporter phosphorylation when cAMP is generated at the PM (Figure 5B). These results indicate that, for short second messenger timescales, PDE activity functions to constrain both local and global cAMP signaling.
Figure 5. Global PDE inhibition reveals PDE-constrained PKA activity.

A) Time course plots for single pulse experiments grouped by reporter localization. Cells were pre-equilibrated with 10 μM IBMX for 2 min prior to 1 s photo-stimulation and subsequent lysis at indicated timepoints for Western blot analysis. OMM-PAC (black), PM-PAC (blue), and Nu-PAC (red). B) Comparison between maximal reporter phosphorylation for each reporter at t = 20 s for PM and Nu reporter and t = 70 s for OMM reporter after illumination in the presence (red) or absence (black) of 10 μM IBMX. *Indicates significant difference by t-test (P < 0.05). C) Effect of 10 μM IBMX (red) on Nu-reporter phosphorylation after two 10 s pulses per min for the indicated times. PDE inhibition with IBMX results in a significant increase in Nu-PKA-Reporter phosphorylation when PAC is expressed at the Nu or PM relative to no IBMX (black). *Indicates significant difference by two-way ANOVA followed by Dunnett’s multiple comparisons (P < 0.05). All data reported as mean ± SEM. N = 3
PDEs constrain the effect of cAMP on Nu PKA activity during prolonged (20 min) photo-stimulation of PAC
IBMX, in combination with prolonged photo-stimulation (20 min), triggers a significant increase in Nu-PKA-Reporter phosphorylation. This is true when cAMP generated at the PM (2.5-fold increase in Nu-PKA-Reporter phosphorylation), at the OMM (17% increase in Nu-PKA-Reporter phosphorylation), or in the Nu (2-fold increase in Nu-PKA-Reporter phosphorylation) (Figure 5C). These results confirm that PDEs constrain potential distal effects of cAMP during persistent signaling events.
PDE3 and PDE4 modulate the cAMP stream generated at the OMM
We probed the specific PDEs responsible for the identified cAMP subcellular domains via the use of PDE-selective inhibitors. Cyclic nucleotide PDEs are comprised of eleven families with multiple isoforms and splicing variants within each family. PDEs 1, 2, 3, 10 and 11 catalyze the hydrolysis of both cAMP and cGMP, PDEs 4, 7, and 8 are cAMP specific, and PDEs 5 and 6 are cGMP specific (Conti, 2000). Consequently, we investigated PDEs 4, 7 and 8 as potential regulators of intercompartmental cAMP signaling in MVD7 cells. In addition, we decided to include PDEs 2 and 3 as well for the following reasons: Although PDE2 exhibits a higher affinity for cGMP than for cAMP, PDE-catalyzed cAMP hydrolysis is stimulated by cGMP (Stenson et al., 2010). Furthermore, PDE2 isoforms have been identified as being localized to mitochondria and shown to regulate cAMP-dependent mitochondrial processes (Acin-Perez et al., 2011). PDE3 is another dual-specificity PDE, but exhibits 4 – 10 fold higher preference for cAMP hydrolysis over cGMP and is highly expressed in many cell types (Degerman et al., 1997).
There are a number of commercially available, highly selective, potent PDE inhibitors. We employed the inhibitors for PDEs 3, 4, 7 and 8 described in a recently published phosphoproteomics study on PDE inhibition in Jurkat cells (Beltejar et al., 2017) and a PDE2 inhibitor that has been employed elsewhere (Boess et al., 2004). Given the different names and concentrations used of PDE inhibitors, they will be referred to as PDE2i, 3i, 4i, 7i, and 8i in order to minimize confusion. Each PDE inhibitor is summarized in Table S2, including the concentrations employed.
We first investigated the impact of isoform specific PDE inhibition on cAMP induced PKA activity during brief (single 1 s pulse) photo-stimulation. MVD7 cells expressing PACs and reporters at different locations were equilibrated with PDE inhibitors for 2 min prior to illumination followed by lysis at 40 s and subsequent Western blot analysis of reporter phosphorylation. A more prolonged period of photo-stimulation (10 s of illumination every 30 s for 20 min) was employed to observe PKA activity in the Nu.
Impact of PDE inhibitors on OMM PKA activity
When PAC and the PKA reporter are both expressed at the OMM, a significant increase in OMM-PKA-Reporter phosphorylation is observed with IBMX, PDE2i, PDE3i, PDE4i, and PDE7i (Tables S3 and S4; Figure S3). PKA activity at the OMM is also significantly upregulated in the presence of these inhibitors when PAC is positioned at the PM (Figure S3). Finally, inhibitors of PDEs 3 and 4 generate a significant increase in OMM PKA activity when the PAC is expressed in the Nu (Tables S3, and S4; Figure S3). Indeed, PDEs 3 and 4 appear to have the greatest impact on OMM-PKA-Reporter phosphorylation irrespective of where cAMP is generated in the cell (Figure 6A). We do note that PDE4A and PDE4B are known to be associated with mitochondria and mitochondrial AKAPs (Asirvatham et al., 2004; Millar, 2005). While there are no reports of PDE3 family gene products being directly associated with mitochondria, links between PDE3 and mitochondrial function have been described (Chung et al., 2015; Whitaker et al., 2013).
Figure 6. Isoform-specific inhibition reveals PDEs 3 and 4 involvement in the OMM compartment and PDE 4 as the major regulator of Nu cAMP/PKA signaling.

A) Plots showing the impact of 1 s photo-stimulation on OMM-PKA-Reporter phosphorylation as a function of PAC subcellular location in the presence of PDE inhibitors (pre-equilibrated for 2 min prior to illumination). Cells were lysed 40 s after illumination. See Table S3 for summary of results. B) Plots showing the impact of 20 min of two 10 s pulses of 440 nm light per min on Nu-PKA-Reporter phosphorylation as a function of PAC subcellular location in the presence of indicated PDE inhibitors (pre-equilibrated for 2 min prior to illumination). *Indicates significant difference by one-way ANOVA followed by Dunnett’s multiple comparisons (P < 0.05). All data reported as mean ± SEM. N = 3. See Table S4 for summary of results. C) PDE expression and distribution. Top left: RNAseq data showing expression levels of PDE isoforms in WT MVD7 cells. Data reported as mean ± SD. N = 3. Top middle: Subcellular distribution of PDE4 isoforms in WT MVD7 cells. Blue, red, and green are PDE4A, PDE4B, and PDE4D respectively. N = 10 – 19 cells per group. *Indicates significant difference by multiple t-tests (P < 0.001). Top right: Comparison between mean fluorescent signals for PDE4 isoform staining and secondary antibody signal. Bottom: representative images for PDE4 isoform expression and distribution in MVD7 cells. Secondary only green and red image intensity was scaled to the same display parameters as PDE4D images. Scale = 20 μm.
Impact of PDE inhibitors on PM PKA activity
Several of the PDE-specific inhibitors enhance PM PKA activity when PAC is also positioned at the PM (Tables S3 and S4; Figures 6, S5, and S6). By contrast, none of these inhibitors enhance PM PKA activity for PACs at the OMM or Nu (Tables S3 and S4). Surprisingly, there is a decrease in PM-reporter phosphorylation in the presence of a PDE7 inhibitor in Nu-PAC cells. The mechanism by which this transpires remains to be resolved.
Impact of PDE inhibitors on Nu PKA activity during brief and prolonged photo-stimulation
As noted in Fig. 3B, PKA-dependent phosphorylation of the Nu-PKA-Reporter is minimal after a single 1 s pulse of light. The presence of isoform-selective PDE inhibitors has little impact on Nu-PKA-Reporter phosphorylation status in response to brief cAMP signaling. By contrast, prolonged cAMP production (20 min) furnishes clear functional differences for the various PDEs. In particular, irrespective of where cAMP is generated in the cell, PDE4 serves as the primary regulator controlling Nu PKA activity under conditions of sustained cAMP signaling (Table S4).
Finally, we also examined the impact of the 20 min photo-stimulation protocol on PKA activity at the OMM and PM. In general, the influence of the various isoform-selective PDE inhibitors parallels the results obtained with 1 s photo-stimulation. The primary observed difference between brief and prolonged illumination is the more extensive phosphorylation of the PKA reporter induced by sustained PAC activity.
PDE expression levels and PDE4 subcellular distribution
We performed RNA-Seq in order to quantify the relative expression levels of PDE transcripts in order to gain insight into our results implicating PDEs 3 and 4 in regulating spatially generated cAMP signals. No transcripts were detected for Pde7b. Pde2a, 3a, and 4c transcripts are nearly absent while Pde4b, 4d, and 8b transcripts are expressed at modest levels. Pde3b, 4a, 7a, and 8a are the highest expressed transcripts (Figure 6C). The relatively high expression levels of Pde3 and 4 isoforms confirms our functional data supporting the roles of PDE3 and 4 proteins in regulating spatial cAMP signaling. Interestingly, in spite of the presence of Pde7a and 8a transcripts, PDE7 and 8 inhibitors have little impact on spatially discrete cAMP signaling (Tables S3 and S4). This suggests that these PDE isoforms do not modulate cAMP-triggered biochemical activity at the OMM, PM, or Nu.
Given that PDE4 has the greatest effect on spatially segregated cAMP signaling as described above, we assessed the subcellular distribution of PDE4A, PDE4B, and PDE4D in WT MVD7 cells by immunofluorescence (Figure 6C). PDE3 isoform subcellular distribution was not quantified due to the absence of commercially available PDE3 antibodies with reactivity in mouse for immunofluorescence. Quantification of subcellular localization was performed as described for PKA subunit subcellular localization. All PDE4 isoforms are distributed between subcellular compartments with the only statistical difference arising from a decreased amount of PDE4D in the nuclear compartment relative to PDE4A and PDE4B (multiple t-tests, P < 0.001). On a qualitative level, PDE4A is diffusely distributed across the entire interior of the cell with no clear localization. PDE4B is primarily diffuse, however small islands of increased PDE4B immunoreactivity are observed in the nuclear compartment. Finally, PDE4D is almost completely excluded from the nucleus and is primarily cytosolic with some staining in a perinuclear ring. These results are in agreement with PDE4 localization experiments from other reports that found PDE4B to be present in the nucleus and PDE4D to be excluded from the nuclear compartment (Huston et al., 2008). Due to the diffuse nature of PDE4A and PDE4B staining we compared the images to cells stained with secondary antibody only (no primary antibody) and found that the signals from PDE antibody staining are at least double those of nonspecific staining from secondary only samples (Figure 6C) indicating that the staining is specific for the PDEs of interest.
PDE4 acts as a gatekeeper for the nuclear translocation of the PKA catalytic subunit from the cytoplasm
Early studies of PKA signaling in the Nu established that the C subunit is capable of diffusing into and out of the Nu after microinjection of free C subunit (Harootunian et al., 1993) or upon stimulation of endogenous PKA by pharmacological agents (Meinkoth et al., 1990; Nigg et al., 1985). The R subunit is not present in the Nu, remains on the cytoplasmic side of the Nu, and cannot exit the Nu if microinjected into the Nu (Fantozzi et al., 1994). However, more recent studies suggest that there may be a resident pool of PKA holoenzyme in the Nu (Sample et al., 2012). Given our findings that PDE inhibition can augment Nu PKA activity depending on where cAMP is generated, we investigated the effect of site-specific cAMP generation on PKA nuclear migration.
The experimental strategy used to investigate the effect of PDE family inhibition on Nu PKA activity was employed to visualize catalytic subunit translocation as well, except that the endogenous C subunit was immunostained following treatment. The nuclear to cytoplasmic ratios of the C subunit were calculated and compared to assess the impact of PDE inhibitors. We employed the prolonged (20 min) photo-stimulation protocol for these studies since this timeframe is required for the robust phosphorylation of the Nu-PKA-Reporter. As expected, FSK treatment is sufficient to drive C subunit migration to the Nu (Figure 7 and Figure S7). To a lesser extent, this is true for treatment with the non-selective PDE inhibitor IBMX as well. Photo-generation of cAMP at the OMM likewise produces a robust translocation of C subunit from the cytoplasm to the Nu. By contrast, cAMP produced in the Nu or at the PM has little effect on the Nu/cytoplasmic spatial location of PKA’s catalytic subunit. These results are consistent with those obtained using the Nu-PKA-Reporter (Figure 4): OMM-PAC furnishes significant Nu-PKA-Reporter phosphorylation, whereas Nu-PAC and PM-Pac do not. We also examined the effect of photo-stimulation in the presence of the various isoform-selective PDE inhibitors. As we previously observed using the PKA reporters, cytoplasm-to-Nu translocation is augmented by PDE4i, irrespective of where cAMP is generated. Other PDEs contribute, to a lesser extent, to compartmentalizing cAMP. In particular, PDE7 for the OMM-PAC and PDE2 for the PM-PAC serve as modest constraints on cAMP-induced PKA activity (Table S5).
Figure 7. PDE4 is the major regulator of PKA C subunit translocation to the Nu.

A) Quantification of nuclear translocation of PKA C subunit in cells expressing OMM, PM, or Nu-PAC after illumination. Cells were photo-stimulated with two 10 s pulse per min for 20 min after pre-equilibration with PDE inhibitors. Cells were then fixed and PKA C subunit detected by immunofluorescence. Automated image analysis was performed to determine the nuclear to cytoplasmic ratio of PKA C subunit for each cell. N > 32 cells per group. *Indicates significant difference by t-test (P < 0.05). Comparison of the Nu/Cyto ratio after light exposure shows PDE4 inhibition leading to increased PKA C subunit translocation into the Nu regardless of PAC subcellular location. *Indicates significant difference by one-way ANOVA followed by Dunnett’s multiple comparisons (P < 0.05). N > 32 cells per group. B) Representative images of the effect of PDE inhibition on nuclear translocation of PKA C subunit in OMM-PAC expressing cells. All data reported as mean ± SEM.
In summary, IBMX, as well as the PDE4-selelctive inhibitor, plus light induces PKA-C nuclear translocation (Fig. 7) and induces PKA sensor phosphorylation (Fig. 6b). By contrast, in the absence of light, PDE inhibitors alone have a very modest impact on PKA-C nuclear translocation (Fig. S7). These results demonstrate that inhibition of PDE activity alone is insufficient to generate robust PKA-C nuclear translocation and consequent Nu-PKA-Reporter phosphorylation. Rather, enhanced and sustained levels of cAMP are necessary, whether generated by optogenetic constructs (PAC) or in concert with pharmacological (PDE inhibitors or FSK) agents.
STAR Methods
Lead Contact and Materials Availability
Further information and requests for resources and reagents should be directed to and will be fulfilled by the Lead Contact, David S. Lawrence (lawrencd@email.unc.edu). All plasmids will be deposited with Addgene.
Experimental Model and Subject Details
MVD7 cells were a gift from Dr. James E. Bear and are a double knockout VASP and Mena embryonic mouse fibroblast clonal line with no detectable expression of the EVL protein. Cells express a temperature sensitive large T antigen and are grown in DMEM + 10% FBS, 1X GlutaMAX, 1X antimycotic/antibiotic, and 50 IU mouse recombinant interferon-γ at 32 °C in 5% CO2. Sex of these cells is not available (Bear et al., 2000) and these cells have not been tested for mycoplasma. HEK 293T I/17 cells are the I/17 clone of female human embryonic kidney cells and were purchased from the UNC Tissue Culture Facility. Cells grown in DMEM + 10% FBS, 1X GlutaMAX, and 1X PenStrep at 37 °C in 5% CO 2. Cells were tested for mycoplasma by PCR by the UNC Tissue Culture Facility prior to purchase.
Method Details
Cloning
Localized PAC Cloning
Human codon optimized bPAC gene was synthesized by Genscript. bPAC was initially fused to the 3’ end of the Tom20 OMM MLS with a 29 amino acid (GGGGSGGGGSGSGGGGSGSGGGGSGGGGS) linker by overlap extension PCR and cloned into a modified pEF1 (modified from pEF1alpha-MCS-IRES-DsRedExpress2 from Clonetech) vector via EcoRI and BamHI sites at the 5’ and 3’ end respectively. Kpnl and Spel sites were added between the Tom20 MLS and linker region and mCherry was inserted via restriction digest and ligation. The N-terminal AKAP1 OMM targeting sequences was purchased as a gBlock (IDT) with 5’ EcoRI and in-frame 3’ KpnI sites and inserted on the 5’ end of mCherry-bPAC via restriction digest and ligation. Nu-PAC and PM-PAC constructs targeted via the addition of the SV40 large T antigen NLS and kRas CAAX sequences respectively by primer extension PCR. Briefly, the 5’ primer encoded an EcoRI restriction site upstream of a Kozak sequence and contained a gene specific region for mCherry. The 3’ primer encoded the 3’ end of bPAC and localization signals followed by a stop codon and a BamHI restriction site. All constructs were then cloned into a modified pLL 5.5 lentiviral backbone via EcoRI and BamHI digest and ligation. Sequences for the organelle targeted constructs are furnished in the Data S1 file.
PKA-Reporter Cloning and Characterization
The PKA-Reporter was constructed by appending nucleotides encoding the PKA consensus site of the VASP protein (residues 148–164) and 3X NLS to the 3’ end of mTq2 via primer elongation. The construct was cloned by generating a PCR fragment appending an HA-tag preceded by an EcoRI site onto the 5’ end and the VASP 148–164 sequence and NLS followed by a BamHI site onto the 3’ end of mTq2 (a gift from Dr. Theodorus Gadella, University of Amsterdam, Netherlands). The PCR product was digested with EcoRI and BamHI and ligated into a pEFIalpha vector (modified from pEF1alpha-MCS-IRES-DsRedExpress2 from Clonetech) digested with EcoRI and BamHI. The PCR product was digested with EcoRI/BamHI and ligated into a pEFIalpha vector digested with EcoRI/BamHI. Positive clones were identified via restriction digest with EcoRI and BamHI and confirmed via sequencing using a set of sequencing primers (see below) generated for the specific pEFIalpha vector used. The plasmid was then transfected into cells and characterized for 1) subcellular localization via fluorescent microscopy, 2) molecular weight via Western blot, 3) ability to be specifically phosphorylated by PKA via Western blot and immunofluorescence. We detected peptide phosphorylation using a mouse anti-pVASP S157 antibody from abcam (ab58555) at 1:100 or 1:1000 for immunofluorescence and Western blotting respectively.
PKA-Reporter Calibration
MVD7 cells were cultured and transfected with OMM, Nu, or PM-Reporter in 10 cm dishes. 5 mL of media with 100 μM Forskolin and 10 μM IBMX was added to treated samples and 5 mL of untreated media was added to untreated samples, all samples were incubated for 30 min at 32 °C.
Cells were rinsed with cold TBS and lysed with 500 μL of cold M-PER lysis reagent with 2X HALT protease and phosphatase inhibitors without EDTA (ThermoFisher cat. #78445) plus 1% Triton X-100 for OMM-Reporter and PM-Reporter transfected cells. Plates were rocked gently for 5 min at 4 °C, scraped, and lysates were collected and frozen at −80 °C.
Lysates were thawed, mechanically lysed with a 23 gauge needle, and centrifuged at 16,000 × g at 4 °C for 20 min to pellet debris. The protein concentration of all lysates was determined using the Pierce 660 protein assay (ThermoFisher cat. #22660).
25 μL of Anti-HA Agarose resin slurry (ThermoFisher cat. #26181) was added to a spin-column and pelleted for 10 s at 12,000 × g. Resin was washed with one resin volume of TBS and pelleted. Two aliquots of 0.25 mg of total protein was added to a resin column for each lysate and incubated at 4 °C overnight with end-over-end mixing. Resins were pelleted and washed with 400 μL TBS three times.
For each lysate set, one resin sample was treated on resin with an enzyme. For the FSK/IBMX treated lysates, 1 unit of PKA catalytic subunit (Promega V516A) in TBS with 20 mM MgCl2 and 1 mM ATP was added to the resin. For the untreated lysates, 1 μL Lambda Protein Phosphatase (New England Biolabs P0753S) in the provided buffer was added to the resin. All resins not treated with an enzyme were treated with TBS. All resin samples were incubated at 30 °C for 30 min.
Resins were washed with 400 μL TBS-T (TBS with 0.05% Tween-20) three times and a final wash with cold TBS was performed. 50 μL of 2x Laemmli Sample Buffer (Bio-Rad cat. #1610737) was added to each resin and eluate was ran back on resin three times total. 1 mM Dithiothreitol (DTT) was added to each sample and heated at 42 °C for 30 min.
Samples were separated on a SuperSep Phos-tag gel (WAKO Chemical cat. #195–17991) following the manufacturer’s instructions and transferred to a PVDF membrane overnight at 4 °C at 20 V.
Membranes were dried then rewetted and blocked with Li-Cor TBS Odyssey Blocking Buffer (LI-COR cat. #92750000) for 1 h. Membranes were incubated overnight at 4 °C with 10 mL primary antibodies: 1:1000 Mouse anti-pVasp Ser157 (Abcam ab58555) and 1:2000 Rabbit anti-HAtag (Cell Signaling Technologies cat. #3742) in Odyssey Blocking Buffer + 0.1% Tween-20. Membranes were washed three times for 5 min with TBS-Tween and incubated at room temperature for 1 h with 10 mL secondary antibodies: 1:20,000 RDye® 800CW Donkey anti-Mouse IgG (LI-COR cat. #926–32212) and 1:20,000 IRDye® 680RD Donkey anti-Rabbit IgG (LI-COR cat. #926–68973) in Odyssey Blocking Buffer + 0.1% Tween-20 + 0.01% SDS. Membranes were washed three times for 5 mins with TBS-Tween and once with TBS.
Imaging was performed as detailed in Western blots and analysis.
Generation of Stable Cell Lines
HEK 293T I/17 cells were transfected with lentiviral plasmids and viral supernatants were collected 48 h after transfection. MVD7 cells were plated in 6 well plates and treated with undiluted viral supernatants in the presence of 4 μg/mL polybrene (Sigma) for 24 h before media was exchanged. Cells were expanded into T-75s and grown to confluence before being enriched for mCherry positive cells via FACs.
PAC Cell Immunostaining and Microscopy
PAC MVD7 stable cells were plated on glass bottom plates (Mattek) and grown overnight. The following day, cells were fixed in 4% paraformaldehyde in PBS for 10 min at room temperature. Cells were briefly rinsed with PBS and blocked/permeabilized in 5% Donkey serum + 0.1% Triton X 100 + PBS for 1 h at room temperature. Blocking buffer was replaced with primary antibodies (mouse anti-Hsp60 1:100, rabbit anti-mCherry 1:500, abcam) diluted in primary antibody buffer containing 1% BSA + 0.1% Triton X 100 in PBS and cells were incubated in primary antibody overnight at 4 °C. The following day primary antibody was aspirated, and cells were washed 3 × 5 min in PBS. Secondary antibodies (anti-mouse Alexa Fluor 488 and anti-rabbit Alexa Fluor 568, ThermoFisher) were applied in blocking buffer at a dilution of 1:1000 and incubated at room temperature for 1 h. Cells were washed once with PBS for 5 min before staining with Alexafluor 647-conjugated phalloidin (1:100) in 1% BSA in PBS for 15 min. Cells were washed and stained with Hoechst 33342 (5 μg/mL). Cells were imaged on an inverted Olympus FV1000 confocal microscope using a 60X oil immersion objective.
Colocalization analysis of OMM-PAC cells. Images of OMM-PAC cells prepared as described above were analyzed using imageJ’s Coloc2 plugin with Costes thresholding.
Plasma Membrane PAC Distribution
PM-PAC expressing cells were pelleted and resuspended in ice cold homogenization buffer containing 250 mM sucrose, 1 mM EDTA, 10 mM Tris, pH 7.2 and HALT protease inhibitors. Cell suspensions were lysed by three 10 s sonication pulses with a 30 s rest on ice between each pulse. Unlysed cells and nuclei were removed by centrifugation at 500 × g for 10 min at 4 °C. Supernatants were centrifuged at 100,000 × g for 1 h at 4 °C in order to isolate the soluble and insoluble cellular fractions. Soluble fraction (supernatant) was removed and the pellets were washed once with homogenization buffer and recentrifuged at 100,000 × g for 1 h at 4 °C to remove cytoplasmic contaminants. The wash supernatants were removed and discarded and pellets resuspended and solubilized in 1X RIPA buffer supplemented with 4 M Urea, 2% CHAPS, and 0.5 mM DTT. Protein concentration was determined for both soluble and insoluble fractions by Pierce 660 nm protein assay and 5 μg protein per lane was run on 4 – 12% Bis-Tris gels and transferred overnight for Western blotting. Membranes were probed with antibodies against mCherry (PM-PAC), Na+/K+ ATPase alpha (PM marker), and GAPDH (cytosolic marker) and imaged via fluorescent secondary antibodies. Analysis was performed by optical densitometry and the relative proportion of signal in the soluble and insoluble fractions was calculated.
Microscopy for PKA/PDE localization
After plating and 24 h growth, MVD7cells were fixed in 4% PFA after a 500 μL wash with DPBS. Cells were fixed for 10 min at room temperature. After fixation, cells were washed 2x with 500 μL DPBS and immediately blocked for 1 h at room temperature in 5% donkey serum (Millipore), 1% BSA, and 0.1% Triton-X 100 in PBS. Cells were incubated in rabbit anti-PKA catalytic subunit antibody, anti-PKA RI or anti-PKA RIIB at 1:100 in 1% BSA, 0.5% Triton-X 100 in PBS overnight at 4 °C. Cells were washed 3 × 5 min in DPBS before application of Alexa488 or Alexa546 anti mouse and anti-rabbit secondary antibody at 1:1000 in blocking buffer for 1 h at room temperature. Cells were then incubated for 15 min with phalloidin-647 (ThermoFisher) for 15 min in 1 % BSA + PBS at 1:100 dilution. Cells were then washed 2x with PBS. The first wash contained Hoechst 33342 as a nuclear counterstain (2μL of 5mg/mL solution per 1mL PBS). Imaging was performed on an inverted Olympus FV1000 confocal microscope with an IX81 base equipped with a 60x oil immersion Plan S-Apo NA 1.35 objective. Ten fields of view per well were captured using Fluoview acquisition software.
Image analysis. All analysis was performed in imageJ and all calculations were made in Excel. Briefly, multichannel images containing structural markers (nucleus, mitochondria, and periphery/plasma membrane) and the protein of interest were split into individual channels. For plasma membrane and whole cell segmentation phalloidin 647 stained images were used to define the periphery of the cell. Otsu thresholding was used to define the border of the cell and a binary mask was created from the thresholded image. Holes were filled and an ROI defining the outer edge of the cell was created. The binary mask was then eroded three times to define the inner perimeter of the plasma membrane and an ROI was created. Mitochondrial and nuclear ROIs were defined by Otsu thresholding Tom20/Hsp60 and Hoechst 33342 stained images respectively. The integrated density and area of each ROI was measured. The plasma membrane fluorescence is equal to the fluorescence of the outer perimeter ROI minus the inner perimeter ROI. The cytoplasmic fluorescence is equal to the outer perimeter ROI minus the sum of the plasma membrane, nucleus, and mitochondrial ROIs. Fluorescence density was determined by dividing the integrated density of a given ROI by the area of the ROI. Fluorescence density (FD) was then normalized for each compartment defined by the following equation:
cAMP ELISA
Cells were grown in 10 cm dishes to confluence and split 1:15 into 60 mm dishes and grown to confluence. Complete growth media was exchanged for serum-free media and cells were allowed to incubate overnight. Cells were either untreated or treated with 10 μM IBMX for 2 min at room temperature under red safety lighting. Cells that were not treated with IBMX were also exposed to red safety lighting for 2 min prior to further manipulation. After the 2 min incubation, media was aspirated, cells exposed to 10 s or 20 min 440 nm LED light, and allowed to incubate in the dark for an additional 10 s before lysis with 500 μL 0.1 M HCl + 0.05 % Triton-X 100 (Sigma). Dark samples were treated exactly the same, except they were not exposed to 440 nm light. All samples were allowed to lyse in the dark for at least 10 min at room temperature. Each plate was tapped to lift cells and lysates were transferred to 1.5 mL centrifuge tubes and vortexed 5 – 10 s at maximum speed before being centrifuged at 10,000 × g for 10 min at 4 °C. Clarified supernatants were used for cAMP Direct ELISA (Enzo). 100 μL each sample was used per well. Each sample was run in duplicate. 20 μL of each lysate was used for protein content measurement by the Pierce 660 nm protein assay. The cAMP Direct ELISA was run in its acetylated format according to manufacturer’s protocol (see: http://www.enzolifesciences.com/fileadmin/files/manual/ADI-900–066_insert.pdf).
Light Stimulation Protocols
Single Pulse. MVD7 cells expressing PACs were plated in 24 well plates at 40,000 cells per well and allowed to incubated overnight in complete media. The following day, cells were transfected with 500 ng PKA reporter per well using Poly-plus Jet Prime transfection reagent at a ratio of 1:3 (DNA:vol Jet Prime) in 500 μL Opti-mem (Life Technologies). After 3 h, transfection media was exchanged for complete media and cells were incubated overnight in the dark. The following day, plates were removed from the incubator and exposed to a 1 s pulse of 440 nm LED light. Reactions were quenched by lysis with 100 μL urea lysis buffer (25 mM Tris, 8 M urea, 4% CHAPS) at indicated times. Lysates were then transferred to tubes for processing described in Western blot analysis. The positive control was cells treated with 10 μM FSK for 30 min to induce maximal reporter phosphorylation. For each experiment, triplicate positive controls were included.
Multiple Pulses. For multi-pulse experiments, cells were prepared as in single pulse (see above) experiments. However, cells were exposed to two 10 s pulses of 440 nm LED light per min for the indicated number of min before lysis with urea lysis buffer. Light pulses were controlled via an Arduino device described in Hughes et al. 2015.
PDE Inhibitor Screen
Inhibitor concentrations and sources are outlined in Table S2. Cells were prepared as described in Single Pulse experiments. On the day of light exposure, PDE inhibitors were added from 10x stocks and allowed to equilibrate in the dark for 2 min before light exposure. Cells were exposed to either a 1 s pulse followed by lysis 40 s later or 20 min of 2x per min 10 s pulses followed by lysis. Lysates were processed and blotted as described below in Western blots and analysis.
Western blots and analysis
For all reporter phosphorylation experiments: 20 μL 6 × SDS sample buffer (Acros) was added to 100 μL cell lysate and samples were heated to 95 °C for 5 min. 20 μL of each prepared lysate was loaded onto a 4 – 12% Bis-Tris gel (Life Technologies) and run in 1x MOPS SDS buffer (Life Technologies) at 150 V for 1 h 5 min. Positive controls were run on each gel in order to account for differences in transfer efficiency. Gels were then transferred to PVDF membranes overnight at 4 °C in 1x Tris-Glycine + 20% Methanol at 20 V. The following day, membranes were blocked with 5% BSA/TBST for 1 h at room temperature before being incubated with primary antibody overnight at 4 °C. The following day, blots were washed 3 × 5 min in TBST and stained with secondary antibody for 1 h at room temperature. Blots were then washed an addition 3 × 5 min in TBST and imaged on a Licor Odyssey. Quantification by densitometry was performed in Licor’s ImageStudio software.
Data is presented as % reporter phosphorylation.
Where pVASP_i or HAtag_i is equal to the mean intensity for a pVASP or HAtag for a sample respectively.
Reporter phosphorylation experiments utilized the mouse anti-pVASP antibody described in PKA Reporter Cloning and Characterization. In order to quantify total reporter levels, a rabbit anti-HA tag antibody (Cell Signaling Technologies) was used to detect the total reporter levels. The pVASP S157 and HA-tag antibodies were used at 1:1000 and 1:2000 respectively. Licor goat anti-mouse 800 and goat anti-rabbit 680 were used for detection of anti-pVASP and anti-HA-tag, respectively. Secondary antibodies were used at 1:15,000 and 0.1% SDS was included in the secondary antibody buffer. All antibody buffers contained 5% BSA/TBST. For characterization of stable cell PAC expression: 10 μg MVD7 PAC cell lysate was loaded onto Bis-Tris gels and gels were run and transferred as described above. Blots were stained in the same fashion as described above except that different primary antibodies were used. Rabbit anti-mCherry (abcam ab167453) was used at 1:1000 and rabbit anti-GAPDH (Cell Signaling Technologies #5174) was used at 1:2000. Quantification was performed by running three separate gels and blots of the same lysates and quantifying the relative intensities of the PAC band at the expected molecular weight.
RNA Sequencing for PDE expression
RNA was harvested from MVD7 cells in three 35 mm dishes using the RNeasy Kit (Qiagen). RNA was eluted in 30 μL water. 10 μL of each sample was submitted for RNA sequencing, Samples were >50 ng/μL with A260/A280 ratio of 1.8–2.2. Library preparation for Illumina™ sequencing on a HiSeq 2500 system, along with downstream analysis (Data QC, trimming, mapping, differential gene expression and ontology analysis) was performed by Genewiz.
PKA C Subunit Nuclear Translocation Assay
Cells were plated in 12 well glass bottom dishes (Mattek #1.5 coverslip) at 105 cells per well in serum free media and incubated for 48 h in the dark. PDE inhibitors were added according to Table S2 as 10x concentrates. A positive control (10 μM FSK) was also included. Cells were placed into the 32 °C incubator and kept in the dark or stimulated with 440 nm LED light for 10 s every 20 s for 20 min. After treatment, cells were fixed in 4% PFA by the addition of 2x (8%) PFA in PBS directly to the wells containing cells and media. Cells were fixed for 10 min at room temperature in the dark. After fixation, cells were immediately blocked for 1 h at room temperature in 5% donkey serum (Millipore), 1% BSA, and 0.5% Triton-X 100 in PBS. Cells were incubated in rabbit anti-PKA catalytic subunit (abcam) antibody at 1:250 in 1% BSA, 0.5% Triton-X 100 in PBS overnight at 4 °C. Cells were washed 3 × 5 min in PBS before application of secondary antibody (donkey anti-rabbit alexafluor 488) at 1:1000 in blocking buffer for 1 h at room temperature. Cells were washed 3 × 5 min with PBS. The first wash contained 5 μg/mL Hoechst 33342 as a nuclear counterstain. Imaging was performed on an inverted Olympus IX81 microscope equipped with a Hamamatsu ORCA-Flash4.0 camera, 40× oil immersion Plan S-Apo NA 1.3 objective and DAPI, FITC, and TxRed filter cubes from Semrock. Three fields of view per well were captured.
Image analysis: A nuclear translocation pipeline was developed on CellProfiler by modifying the nuclear translocation pipeline available on the website (http://cellprofiler.org/examples/#human-cytoplasm-nucleus-translocation-assay-sbs-vitra). Briefly, objects were identified by thresholding nuclei images to identify cells. The nuclei were then used as seeds to generate segmented cells by propagation. Cytoplasmic regions were defined by subtracting the nuclei objects from the cell objects leaving cytoplasmic objects. Mean fluorescent intensity was measured for all objects and the ratio of nuclear to cytoplasmic PKA catalytic subunit was determined by (mean intensity Nu)/(mean intensity cyto). Ratios were calculated in CellProfiler and transferred to Prism. Outliers were identified, removed and ratios plotted as mean +/− SEM. N values for all groups area at least 49 individual cells. The image analysis pipeline for CellProfiler is attached as a supplemental file.
Quantification and Statistical Analysis
All image analysis was performed in CellProfiler 3.0 except for processing of images for Figure 1 and OMM-PAC colocalization, which was performed in imageJ. All Western blot quantitation was performed in ImageStudio Lite 5.0 (Licor). All graphs and statistical analysis were assembled and performed in GraphPad Prism 7/8. Statistical significance is reported as p < 0.05. All data is presented as mean ± SEM unless otherwise noted.
Data and Code Availability
The published article includes all datasets generated or analyzed during this study. See Data S1 (Sequences of Optogenetic Constructs, related to Figure 1). This study did not generate any codes.
Supplementary Material
SIGNIFICANCE.
cAMP was originally thought to serve as a homogeneously distributed second messenger. However, the development of imaging tools for cAMP and PKA has created a new model of intracellular cAMP heterogeneity, where pockets of cAMP signaling control distinct elements of cellular behavior. Nonetheless, the diffusion rate of small molecules, such as cAMP, suggests that this second messenger could impact signaling pathways beyond its subcellular site of synthesis. We explored this premise by creating optogenetic subcellular targeted bPACs. First, we found that signaling occurs on different time scales. In particular, cAMP-induced PKA activity at the OMM or PM is rapid relative to that in the Nu. Second, a sustained cAMP stream that originates from the mitochondria triggers Nu PKA activity. Third, in general, the impact of cAMP signaling is primarily constrained by PDE3 and PDE4. However, PDE4 in particular, controls cAMP-triggered Nu PKA activity as well as the for Nu migration of PKA’s catalytic subunit.
Highlights.
Design of engineered organelle-targeted optogenetic adenylate cyclases
Assessment of organelle-based cAMP-induced protein kinase activity
Identification of phosphodiesterases that modulate cAMP signaling activity
ACKNOWLEDGEMENTS
We thank the National Institutes of Health (1R01NS103486 and 1U01CA207160), the American Heart Association (18PRE33960038), and the Eshelman Institute for Innovation (R1040 RX03712116) for financial support.
Footnotes
DECLARATION OF INTERESTS
The authors declare no competing interests.
SUPPLEMENTAL INFORMATION
Supplemental information includes seven figures, seven tables, and sequence information for four constructs.
Publisher's Disclaimer: This is a PDF file of an unedited manuscript that has been accepted for publication. As a service to our customers we are providing this early version of the manuscript. The manuscript will undergo copyediting, typesetting, and review of the resulting proof before it is published in its final citable form. Please note that during the production process errors may be discovered which could affect the content, and all legal disclaimers that apply to the journal pertain.
References
- Acin-Perez R, Russwurm M, Gunnewig K, Gertz M, Zoidl G, Ramos L, Buck J, Levin LR, Rassow J, Manfredi G, et al. (2011). A phosphodiesterase 2A isoform localized to mitochondria regulates respiration. J Biol Chem 286, 30423–30432. [DOI] [PMC free article] [PubMed] [Google Scholar]
- Allen M, and Zhang J (2006). Subcellular dynamics of protein kinase A activity visualized by FRET-based reporters. Biochemical and biophysical research communications 348, 716–721. [DOI] [PubMed] [Google Scholar]
- Apolloni A, Prior IA, Lindsay M, Parton RG, and Hancock JF (2000). H-ras but not K-ras traffics to the plasma membrane through the exocytic pathway. Mol Cell Biol 20, 2475–2487. [DOI] [PMC free article] [PubMed] [Google Scholar]
- Asirvatham AL, Galligan SG, Schillace RV, Davey MP, Vasta V, Beavo JA, and Carr DW (2004). A-kinase anchoring proteins interact with phosphodiesterases in T lymphocyte cell lines. J Immunol 173, 4806–4814. [DOI] [PubMed] [Google Scholar]
- Bear JE, Loureiro JJ, Libova I, Fassler R, Wehland J, and Gertler FB (2000). Negative Regulation of Fibroblast Motility by Ena/VASP Proteins. Cell 101, 717–728. [DOI] [PubMed] [Google Scholar]
- Belin BJ, Cimini BA, Blackburn EH, Mullins RD, and Hetzer M (2013). Visualization of actin filaments and monomers in somatic cell nuclei. Molecular Biology of the Cell 24, 982–994. [DOI] [PMC free article] [PubMed] [Google Scholar]
- Beltejar MG, Lau HT, Golkowski MG, Ong SE, and Beavo JA (2017). Analyses of PDE-regulated phosphoproteomes reveal unique and specific cAMP-signaling modules in T cells. Proc Natl Acad Sci U S A 114, E6240–E6249. [DOI] [PMC free article] [PubMed] [Google Scholar]
- Blain-Hartung M, Rockwell NC, Moreno MV, Martin SS, Gan F, Bryant DA, and Lagarias JC (2018). Cyanobacteriochrome-based photoswitchable adenylyl cyclases (cPACs) for broad spectrum light regulation of cAMP levels in cells. J Biol Chem 293, 8473–8483. [DOI] [PMC free article] [PubMed] [Google Scholar]
- Boess FG, Hendrix M, van der Staay F-J, Erb C, Schreiber R, van Staveren W, de Vente J, Prickaerts J, Blokland A, and Koenig G (2004). Inhibition of phosphodiesterase 2 increases neuronal cgMp, synaptic plasticity and memory performance. Neuropharmacology 47, 1081–1092. [DOI] [PubMed] [Google Scholar]
- Cai L, Marshall TW, Uetrecht AC, Schafer DA, and Bear JE (2007). Coronin 1B coordinates Arp2/3 complex and cofilin activities at the leading edge. Cell 128, 915–929. [DOI] [PMC free article] [PubMed] [Google Scholar]
- Chung YW, Lagranha C, Chen Y, Sun J, Tong G, Hockman SC, Ahmad F, Esfahani SG, Bae DH, Polidovitch N, et al. (2015). Targeted disruption of PDE3B, but not PDE3A, protects murine heart from ischemia/reperfusion injury. Proceedings of the National Academy of Sciences 112, E2253–E2262. [DOI] [PMC free article] [PubMed] [Google Scholar]
- Conti M (2000). Phosphodiesterases and Cyclic Nucleotide Signaling in Endocrine Cells. Molecular Endocrinology 14, 1317–1327. [DOI] [PubMed] [Google Scholar]
- Cribbs JT, and Strack S (2007). Reversible phosphorylation of Drp1 by cyclic AMP-dependent protein kinase and calcineurin regulates mitochondrial fission and cell death. EMBO Rep 8, 939–944. [DOI] [PMC free article] [PubMed] [Google Scholar]
- Degerman E, Belfrage P, and Manganiello VC (1997). Structure, localization, and regulation of cGMP-inhibited phosphodiesterase (PDE3). J Biol Chem 272, 6823–6826. [DOI] [PubMed] [Google Scholar]
- Fantozzi DA, Harootunian AT, Wen W, Taylor SS, Feramisco JR, Tsien RY, and Meinkoth JL (1994). Thermostable inhibitor of cAMP-dependent protein kinase enhances the rate of export of the kinase catalytic subunit from the nucleus. J Biol Chem 269, 2676–2686. [PubMed] [Google Scholar]
- Filadi R, Basso E, Lefkimmiatis K, and Pozzan T (2017). Beyond Intracellular Signaling: The Ins and Outs of Second Messengers Microdomains. Adv Exp Med Biol 981, 279–322. [DOI] [PubMed] [Google Scholar]
- Gonzalez GA, and Montminy MR (1989). Cyclic AMP stimulates somatostatin gene transcription by phosphorylation of CREB at serine 133. Cell 59, 675–680. [DOI] [PubMed] [Google Scholar]
- Harootunian AT, Adams SR, Wen W, Meinkoth JL, Taylor SS, and Tsien RY (1993). Movement of the free catalytic subunit of cAMP-dependent protein kinase into and out of the nucleus can be explained by diffusion. Mol Biol Cell 4, 993–1002. [DOI] [PMC free article] [PubMed] [Google Scholar]
- Huston E, Lynch MJ, Mohamed A, Collins DM, Hill EV, MacLeod R, Krause E, Baillie GS, and Houslay MD (2008). ePaC and PKA allow cAMP dual control over DNA-PK nuclear translocation. Proc Natl Acad Sci U S A 105, 12791–12796. [DOI] [PMC free article] [PubMed] [Google Scholar]
- Jansen V, Jikeli JF, and Wachten D (2017). How to control cyclic nucleotide signaling by light. Current Opinion in Biotechnology 48, 15–20. [DOI] [PubMed] [Google Scholar]
- Kalderon D, Roberts BL, Richardson WD, and Smith AE (1984). A short amino acid sequence able to specify nuclear location. Cell 39, 499–509. [DOI] [PubMed] [Google Scholar]
- Lambrechts A, Kwiatkowski AV, Lanier LM, Bear JE, Vandekerckhove J, Ampe C, and Gertler FB (2000). cAMP-dependent protein kinase phosphorylation of EVL, a Mena/VASP relative, regulates its interaction with actin and SH3 domains. J Biol Chem 275, 36143–36151. [DOI] [PubMed] [Google Scholar]
- Lomas O, and Zaccolo M (2014). Phosphodiesterases maintain signaling fidelity via compartmentalization of cyclic nucleotides. Physiology (Bethesda) 29, 141–149. [DOI] [PMC free article] [PubMed] [Google Scholar]
- Ma Y, and Taylor S (2002). A 15-residue bifunctional element in D-AKAP1 is required for both endoplasmic reticulum and mitochondrial targeting. J Biol Chem 277, 27328–27336. [DOI] [PubMed] [Google Scholar]
- Mayr B, and Montminy M (2001). Transcriptional regulation by the phosphorylation-dependent factor CREB. Nat Rev Mol Cell Biol 2, 599–609. [DOI] [PubMed] [Google Scholar]
- Meinkoth JL, Ji Y, Taylor SS, and Feramisco JR (1990). Dynamics of the distribution of cyclic AMP-dependent protein kinase in living cells. Proceedings of the National Academy of Sciences 87, 9595–9599. [DOI] [PMC free article] [PubMed] [Google Scholar]
- Millar JK (2005). DISC1 and PDE4B Are Interacting Genetic Factors in Schizophrenia That Regulate cAMP Signaling. Science 310, 1187–1191. [DOI] [PubMed] [Google Scholar]
- Monterisi S, Lobo MJ, Livie C, Castle JC, Weinberger M, Baillie G, Surdo NC, Musheshe N, Stangherlin A, Gottlieb E, et al. (2017). PDE2A2 regulates mitochondria morphology and apoptotic cell death via local modulation of cAMP/PKA signalling. Elife 6. [DOI] [PMC free article] [PubMed] [Google Scholar]
- Musheshe N, Schmidt M, and Zaccolo M (2018). cAMP: From Long-Range Second Messenger to Nanodomain Signalling. Trends in Pharmacological Sciences 39, 209–222. [DOI] [PubMed] [Google Scholar]
- Nigg EA, Hilz H, Eppenberger HM, and Dutly F (1985). Rapid and reversible translocation of the catalytic subunit of cAMP-dependent protein kinase type II from the Golgi complex to the nucleus. The EMBO Journal 4, 2801–2806. [DOI] [PMC free article] [PubMed] [Google Scholar]
- O’Banion CP, and Lawrence DS (2018). Optogenetics: A Primer for Chemists. Chembiochem 19, 1201–1216. [DOI] [PubMed] [Google Scholar]
- O’Banion CP, Priestman MA, Hughes RM, Herring LE, Capuzzi SJ, and Lawrence DS (2018). Design and Profiling of a Subcellular Targeted Optogenetic cAMP-Dependent Protein Kinase. Cell Chem Biol 25, 100–109 e108. [DOI] [PMC free article] [PubMed] [Google Scholar]
- Ohki M, Sugiyama K, Kawai F, Tanaka H, Nihei Y, Unzai S, Takebe M, Matsunaga S, Adachi S. i., Shibayama N, et al. (2016). Structural insight into photoactivation of an adenylate cyclase from a photosynthetic cyanobacterium. Proceedings of the National Academy of Sciences 113, 6659–6664. [DOI] [PMC free article] [PubMed] [Google Scholar]
- Richards M, Lomas O, Jalink K, Ford KL, Vaughan-Jones RD, Lefkimmiatis K, and Swietach P (2016). Intracellular tortuosity underlies slow cAMP diffusion in adult ventricular myocytes. Cardiovascular Research 110, 395–407. [DOI] [PMC free article] [PubMed] [Google Scholar]
- Rinaldi L, Delle Donne R, Borzacchiello D, Insabato L, and Feliciello A (2018). The role of compartmentalized signaling pathways in the control of mitochondrial activities in cancer cells. Biochim Biophys Acta 1869, 293–302. [DOI] [PubMed] [Google Scholar]
- Sample V, DiPilato LM, Yang JH, Ni Q, Saucerman JJ, and Zhang J (2012). Regulation of nuclear PKA revealed by spatiotemporal manipulation of cyclic AMP. Nat Chem Biol 8, 375–382. [DOI] [PMC free article] [PubMed] [Google Scholar]
- Sassone-Corsi P (2012). The Cyclic AMP Pathway. Cold Spring Harbor Perspectives in Biology 4, a011148–a011148. [DOI] [PMC free article] [PubMed] [Google Scholar]
- Schröder-Lang S, Schwärzel M, Seifert R, Strünker T, Kateriya S, Looser J, Watanabe M, Kaupp UB, Hegemann P, and Nagel G (2006). Fast manipulation of cellular cAMP level by light in vivo. Nature Methods 4, 39–42. [DOI] [PubMed] [Google Scholar]
- Steegborn C (2014). Structure, mechanism, and regulation of soluble adenylyl cyclases - similarities and differences to transmembrane adenylyl cyclases. Biochim Biophys Acta 1842, 2535–2547. [DOI] [PubMed] [Google Scholar]
- Stenson L, Degerman E, and Manganiello VC (2010). cAMP/cGMP Dual-Specificity Phosphodiesterases. In Handbook of Cell Signaling, pp. 1425–1437. [Google Scholar]
- Steuer Costa W, Yu SC, Liewald JF, and Gottschalk A (2017). Fast cAMP Modulation of Neurotransmission via Neuropeptide Signals and Vesicle Loading. Curr Biol 27, 495–507. [DOI] [PubMed] [Google Scholar]
- Stierl M, Stumpf P, Udwari D, Gueta R, Hagedorn R, Losi A, Gärtner W, Petereit L, Efetova M, Schwarzel M, et al. (2011). Light modulation of cellular cAMP by a small bacterial photoactivated adenylyl cyclase, bPAC, of the soil bacterium Beggiatoa. The Journal of biological chemistry 286, 1181–1188. [DOI] [PMC free article] [PubMed] [Google Scholar]
- Tanwar M, Khera L, Haokip N, Kaul R, Naorem A, and Kateriya S (2017). Modulation of cyclic nucleotide-mediated cellular signaling and gene expression using photoactivated adenylyl cyclase as an optogenetic tool. Scientific Reports 7. [DOI] [PMC free article] [PubMed] [Google Scholar]
- Tsvetanova NG, and von Zastrow M (2014). Spatial encoding of cyclic AMP signaling specificity by GpCr endocytosis. Nature Chemical Biology 10, 1061. [DOI] [PMC free article] [PubMed] [Google Scholar]
- Walsh DA, Perkins JP, and Krebs EG (1968). An adenosine 3’,5’-monophosphate-dependant protein kinase from rabbit skeletal muscle. J Biol Chem 243, 3763–3765. [PubMed] [Google Scholar]
- Whitaker RM, Wills LP, Stallons LJ, and Schnellmann RG (2013). cGMP-Selective Phosphodiesterase Inhibitors Stimulate Mitochondrial Biogenesis and Promote Recovery from Acute Kidney Injury. Journal of Pharmacology and Experimental Therapeutics 347, 626–634. [DOI] [PMC free article] [PubMed] [Google Scholar]
- Xiao Y, Tian W, and Lopez-Schier H (2015). Optogenetic stimulation of neuronal repair. Current Biology 25, R1068–R1069. [DOI] [PubMed] [Google Scholar]
- Zhang J, Ma Y, Taylor SS, and Tsien RY (2001). Genetically encoded reporters of protein kinase A activity reveal impact of substrate tethering. Proc Natl Acad Sci U S A 98, 14997–15002. [DOI] [PMC free article] [PubMed] [Google Scholar]
- Zhou Z, Tanaka KF, Matsunaga S, Iseki M, Watanabe M, Matsuki N, Ikegaya Y, and Koyama R (2016). Photoactivated adenylyl cyclase (PAC) reveals novel mechanisms underlying cAMP-dependent axonal morphogenesis. Scientific Reports 6, 19679. [DOI] [PMC free article] [PubMed] [Google Scholar]
Associated Data
This section collects any data citations, data availability statements, or supplementary materials included in this article.
Supplementary Materials
Data Availability Statement
The published article includes all datasets generated or analyzed during this study. See Data S1 (Sequences of Optogenetic Constructs, related to Figure 1). This study did not generate any codes.