

Summary
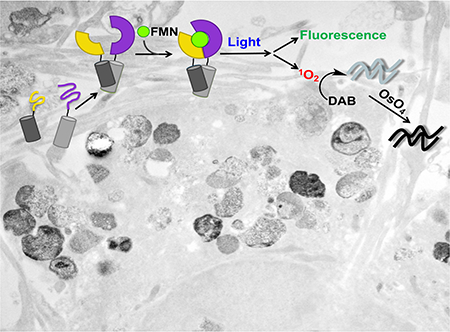
A protein-fragment complementation assay (PCA) for detecting and localizing intracellular protein-protein interactions (PPIs) was built by bisection of miniSOG, a fluorescent flavoprotein derived from the light, oxygen, voltage (LOV)-2 domain of Arabidopsis phototropin. When brought together by interacting proteins, the fragments reconstitute a functional reporter that permits tagged protein complexes to be visualized by fluorescence light microscopy (LM), and then by standard as well as “multicolor” electron microscopy (EM) via the photooxidation of 3–3’-diaminobenzidine (DAB) and its derivatives.
eTOC
Boassa et al. describe the use of split-miniSOG for the visualization of protein aggregates associated with neurodegenerative diseases. This study shows the general utility of this reversible system for detection of spatial organization of molecular complexes in mammalian cells at nanometer resolution.
Graphical Abstract
Introduction
PPIs underlie countless cellular processes and identifying when and where these interactions occur is essential for understanding their roles in biology and disease. Given their critical roles, a variety of different tools have been developed in order to track and quantify PPIs, including tools monitoring their formation and dynamics, as well as probes for visualizing their spatial distribution within intact cells (Johnsson and Varshavsky, 1994, Shekhawat and Ghosh, 2011). However, what remains missing are facile methods for visualizing PPIs at high resolution, which is important to do given that PPIs often give rise to protein complexes that localize to specific sub-cellular microdomains. Methods for imaging PPIs with sub-diffraction resolution would represent powerful tools, as biomacromolecules often interact to rise to nanometer-scale assemblies.
Here, we describe a novel PCA that can be used to track PPIs by correlative light and electron microscopy (CLEM). In this approach, PPI-partners are tagged with split-protein fragments derived from miniSOG, a fluorescent flavoprotein and genetically encoded EM-compatible tag engineered from the LOV2 domain of Arabidopsis phototropin (Shu et al., 2011). Due to the mutation of LOV2’s adduct-forming cysteine to glycine, miniSOG is both green-fluorescent and able to generate reactive oxygen species upon illumination with blue light. In fixed cells, photogenerated singlet oxygen (1O2) from miniSOG-tagged proteins can be used to convert DAB into a highly localized polymeric precipitate, which upon subsequent reaction with osmium tetroxide (OsO4), is readily identified under the electron microscope.
Results and Discussion
We reasoned that a split version of miniSOG could be applied to image intracellular PPIs by CLEM in a manner similar to how split-GFP (Ghosh et al., 2000) is used in fluorescence microscopy. In previous work, a split horseradish peroxidase (HRP)(Martell et al., 2016) has been applied to visualize extracellular PPIs, but split-HRP’s application to cytosolic PPIs is limited by its requirement for high calcium. Given that miniSOG functions throughout the cell, we sought to identify a bisection point that would produce PCA-suitable miniSOG fragments. Because protein solubility has previously been identified as a factor influencing protein “splitability” (such as in the case of the “super-folder” GFP, which can be split at multiple positions), we first sought to generate a more soluble version of miniSOG. To do so, we fused miniSOG to the LOV2’s native Jα-helix (miniSOG-Jα, Fig. 1). This modification was anticipated to increase solubility of the domain as structural evidence has shown docking of the folded Jα-helix serves to increase LOV2’s overall surface hydrophilicity (Harper et al., 2003, Harper et al., 2004, Halavaty and Moffat, 2007). Indeed, miniSOG-Jα exhibited a reduced propensity to form inclusion bodies when overexpressed in E. coli as compared to the original miniSOG (Supplementary Fig. 1).
Figure 1. Identification of a functional bisection site for generating PCA-suitable miniSOG-Jα fragments.

(a) Schematic depicting miniSOG complementation. MiniSOG is divided into fragments (yellow and purple) that do not bind FMN (green) unless brought together by interacting proteins (dark and light gray cylinders). Reconstituted complexes can be imaged by fluorescence and correlated to EM observations via photogeneration of 1O2 for localized polymerization of DAB. (b) Topology of miniSOG-Jα with miniSOG shown in blue and the Jα-helix in red. (c) Fluorescence from E. coli cells expressing various CPs (top) and a Coomassie-stained SDS-PAGE gel of corresponding cell lysates (bottom). (d) Topology of mSOG1–94 (purple) and mSOG-Jα95–140 (yellow), polypeptide fragments resulting from bisection of miniSOG-Jα between Gly94 and Glu95. (e) Structure of the related A. sativa LOV2 domain (PDB: 2V0U) showing FMN (spheres), as well as residues corresponding to mSOG1–94 (purple) and mSOG-Jα95–140 (yellow). (f-g) Fluorescence imaging of HEK293 cells transfected with DNA encoding mSOG1–94-FRB-P2A-T2A-FKBP-mSOG-Jα95–140. Transfected cells were identified via co-transfection with plasmid encoding iRFP670-N1. Signal from reconstituted miniSOG-Jα was detected only in rapamycin-treated cells. Scale bars, 50 microns. (g) Quantification of rapamycin-induced miniSOG-Jα fluorescence. The plotted values represent geometric means, mean ± s.d. of n=3 biologically independent samples.
Given that viable bisection and circular permutation points often coincide (Spotts et al., 2002), we next sought to identify viable miniSOG-Jα circular permutants (CPs), which we anticipated would guide toward a viable protein split-site. In an initial pool, six candidate CPs were generated by introducing new N- and C-termini within miniSOG-Jα loop regions containing three or more amino acids (Supplementary Fig. 2). Rationalizing that a properly folded CP would retain the ability to bind FMN, the proteins were over-expressed in E. coli and evaluated on the basis of cellular fluorescence (Fig. 1c). Through this approach, we identified a functional sequence termed “CP6,” corresponding to circular permutation of miniSOG-Jα at Glu95. When compared to a sequence lacking the Jα segment (CP6ΔJα), CP6 led to substantially higher cellular fluorescence (Supplementary Fig. 3), and measurements using purified CP6 indicated a fluorescence quantum yield that was comparable to that of the parental miniSOG (Supplementary Table 1).
We next bisected miniSOG-Jα between Gly94 and Glu95 (Fig. 2), producing an N-terminal segment termed “mSOG1–94” (10.96 kDa) and a 46 amino acid C-terminal polypeptide designated “mSOG-Jα95–140” (5.15 kDa), which we evaluated for use in a PCA. First, using complementary leucine zipper sequences tagged with each fragment, we tested their ability to reconstitute a FMN-binding domain in E. coli. Indeed, cells that co-expressed the tagged domains exhibited fluorescence emission corresponding to miniSOG-bound chromophore (Supplementary Fig. 4, 5). Furthermore, His-tag purification resulted in chromophore-bound protein complexes with spectral properties characteristic to LOV-bound FMN, and a fluorescence quantum yield similar to that of miniSOG (Supplementary Table 1, ΦF = 0.33).
Figure 2. Structural analyses of miniSOG/miniSOG-Jα bisection.

(a) Wire diagram on the LOV2 domain (PDB: 4EEP) with relative B-factor values represented as a heat map (blue to red: 20 – 60 Å2) and also by wire diameter. B-factor values correspond to the displacement of atomic positions from the mean per atom, as calculated from crystallographic x-ray diffraction data. High B-values are associated with regions of high flexibility. FMN is shown as sticks. Arrows indicate the N-terminus, C-terminus, and the identified split-site (between Gly94 and Glu95). The image was generated using Chimera (https://www.cgl.ucsf.edu/chimera/). (b) Structure of the LOV2 domain (PDB: 2V0U) with residues corresponding to mSOG1–94 shown in purple, and residues corresponding to mSOG-Jα95–140 shown in green. FMN (spheres) makes direct contact with regions of both fragments. (c) While mSOG1–94 forms the bulk of the FMN binding-pocket (gray surface), residues on mSOG95–106/ mSOG-Jα95–140 (green) make contact with the cofactor through van der Waals interactions (residues 99 – 101, spheres) and through hydrogen bonding between the side-chain N of Gln103 (shown in sticks) and O4 of the FMN isoalloxazine ring. mSOG95–106 is a substructure of mSOG-Jα95–140 and lacks residues corresponding to the Jα-helix.
To test whether the fragments could complement one another in mammalian cells, and to determine whether the reconstitution of miniSOG-Jα required physical interaction between tagged domains, we fused mSOG1–94 and mSOG-Jα95–140 to domains that undergo rapamycin-inducible interaction (Spencer et al., 1993) (mSOG1–94-FRB-P2A-T2A-FKBP-mSOG-Jα95–140). Using HEK293 cells that co-expressed the tagged proteins, we quantified the extent of miniSOG-Jα fluorescence in cells treated with increasing concentrations of rapamycin (Fig 1f–h). In analyses by flow cytometry and fluorescence microscopy, drug-untreated cells exhibited only background emission levels, comparing to that of non-transfected controls. However, cells treated with rapamycin exhibited fluorescence intensities corresponding to a dose-dependent reconstitution of miniSOG-Jα. Indeed, these results confirmed that complementation between mSOG1–94 and mSOG-Jα95–140 occurred in a PPI-dependent manner.
To determine whether miniSOG-Jα complementation could be used to image PPIs via CLEM, we fused mSOG1–94 and mSOG-Jα95–140 to the basic region-leucine zipper domains of bFos and bJun, subunits of the AP-1 transcriptional complex that interact constitutively as nuclear heterodimers (O’Shea et al., 1992). Co-expression of the tagged zippers in mammalian cells resulted in bright nuclear fluorescence with enrichment in nucleoli (Fig. 3a), consistent with previous localization analyses using split-YFP (Hu et al., 2002). To test whether the tagged complexes could be visualized by EM, co-transfected HeLa cells were photooxidized in the presence of DAB. Following photooxidation, optically-dense DAB reaction products were visible under transmitted light in the nuclei of positive cells in patterns matching the distribution of reconstituted miniSOG-Jα fluorescence (Fig. 3b). At the EM level, these exhibited significantly increased nuclear contrast on electron micrographs, which was especially apparent upon comparison of expressing and non-expressing cells within the photooxidized area (Fig. 3c–e).
Figure 3. Correlated light and EM imaging of nuclear mSOG1–94 -bFos/bJun- mSOG-Jα95–140 complexes.

(a) Epifluorescence images showing colocalization of reconstituted miniSOG-Jα complexes with DRAQ5 (a far-red emitting nuclear stain) in live HEK293 cells. (b) Co-transfected cells exhibited similar nuclear fluorescence, as revealed by confocal fluorescence imaging (left) of fixed HeLa cells. Transmitted light images of the same area showing cells before (middle) and after (right) a 3-minute illumination with intense blue light in the presence of DAB. Following photooxidation, an optically-dense DAB reaction product was observed in the positive cell (white rectangle). (c) TEM micrograph of the same cell indicated in (b) showing the OsO4-stained DAB reaction products as darkened contrast. (d) Direct comparison of cells positive for mSOG1–94-bFos and bJun-mSOG-Jα95–140 (“expressing cell”) to nearby non-expressing cells by transmitted light imaging and EM (e, micrograph of the same area indicated by the white rectangle in d). The cells resided within a photooxidation area that was illuminated for 8 minutes.
Recognizing that reversibility in split-reporter systems is a desirable feature of PCAs, we tested whether reconstituted miniSOG-Jα complexes could be dissociated in the absence of a PPI template. Using a purified, single-chain construct in which a tobacco etch virus (TEV)-protease cleavage site was inserted into miniSOG-Jα between Gly94 and Glu95, we determined the state of the FMN chromophore before and after TEV protease digestion (Fig. 4). Optical and fluorescence analyses indicated that the FMN was bound to the protein prior to cleavage but was released upon digestion with TEV protease—suggesting that in the absence of a linkage, mSOG1–94, mSOG-Jα95–140, and FMN dissociate from one another over time. In addition, immunoprecipitation (IP) analyses were performed using a self-assembling protein (FM1, a mutant of FKBP14) (Rollins et al., 2000) that can be monomerized using a specific ligand, FK506. In the absence of FK506, IP of FM1-mSOG-Jα95–140 via a fused hemagglutinin (HA) tag resulted in the co-precipitation of FM1-mSOG1–94. However, treatment with FK506 to dissociate FM1 dimers abolished co-IP of FM1-mSOG1–94 (Fig. 5a–d).
Figure 4. FMN is liberated from reconstituted miniSOG/miniSOG-Jα complexes in the absence of a stabilizing template.

(a) Schematic diagramming the potential TEV-protease cleavage of full-length test proteins. A cleavable sequence was inserted at the split site into full-length miniSOG-Jα, miniSOG, and Venus, generating the TEV-protease cleavable (TC) proteins TC-miniSOG-Jα, TC-miniSOG, and TC-Venus. Two possible scenarios are depicted depending on the reversibility of the reconstituted complex. (b-c) Normalized emission spectra are shown for uncleaved (blue lines), TEV-protease cleaved TC-miniSOG-Jα and TC-miniSOG (red lines), and free FMN alone (black lines). Uncleaved TC-miniSOG-Jα and TC-miniSOG samples exhibited emission spectra corresponding to LOV domain-bound chromophore (blue traces), indicating that FMN was associated with the protein prior to cleavage. Following digestion with TEV protease, the samples exhibited emission spectra corresponding to liberated FMN (red traces) matching emission of free FMN in solution (black traces), thus indicating that FMN is liberated from protein complex in the absence of a stabilizing template. (d) The control protein TC-Venus is similarly fluorescent before and after digestion with TEV-protease. Relative emission spectra from TC-Venus before and after cleavage are shown. (e) Complete cleavage of the test proteins was verified by Coomassie staining of SDS-PAGE gels and immunoblotting with detection for N-terminal His-tags.
Figure 5. miniSOG1–94 and miniSOG-Jα95–140 physically dissociate from one another following unbinding of fused interaction partners.

(a) Schematic of the DNA constructs encoding tagged version of the self-associating FKBP14 mutant FM1 (FLAG2-FM1-mSOG1–94 and HA2-FM1-mSOG-Jα95–140, respectively). (b) Co-transfection of HEK293 with the constructs resulted in detectable fluorescence from reconstituted miniSOG-Jα, indicating that FM1 self-association is sufficient to drive domain reassembly. Transfected cells were identified by detection of mCherry. Scale bar, 30 microns. (c) Schematic diagramming the anticipated results following immunoprecipitation (IP) analysis. miniSOG1–94 and miniSOG-Jα95–140 are shown as yellow and purple shapes. FM1 spontaneously forms dimers (gray shapes in cartoon) in the absence of an FKBP ligand—thus, we anticipated that IP of HA2-FM1-mSOG-Jα95–140 (using anti-HA antibody) would result in co-IP of FLAG2-FM1-miniSOG1–94. In addition, we anticipated that co-IP could be abolished by FK506 (blue dots, a ligand that binds and dissociates FM1 dimers) if the interaction between the fragments was reversible. (d) Immunoblot detection of HA2-FM1-mSOG-Jα95–140 and FLAG2-FM1-mSOG1–94 in the elution fractions of anti-HA IPs done in the presence and absence of FK506. FLAG2-FM1-mSOG1–94 did not co-IP with HA2-FM1-mSOG-Jα95–140 in the presence of FK506, indicating that the reconstituted miniSOG-Jα does not physically bind FM1 proteins together following their drug-induced dissociation. (e) Co-expression of a tagged version of the PKA catalytic subunit α (Cat-mSOG1–94) and the regulatory subunit type IIɑ (Reg-IIa-mSOG-Jα95–140) in HEK293T cells resulted in detectable cytoplasmic fluorescence from reconstituted miniSOG-Jα (t=0). Following treatment with an inhibitor of PKA activation, 50 μM Rp-adenosine 3’,5’-cyclic monophosphorothioate triethylammonium salt (Rp-cAMP), for 20 minutes (t=20 m), resulted in similar level of fluorescence, while treatment with 20 μM forskolin and 200 μM 3-isobutyl-1-methylxanthine (IBMX) for 15 minutes (t=15 m) resulted in a significant decrease in fluorescence intensity. Transfected cells were identified by strong mCherry fluorescence. (f) Fluorescence intensity for reconstituted miniSOG-Jα was normalized to 100% for t=0. Error bars, S.D.; n=10–12 representative of two independent experiments. **P<0.005 relative to t=0 (Student’s t-test). (g) Time course of the PKA dissociation in 293T cells following treatment with 20 μM forskolin and 200 μM 3-isobutyl-1-methylxanthine (IBMX) compared to untreated, control cells. Single confocal planes were acquired and the fluorescence intensity at each time point was normalized to 1 for t=0. Error bars, S.D.; n= 11 cells untreated, n=28 cells treated. (h) Comparison of split-miniSOG and split-Venus using tagged PKA subunits via time-lapse imaging of forskolin/IBMX-treated cells showing the dissociation of reconstituted miniSOG-Jα complexes in stark contrast with the absence of dissociation of Venus. The drugs were added right after the first frame. The fluorescence intensity of the cells was quantified, followed by background subtraction, and then normalized to 100% for t=0. Error bars, S.E.; n=9–40 representative of two independent experiments.
To test the reversibility of mSOG1–94 and mSOG-Jα95–140 in living cells, we constructed a protein kinase (PKA) reporter construct (Stefan et al., 2007, Tchekanda et al., 2014) using tagged versions of the catalytic subunit α (Cat-mSOG1–94) and regulatory subunit type IIɑ (Reg-IIam-SOG-Jα95–140). In its inactive state, PKA exists as a tetrameric complex composed of Cat and Reg subunits, which dissociate in response to elevated cyclic-AMP (cAMP). Co-expression of the tagged proteins resulted in cytoplasmic miniSOG-Jα fluorescence, which was diminished upon treatment with forskolin and 3-isobutyl-1-methylxanthine (IBMX), agents that elevate intracellular cAMP (Fig. 5e–f). Experiments carried out in the presence of an inhibitor of PKA activation (Rp-adenosine 3’,5’-cyclic monophosphorothioate, Rp-cAMP) confirmed that the observed fluorescence loss was not due to photobleaching (Fig. 5e–f). A kinetic analysis via time-lapse imaging further confirmed the cAMP induced dissociation of the tagged subunits (Fig. 5g)—however, the apparent dissociation rate of the complex appeared attenuated compared to what has been previously measured using alternative reporter systems (van der Krogt et al., 2008, Tchekanda et al., 2014, Stefan et al., 2007). We note that, in the case of the split-miniSOG tagged PKA complex, the rate of fluorescence loss following cAMP elevation may represent the dissociation kinetics of the miniSOG-Jα components, rather than that of the PKA subunits themselves.
In addition to demonstrating the reversibility of the split-miniSOG-Jα complex, we also carried out a direct comparison of PKA subunits tagged with either split-miniSOG-Jα, or split-Venus polypeptides. Time-lapse imaging revealed that, although emission from miniSOG-Jα tagged PKA was diminished following cAMP elevation, fluorescence from split-Venus tagged PKA was maintained in cells following dual treatment with forskolin and IBMX (Fig. 5h). These results confirm that split-miniSOG-Jα is dissociable in living cells, and also demonstrate a significant advantage of split-miniSOG-Jα over split-Venus.
To demonstrate the utility of the probe in studying disease-relevant PPIs, we next applied split-miniSOG-Jα to visualize neurotoxic assemblies of α-synuclein (α-syn), a neuronal protein involved in Parkinson’s disease (Lashuel et al., 2013, Irwin et al., 2013). Using tagged monomers of α-syn, we carried out correlative analyses in order to observe the self-aggregation of the protein within neuronal cells (Fig. 6a). At the level of LM, we observed a diffuse fluorescent signal throughout the expressing cells with brightly enriched punctate intensities, likely corresponding to α-syn aggregates accumulated in the soma and dendrites of transfected neurons (Fig. 6b), formations consistent with ‘Lewy bodies’ and ‘Lewy neurites’ that are observed in the post-mortem histological sections of individuals afflicted with Parkinson’s disease, and other synucleinopathies. Following DAB photooxidation and OsO4-staining, we visualized these assemblies using transmission EM as well as 3-dimensional EM tomography (Phan et al., 2017) (Fig. 6, 7, Supplementary Fig. 6, and Supplementary Movie 1). In the somata and in the processes of transfected neurons, we observed darkly stained fibrillar structures and spherical assemblies (Fig. 7) likely representing various protofibrillar intermediates. Both straight and twisted α-syn filaments were observed, with diameters ranging from 4 to 15 nm, consistent with what has been previously measured in vitro using purified α-syn (Kalia et al., 2013). Notably, dendritic α-syn aggregates were observed within membrane-limited organelles, which in certain cases appeared to be fusing to the plasma membrane, suggesting the release of pre-formed aggregates into the extracellular space (Supplementary Fig. 6). To our knowledge, these data (enabled by split-miniSOG-Jα and CLEM imaging) represent the first in situ visualization of such structures within neuronal cells.
Figure 6. Correlated light and EM imaging of wild-type α-syn oligomers within neurons highlights an enhanced lysosomal pathology.

(a) Schematic depiction of the chimeras used to visualize α-syn aggregates. mSOG1–94 (purple) and mSOG-Jα95–140 (yellow) were fused to the N-terminus and C-terminus of α-syn. Both N-terminus/C-terminus and C-terminus/C-terminus fusions were tested with similar results. Aggregation of the proteins leads to miniSOG-Jα reconstitution. (b-c) Confocal fluorescence image (single confocal plane) of live cultured neurons co-expressing the tagged proteins. A diffuse fluorescent signal is observed throughout the cells with brighter labeling of α-syn aggregates in the soma and neurites. Image in (c) represents the same area indicted by the white rectangle in (b) acquired with different imaging settings to avoid saturation of signal from α-syn aggregates. (d-e) Corresponding transmitted light images were acquired post-fixation after 5 minutes and 30 seconds illumination in the presence of DAB. Image in (e) represents the same area indicated by the white rectangle in (d). (f-g) TEM images of α-syn aggregates following DAB photooxidation, OsO4-staining, embedding and sectioning. Labeled α-syn aggregates were observed as darkly stained inclusions in the perinuclear region of the neuronal cell bodies. These appear to be in the lumen of lysosomes. (h-o) EELS and EFTEM confirm specificity of α-syn aggregates labeling. (h) Conventional TEM image of α-syn aggregates (corresponding to white box in (f)) obtained at a magnification of 15 kx (pixel size of 0.35 nm/pixel). (i) Electron Energy-Loss Spectra showing the presence of a strong Cerium signal, as collected via point-detection within the lysosomal structures shown in (h). (j) A Ce elemental map obtained at a magnification of 15 kx on the direct detector device DE-12. The pre-edge and post-edge images were a sum of 14 individual drift corrected images, each acquired for a 125s exposure. (k) A single-color merge of the elemental map (green for Ce), overlaid on the conventional image. (l) Conventional TEM image of α-syn aggregates (corresponding to white box in (g)), obtained at a magnification of 12 kx (pixel size of 0.43 nm/pixel). (m) Electron Energy-Loss Spectra showing the presence of a strong Cerium signal within the lysosomal structures shown in (l). (n) A Ce elemental map obtained at a magnification of 12 kx on the direct detector device DE-12. The pre-edge and post-edge images were a sum of 11 individual drift corrected images, each acquired for a 125s exposure. (o) A single-color merge of the elemental map (green for Ce), overlaid on the conventional image. A Gaussian smoothing blur of radius 3 pixel was applied to all the images.
Figure 7. Correlated light and EM imaging of wild-type α-syn aggregates reveals fibrillar structures and protofibrillar intermediates within neurons.

(a) Confocal fluorescence image of cultured neurons expressing α-syn aggregates. (b) Fluorescence image overlaid on the transmitted light image before photooxidation of DAB. (c) Following photooxidation, the appearance of the optically visible DAB reaction product correlates with the detected reconstituted miniSOG fluorescence in (a, b). (d) Electron micrograph showing labeled α-syn aggregates observed as darkly stained inclusions contained in lysosomes in the perinuclear region of the neuronal cell bodies (d, f), and in dendritic regions (g). (e) No labeling was observed at presynaptic terminals where α-syn aggregates were not detected. (f, g) At high magnification, fibrillar structures were clearly visible within these inclusions in lysosomes (white arrows), as well as spherical and chain-like protofibrillar intermediates (white arrowhead).
In addition, stained inclusions within the lumen of lysosomes, or lysosome-like organelles were also detected by EM. Although such staining was not observed in control cells (including non-photooxidized transfected neurons, and photooxidized untransfected neurons, Supplementary Fig. 7), we sought to confirm the labeling specificity of these tagged aggregates within these organelles and distinguish DAB-derived contrast from the intrinsic electron density of these organelles. To do so, we applied a “multicolor” EM labeling strategy using a lanthanide-chelated DAB analog (Adams et al., 2016) (Fig. 6h–o). Similar to DAB, the lanthanide-containing analog is able to form a localized polymeric product following reaction with photogenerated 1O2. However, in addition to visualization via osmification, the lanthanide-containing polymer can also be spatially mapped using energy-filtered EM, and electron energy-loss spectroscopy (EELS). Thus, signal arising from the lanthanide serves as an “elemental signature” of photo-deposited precipitates introduced via split-miniSOG-Jα illumination. Through this analysis, we unambiguously confirmed the presence of tagged α-syn aggregates within the observed structures.
Intriguingly, we note that fluorescence and DAB signals corresponding to reconstituted miniSOG-Jα were not detected within axon terminals of neurons expressing tagged wild-type α-syn, nor in those containing tagged versions of the disease-associated A53T α-syn mutant (Fig 7e, Supplementary Fig. 8, 9). To confirm that the lack of signal within axon terminals was not due to the absence of tagged proteins within these subcellular sites, we stained transfected neurons using antibodies selective for each of the recombinant α-syn chimeras (Supplemental Fig. 10). Indeed, both the mSOG1–94- and mSOG-Jα95–140–tagged α-syn species localized to presynaptic sites, suggesting the protein exists within presynaptic terminals in a primarily monomeric form. In contrast to these observations, others reported an enrichment of aggregated α-syn within axon terminals when observing the protein via expression of split-Venus tagged constructs (Wang et al., 2014). As a potential explanation for this discrepancy, we hypothesized that the irreversible complementation of split-Venus may cause α-syn dimeric (and oligomeric) forms to mislocalize to axon terminals. Indeed, recent evidence demonstrating that split-Venus complementation serves to “trap” α-syn-α-syn interactions is in further support of this hypothesis (Eckermann et al., 2015).
To examine whether the forced association of α-syn units could cause its mislocalization, we generated a fused dimer of α-syn, in which miniSOG was inserted between two copies of the self-aggregating protein (α-syn-miniSOG-α-syn). In this configuration, miniSOG binds the α-syn units together in a manner that mimics the (irreversible) dimeric complex formed upon complementation of split-Venus tagged monomers. Intriguingly, neurons expressing α-syn-miniSOG-α-syn exhibited distributed, cell-wide fluorescence, with brightly enriched intensities localized at axon terminals (Supplemental Fig. 11) resembling closely what was observed using split-Venus. The α-syn-miniSOG-α-syn construct readily produced DAB reaction products, and EM visualization confirmed the presence of the linked α-syn within these subcellular sites. Thus, although previous studies using split-Venus suggest that α-syn clusters at pre-synaptic sites in order to restrict vesicle trafficking and recycling, our observations suggest a scenario in which the assembly state of α-syn is distinct from that which has been observed using the irreversible complementation probe.
Significance
The ability to track specified biomolecules by EM has progressed significantly since the initial introduction of miniSOG, and these developments in some ways resemble those that were made in the years following the introduction of the initial GFP. The work described herein contributes to that progress through the introduction of a simple technique for multi-scale visualization of PPIs via CLEM, enabling the imaging of intracellular complexes from the micron- to nanometer-scales. The system should complement the recently described probes for imaging extracellular and luminal PPIs (Ghosh et al., 2000, Martell et al., 2016), as well as those that have been recently developed to visualize non-protein biomolecules by EM (Ngo et al., 2016, Ou et al., 2017). Combination of these techniques with multi-color EM strategies (Adams et al., 2016) should provide a powerful strategy for the simultaneous detection of multiple biochemical parameters, not only in high resolution, but also within detailed ultrastructural contexts.
Overall these results highlight the advantages of split miniSOG complementation in visualizing intracellular protein-protein interactions with high spatial resolution, particularly for studies on aggregation of proteins associated with neurodegenerative diseases in situ. Future adaptations of split-miniSOG-Jα may provide routes to EM imaging of diverse biochemical events (beyond PPIs) through design of reporters that sense and align fragments in response to specific post-translational modifications or nucleic acid sequences (Shekhawat and Ghosh, 2011). Finally, we believe that the split site identified here will also be transferable to other LOV domain-based tools, as the bisection of the related fluorescent reporter protein iLOV (Chapman et al., 2008, Christie et al., 2012) at the same position was also successful (Supplementary Fig. 12).
STAR METHODS
LEAD CONTACT AND MATERIALS AVAILABILITY
Further information and requests for resources and reagents should be directed to and will be fulfilled by the Lead Contact, John Ngo (jtngo@bu.edu).
Mammalian expression constructs encoding mSOG1–94 and mSOG-Jα95–140 can be obtained directly through AddGene.
EXPERIMENTAL MODEL AND SUBJECT DETAILS
Mammalian cells (HEK-293 or HeLa) were cultured in Dulbecco’s modified Eagle’s medium (Mediatech, Inc., Manassas, VA) supplemented with 10% (v/v) heat-inactivated fetal bovine serum (FBS) in a 37°C incubator with 10% CO2.
Primary neurons were prepared from cortex of 2-day-old Harlan Sprague-Dawley rats and cultured in Neurobasal-A medium supplemented with B27 and L-glutamine.
METHOD DETAILS
Comparison of miniSOG and miniSOG-Jα
DNA sequences encoding miniSOG and miniSOG-Jα were synthesized by PCR overlap-extension and inserted into a bacterial expression vector (pQE-80L, Qiagen) in-frame with an N-terminal His-tag. For expression, transformed DH10B E. coli cells (Life Technologies) were grown in a shaking incubator (250 rpm) at 37°C in LB supplemented with 100 μg ml−1 ampicillin. When a cell density of OD600 ~0.4 was reached, cultures were either immediately induced with isopropyl-β-D-1-thiogalactopyranoside (IPTG, at final concentration of 1 mM), or transferred to a 25°C shaking incubator (250 rpm) and induced 30 min later with the same concentration of IPTG. After 5 hours of expression, cells were pelleted by centrifugation, and soluble and insoluble proteins were fractionated using the B-PER Bacterial Protein Extraction Reagent (Pierce) supplemented with protease inhibitor cocktail (Complete, EDTA-free, Roche), both according to the manufacturer’s protocol. Protein fractions were analyzed by Coomassie staining of SDS-PAGE gels and immunoblotting with Anti-PentaHis HRP Conjugate (Qiagen). Blots were stripped with Restore Western Blot Stripping Buffer (Pierce) before being re-probed with Streptavidin-HRP (Pierce). In all cases, apparent molecular weights were approximated by comparison with the Precision Plus Protein Dual-Color Standard (Bio-Rad).
Protein purification
Soluble fractions from large-scale expression cultures (500 mL – 1 L) were prepared as described above and used for affinity purification of His-tagged proteins with Ni-NTA Agarose (Qiagen) according to the manufacturer’s protocol for native conditions. Following purification, proteins were buffer exchanged into PBS using PD-10 Desalting Columns (GE Healthcare Life Sciences) and quantified using the BCA Protein Assay Kit (Pierce).
Circular permutation of miniSOG-Jα
A non-repetitive, codon-optimized (E. coli) DNA sequence encoding a tandem dimer of miniSOG-Jα was synthesized by PCR overlap-extension and used as a template for amplification of individual CPs. The resulting DNA fragments were inserted into a bacterial expression vector (pQE-80L, Qiagen) in-frame with an N-terminal His-tag. Expression was performed at 25°C as described above for miniSOG and miniSOG-Jα. After 5 hours of expression, cultures were pelleted by centrifugation, washed once with PBS, and re-suspended in PBS at a normalized cell density of OD600=0.5. MiniSOG fluorescence was measured in a black 96-well plate using a fluorescence plate reader and imaged using a Maestro Imaging System (PerkinElmer). To confirm expression of individual CPs, total protein was extracted from normalized cell suspensions by sonication in PBS followed by addition of SDS to a final concentration of 1% (w/v) and heating (~50°C for 5 min) for solubilization of total protein. Insoluble cell debris was removed by centrifugation and the supernatant subsequently heated at 95°C for 5 min in 1X reducing SDS-PAGE loading buffer and analyzed by SDS-PAGE and Coomassie staining.
Complementation assays in E. coli
DNA encoding mSOG1–94-NZip was inserted into pBAD/Myc-His A (Life Technologies), and DNAs encoding CZip- mSOG95–106 and CZip-mSOG-Jα95–140 were inserted into pBAD-18cm (Addgene). For protein co-expression, plasmids were sequentially transformed into DH10B E. coli and double-transformants were maintained using ampicillin (100 μg ml−1) and chloramphenicol (35 μg ml−1). Proteins were expressed at 25°C as described above for miniSOG and miniSOG-Jα, except using L-arabinose as the inducer (at a final concentration of 1% w/v) in place of IPTG. The soluble fraction of cell lysates was analyzed by Coomassie-staining of SDS-PAGE gels or used for affinity purification of His-tagged complexes, both as described above.
Complementation assays in mammalian cells
DNA sequences encoding reporter-tagged proteins were inserted downstream of a CMV promoter in a mammalian expression vector (pcDNA3.1, Life Technologies) that was modified to include an encephalomyocarditis virus (ECMV) IRES sequence driving expression of a fluorescent protein (mCherry, Citrine, or their mitochondria (mt)-targeted derivatives). Mammalian cells (HEK-293 or HeLa, as indicated in the text and figure captions) were cultured in imaging dishes with a coverslip bottom (P35G-0–14-C, MatTek Corporation) and transfected with DNA using Lipofectamine 3000 (Life Technologies) according to the manufacturer’s protocol. Cells were imaged by epifluorescence 24 – 48 hours following transfection in HBSS. For FKBP/FRB expressing cells, 100 nM rapamycin or DMSO was added to cultures ~16 hours prior to imaging. Imaging miniSOG in cells that also expressed Citrine required off-peak excitation for selective detection of each chromophore using the following optical settings: EX405/20, DM505, EM535/25. For the PKA split-miniSOG reporter, we used tagged versions of the PKA catalytic subunit ɑ (Cat-mSOG1–94) and regulatory subunit type IIɑ (Reg-IIa-mSOG-Jα95–140). HEK293T cells co-expressing the PKA reporter pair were treated with 20 μM forskolin and 200 μM IBMX for 15 minutes or with Rp-cAMP for 20 minutes. The cells were imaged in HBSS with the Olympus Fluoview 1000 laser scanning confocal microscope and maintained at 37°C throughout the experiment. The average fluorescence intensity of the cells before and after treatment was quantified, followed by background subtraction using the Fiji software package (Schindelin et al., 2012).
Imaging of α-syn interaction in cultured neurons
Cortical neurons were dissociated by papain from postnatal day 2 (P2) Sprague Dawley rats, and co-transfected with a total of 5.0 μg DNA (2.5 μg of each vector used) by electroporation using an Amaxa Nucleofection Device (Lonza). mSOG1–94 and mSOG-Jα95–140 were fused to the N-terminus and C-terminus of α-syn in the pCAGGS vector. Co-transfections were done with N-and C-terminus fusions, or C- and C-terminus fusions. The transfected neurons were plated on imaging dishes (P35G-0–14-C, MatTek Corporation) that were coated on the same day with poly-D-lysine. Neurons were cultured in Neurobasal A medium containing 1X B27 Supplements (both from Life Technologies), 2 mM GlutaMAX (Life Technologies), 20 U/mL penicillin, and 50 μg/mL streptomycin for 14 days prior to imaging. Neurons were imaged in HBSS containing 1X B27 Supplements, 25 mM glucose, 1 mM pyruvate, and 20 mM HEPES. All animal procedures were approved by the Institutional Animal Care and Use Committee of UC San Diego. Confocal immunofluorescence images (1024 × 1024 pixels) were acquired on the Olympus Fluoview 1000 laser scanning confocal microscope using a 60X oil immersion objective with numerical aperture 1.42.
In vitro analysis of split-miniSOG reversibility
A 17 amino acid TEV-protease cleavable linker (GSGSGENLYFQSGSGSG) was inserted into miniSOG and miniSOG-Jα between Gly94 and Glu95, and the resulting proteins were fused with a SUMO tag at their C-termini, generating TC-miniSOG and TC-miniSOG-Jα, respectively. To generate TC-Venus, a 20 amino acid cleavable linker (GSGSGSGENLYFQSGSGSGG) was inserted into the fluorescent protein Venus between residues Gln158 and Gln159. Proteins were expressed at 25°C from an arabinose inducible promoter as described above, except expression was done overnight. The soluble fractions of cell lysates were used for affinity purification of His-tagged proteins as described above. Proteins were cleaved using ProTEV Plus protease (Promega) following the manufacturer’s protocol with modifications: 2.5-times the recommended amount of substrate protein (40 μg per 100 μl reaction) and 1.5-times the amount to recommended enzyme (1.5 μl per 100 μl reaction) was used in to cleave proteins in 200 μl reaction volumes. Cleaved and uncleaved samples were analyzed using a fluorescence plate reader in a black 96-well plate. An aliquot of each sample was collected prior to fluorescence measurement and analyzed by SDS-PAGE followed by Coomassie staining.
Live cell time-lapse imaging of tagged PKA complex dissociation
To capture the dissociation of the PKA subunits, 293T cells co-expressing the catalytic subunit α (Cat-mSOG1–94) and the regulatory subunit type IIɑ (Reg-IIa-mSOG-Jα95–140) were imaged over time using a laser scanning confocal microscope Olympus FluoView1000, at 37°C, using a 40X oil immersion objective lens with numerical aperture 1.3. For the PKA split-Venus reporter, we used tagged versions of the PKA catalytic subunit ɑ (Cat-N-Venus) and regulatory subunit type IIɑ (Reg-IIa-C-Venus). Minimal exposure times were used in order to prevent chromophore photobleaching. Single confocal planes were acquired at a time interval of 3 minutes over a period of 30 minutes. Images were processed using the Fiji software package (Schindelin et al., 2012).
Confocal fluorescence imaging and photo-oxidation
Mammalian cells were cultured in dishes with a coverslip glass bottom (P35G-0–14-C, MatTek Corporation) and transfected with DNA using Lipofectamine 3000 as described above. Proteins were allowed to express for 24 – 48 hours before cells were rinsed with pre-warmed HBSS and fixed using pre-warmed 2% (w/v) glutaraldehyde (Electron Microscopy Sciences) in 0.1 M sodium cacodylate buffer, pH 7.4 (Ted Pella Incorporated) for 5 minutes at 37 °C and then on ice for 1 hour. Subsequently, cells were rinsed on ice 3–5 times using chilled cacodylate buffer and treated for 30 minutes on ice in a blocking solution (50 mM glycine, 10 mM KCN, and 5 mM aminotriazole in 0.1 M sodium cacodylate buffer, pH 7.4) to reduce nonspecific background precipitation of DAB. Cells were imaged and photooxidized using a Leica SPE II inverted confocal microscope outfitted with a stage chilled to 4 °C. Confocal fluorescence and transmitted light images were taken with minimum exposure to identify transfected cells for correlative light microscopic imaging. For photooxidation, oxygenated DAB (3–3’-diaminobenzidine, Sigma-Aldrich) was dissolved in 0.1 N HCl at a concentration of 5.4 mg ml−1 and subsequently diluted ten-fold into sodium cacodylate buffer (pH 7.4, with a final buffer concentration of 0.1 M), mixed, and passed through a 0.22 μm syringe filter before use. DAB solutions were freshly prepared on the day of photooxidation and placed on ice and protected from light before being added to cells. Lanthanide-chelated DAB solutions were prepared as previously described (Adams et al., 2016). Regions of interest were identified by fluorescence and images were recorded with care to avoid sample photo-bleaching. The samples were then illuminated through a standard FITC filter set (EX470/40, DM510, BA520) with intense light from a 150 W xenon lamp. Illumination was stopped as soon as an optically-dense reaction product began to appear in place of the green fluorescence, as monitored by transmitted light (typically 3–8 min, depending on the initial fluorescence intensity, the brightness of the illumination, and the optics used).
Electron Microscopy
Multiple areas on a single dish were photooxidized as described in the preceding section. Subsequently, plates with cells were placed on a bed of ice and washed using ice-cold cacodylate buffer (5×2 minutes) to remove unpolymerized DAB. After washing, cells were post-fixed with 1% osmium tetroxide (Electron Microscopy Sciences) in 0.1 M sodium cacodylate buffer for 30 minutes on ice, then washed with ice-cold cacodylate buffer (3×2 minutes) and rinsed once in ice-cold distilled water. The samples were then dehydrated with an ice-cold graded ethanol series (20%, 50%, 70%, 90%, 100%, 100%, 3 minutes each) and washed once in room temperature anhydrous ethanol (3 minutes). Samples were then infiltrated with Durcupan ACM resin (Electron Microscopy Sciences) using a 1:1 solution of anhydrous ethanol:resin for 30 minutes on a platform with gentle rocking, then with 100% resin overnight with rocking. The next day, the resin was removed from dishes (by decanting and gentle scraping with care to avoid touching cells), replaced with freshly prepared resin (3×30 minutes with rocking), and polymerized in a vacuum oven at 60°C for 48 hours. Subsequently, photooxidized areas of interest were identified by transmitted light, sawed out using a jeweler’s saw, and mounted on dummy acrylic blocks with cyanoacrylic adhesive. The coverslip was carefully removed and ultrathin sections (80 nm thick) were cut using a diamond knife (Diatome). Electron micrographs were recorded using a JEOL 1200 EX transmission electron microscope operating at 60/80 kV. For electron tomography, thicker sections (200–250 nm) were imaged using the FEI Titan high base microscope operated at 300kV; micrographs were produced using a 4k × 4k Gatan CCD camera (US4000). Colloidal gold particles (5 and 10nm diameter) were deposited on each side of the sections to serve as fiducial markers. For each section, double-tilt series were collected using the SerialEM package. For each series, the sample was tilted from −60 to +60 degrees, every 0.5 degree. Tomograms were generated using an iterative reconstruction procedure (Phan et al., 2017).
Energy Filtered Transmission Electron microscopy (EFTEM) was performed with a JEOL JEM-3200EF transmission electron microscope operating at 200 KV, equipped with an in-column Omega filter. The samples were pre-irradiated at a low magnification of 100X for about 30 minutes to stabilize the sample and minimize contamination. The elemental maps were obtained at the M4,5 core-loss edge, the onset of which occurs at 883 cerium (Ce). The EFTEM images of the pre and post-edges were obtained using the 3-window method and a slit width of 40 eV. The pre-edges were obtained at 790 and 850 eV, and the post-edge was obtained at 908 eV. The elemental maps were computed using the EFTEM-TomoJ plugin (Messaoudi et al., 2013) of ImageJ, using the power law fit. The EFTEM images were acquired using the direct detection device DE-12 from Direct Electron (San Diego, CA, USA). Each of the pre-edge and post-edge image, is the summed image of 14 and 11 individual drift corrected and aligned images, respectively for the two sets of data shown in the figure 3. This technique mitigates effects of sample drift and other microscope instabilities over time, and the details of such an image acquisition and processing is described elsewhere (Ramachandra et al., 2014). The individual images were acquired for an exposure of 125 s for a frame rate of 0.04 frames/sec.
QUANTIFICATION AND STATISTICAL ANALYSIS
All statistical analyses used in this paper were performed in Prism software package (GraphPad, La Jolla CA). Statistical tests including the number of sample biological replicates (n) and statistical significance (p) are reported in the figures and associated legends.
DATA AND CODE AVAILABILITY
Additional data supporting the findings of this study are available within the supplemental information files. The EM data is publicly available at the Cell Image Library under accession number CIL: P20094.
Supplementary Material
KEY RESOURCES TABLE.
| REAGENT or RESOURCE | SOURCE | IDENTIFIER |
|---|---|---|
| Antibodies | ||
| Anti-HA tag antibody, HRP conjugate | Cell Signaling Technology | Cat#2999 |
| Anti-PentaHis antibody, HRP conjugate | Qiagen | Cat#34460 |
| Anti-FLAG tag antibody | Sigma-Aldrich | Cat#F3165 |
| Mouse monoclonal anti-HA antibody | Abcam | Cat# Ab49969 |
| Rabbit polyclonal anti-HA antibody | Sigma | Cat# H6908 |
| Mouse monoclonal anti-Bassoon | Abcam | Cat# Ab82958 |
| Mouse monoclonal anti-alpha synuclein | Sigma | Cat# S5566 |
| Rabbit polyclonal anti-miniSOG/ mSOG1–94 | Tsien laboratory | N/A |
| Anti-mouse IgG secondary antibody, HRP conjugate | Cell Signaling Technology | Cat#7076 |
| Goat anti-rabbit IgG secondary antibody, HRP conjugate | Bio-Rad Laboratories | Cat# 1706515 |
| Bacterial and Virus Strains | ||
| DH10B E. coli | Invitrogen | Cat# 18297010 |
| Biological Samples | ||
| Chemicals, Peptides, and Recombinant Proteins | ||
| Protease inhibitor cocktail (complete, EDTA-free) | Roche | Cat# 11873580001 |
| Streptavidin-HRP | Pierce | Cat# 21130 |
| Precision Plus Protein Dual-Color Standard | Bio-Rad | Cat# #1610374 |
| Ni-NTA Agarose | Qiagen | Cat# 30210 |
| PD-10 Desalting Columns | GE Healthcare Life Sciences | Cat# 17085101 |
| BCA Protein Assay Kit | Pierce | Cat# 23227 |
| Lipofectamine 3000 | ThermoFisher Sci. | Cat# L3000008 |
| Rapamycin, 2.5 mg/mL in DMSO (2.74 mM) | Sigma-Aldrich | Cat# R8781-200UL |
| IBMX | Sigma-Aldrich | Cat# I5879 |
| Rp-cAMP | Sigma-Aldrich | Cat# A165 |
| Forskolin | Sigma-Aldrich | Cat# F3917 |
| Neurobasal-A medium (1X), liquid | Life Technologies | Cat# 10888022 |
| B27 Serum-Free Supplement (50X), liquid | Life Technologies | Cat# 17504044 |
| GlutaMax | Life Technologies | Cat# 35050061 |
| ProTEV Plus protease | Promega | Cat# V6101 |
| DRAQ5 | Cell Signaling Tech. | Cat# 4084 |
| Paraformaldehyde | Electron Microscopy Science | Cat# 19202 |
| Glutaraldehyde | Ted Pella | Cat# 18426 |
| Sodium cacodylate | Ted Pella | Cat# 18851 |
| Glycine | Bio-Rad Laboratories | Cat# 161-0718 |
| Diaminobenzidine (DAB, free base) | Sigma-Aldrich | Cat# D8001-10G |
| Osmium tetroxide | Electron Microscopy Science | Cat# 19190 |
| Durcupan ACM resin component A | Sigma-Aldrich | Cat# 44611 |
| Durcupan ACM resin component B | Sigma-Aldrich | Cat# 44612 |
| Durcupan ACM resin component C | Sigma-Aldrich | Cat# 44613 |
| Durcupan ACM resin component D | Sigma-Aldrich | Cat# 44614 |
| Critical Commercial Assays | ||
| B-PER Bacterial Protein Extraction Reagent | Pierce | Cat#78248 |
| Restore Western Blot Stripping Buffer | Pierce | Cat# 21059 |
| Deposited Data | ||
| EM data | This paper | Cell Image Library http://cellimagelibrary.org/project/P20094 |
| Structure of A. sativa LOV2 domain | Halavaty et al., 2007 | PDB: 2V0U |
| Structure of A. thaliana LOV2 domain | Christie et al., 2012 | PDB: 4EEP |
| Experimental Models: Cell Lines | ||
| HEK293 | ATCC | CRL-1573 |
| HeLa | ATCC | CRM-CCL-2 |
| HEK293T | ATCC | CVCL-0063 |
| Experimental Models: Organisms/Strains | ||
| Oligonucleotides | ||
| Recombinant DNA | ||
| pBAD/Myc-His A | Invitrogen | Cat# V440-01 |
| pBAD-18cm | Beckwith lab available through ATCC | Cat# 87396 |
| pQE-80L | Qiagen | Cat# 32943 |
| pcDNA3.1 | Invitrogen | Cat# V790-20 |
| pCAGGS (derived via restriction digest of the pCAGGSbased plasmid “PSD95-TS:YFP”) | Tsien laboratory; PSD95-TS:YFP is available through AddGene | Plasmid# 42225 |
| Software and Algorithms | ||
| Fiji | Schindelin et al., 2012 | https://imagej.net/Fiji |
Highlights.
Split-miniSOG allows to visualize intracellular protein-protein interactions
Split-miniSOG complementation is reversible
Reconstituted complexes are imaged by fluorescence microscopy and TEM/multicolor EM
ACKNOWLEDGEMENTS
This manuscript is dedicated to the memory of Roger Y. Tsien (R.Y.T), who inspired and co-supervised this work with M.H.E. R.Y.T. passed away on August 24th, 2016, while this work was in progress. We thank H. Hakozaki and P. Steinbach for advice regarding optical microscopy, and P. Nguyen for assistance with sample preparation for electron microscopy. This work was supported by NIH grants to M.H.E., S.R.A. and V.L.R. (NS027177), to S.R.A. and D.B. (R01 GM086197), to D.B. and M.H.E. (Branfman Family Foundation), to M.H.E. (P41 GM103412) for support of the National Center for Microscopy and Imaging Research, and to J.T.N. (R35 GM128859). R.Y.T. was an Investigator in the Howard Hughes Medical Institute.
Footnotes
DECLARATION OF INTERESTS
The authors declare no competing interests.
Publisher's Disclaimer: This is a PDF file of an unedited manuscript that has been accepted for publication. As a service to our customers we are providing this early version of the manuscript. The manuscript will undergo copyediting, typesetting, and review of the resulting proof before it is published in its final citable form. Please note that during the production process errors may be discovered which could affect the content, and all legal disclaimers that apply to the journal pertain.
REFERENCES
- ADAMS SR, MACKEY MR, RAMACHANDRA R, PALIDA LEMIEUX SF, STEINBACH P, BUSHONG EA, BUTKO MT, GIEPMANS BNG, ELLISMAN MH & TSIEN RY 2016. Multicolor Electron Microscopy for Simultaneous Visualization of Multiple Molecular Species. Cell Chem Biol, 23, 1417–1427. [DOI] [PMC free article] [PubMed] [Google Scholar]
- CHAPMAN S, FAULKNER C, KAISERLI E, GARCIA-MATA C, SAVENKOV EI, ROBERTS AG, OPARKA KJ & CHRISTIE JM 2008. The photoreversible fluorescent protein iLOV outperforms GFP as a reporter of plant virus infection. Proc Natl Acad Sci U S A, 105, 20038–43. [DOI] [PMC free article] [PubMed] [Google Scholar]
- CHRISTIE JM, HITOMI K, ARVAI AS, HARTFIELD KA, METTLEN M, PRATT AJ, TAINER JA & GETZOFF ED 2012. Structural tuning of the fluorescent protein iLOV for improved photostability. J Biol Chem, 287, 22295–304. [DOI] [PMC free article] [PubMed] [Google Scholar]
- ECKERMANN K, KUGLER S & BAHR M 2015. Dimerization propensities of Synucleins are not predictive for Synuclein aggregation. Biochim Biophys Acta, 1852, 1658–64. [DOI] [PubMed] [Google Scholar]
- GHOSH I, HAMILTON AD & REGAN L 2000. Antiparallel leucine zipper-directed protein reassembly: Application to the green fluorescent protein. Journal of the American Chemical Society, 122, 5658–5659. [Google Scholar]
- HALAVATY AS & MOFFAT K 2007. N- and C-terminal flanking regions modulate light-induced signal transduction in the LOV2 domain of the blue light sensor phototropin 1 from Avena sativa. Biochemistry, 46, 14001–9. [DOI] [PubMed] [Google Scholar]
- HARPER SM, CHRISTIE JM & GARDNER KH 2004. Disruption of the LOV-Jalpha helix interaction activates phototropin kinase activity. Biochemistry, 43, 16184–92. [DOI] [PubMed] [Google Scholar]
- HARPER SM, NEIL LC & GARDNER KH 2003. Structural basis of a phototropin light switch. Science, 301, 1541–4. [DOI] [PubMed] [Google Scholar]
- HU CD, CHINENOV Y & KERPPOLA TK 2002. Visualization of interactions among bZIP and Rel family proteins in living cells using bimolecular fluorescence complementation. Mol Cell, 9, 789–98. [DOI] [PubMed] [Google Scholar]
- IRWIN DJ, LEE VM & TROJANOWSKI JQ 2013. Parkinson’s disease dementia: convergence of alpha-synuclein, tau and amyloid-beta pathologies. Nat Rev Neurosci, 14, 626–36. [DOI] [PMC free article] [PubMed] [Google Scholar]
- JOHNSSON N & VARSHAVSKY A 1994. Split ubiquitin as a sensor of protein interactions in vivo. Proc Natl Acad Sci U S A, 91, 10340–4. [DOI] [PMC free article] [PubMed] [Google Scholar]
- KALIA LV, KALIA SK, MCLEAN PJ, LOZANO AM & LANG AE 2013. Alpha-Synuclein oligomers and clinical implications for Parkinson disease. Ann Neurol, 73, 155–69. [DOI] [PMC free article] [PubMed] [Google Scholar]
- LASHUEL HA, OVERK CR, OUESLATI A & MASLIAH E 2013. The many faces of alpha-synuclein: from structure and toxicity to therapeutic target. Nat Rev Neurosci, 14, 38–48. [DOI] [PMC free article] [PubMed] [Google Scholar]
- MARTELL JD, YAMAGATA M, DEERINCK TJ, PHAN S, KWA CG, ELLISMAN MH, SANES JR & TING AY 2016. A split horseradish peroxidase for the detection of intercellular protein-protein interactions and sensitive visualization of synapses. Nat Biotechnol, 34, 774–80. [DOI] [PMC free article] [PubMed] [Google Scholar]
- MESSAOUDI C, ASCHMAN N, CUNHA M, OIKAWA T, SORZANO CO & MARCO S 2013. Three-dimensional chemical mapping by EFTEM-TomoJ including improvement of SNR by PCA and ART reconstruction of volume by noise suppression. Microsc Microanal, 19, 1669–77. [DOI] [PubMed] [Google Scholar]
- NGO JT, ADAMS SR, DEERINCK TJ, BOASSA D, RODRIGUEZ-RIVERA F, PALIDA SF, BERTOZZI CR, ELLISMAN MH & TSIEN RY 2016. Click-EM for imaging metabolically tagged nonprotein biomolecules. Nat Chem Biol, 12, 459–65. [DOI] [PMC free article] [PubMed] [Google Scholar]
- O’SHEA EK, RUTKOWSKI R & KIM PS 1992. Mechanism of specificity in the Fos-Jun oncoprotein heterodimer. Cell, 68, 699–708. [DOI] [PubMed] [Google Scholar]
- OU HD, PHAN S, DEERINCK TJ, THOR A, ELLISMAN MH & O’SHEA CC 2017. ChromEMT: Visualizing 3D chromatin structure and compaction in interphase and mitotic cells. Science, 357. [DOI] [PMC free article] [PubMed] [Google Scholar]
- PHAN S, BOASSA D, NGUYEN P, WAN X, LANMAN J, LAWRENCE A & ELLISMAN MH 2017. 3D reconstruction of biological structures: automated procedures for alignment and reconstruction of multiple tilt series in electron tomography. Adv Struct Chem Imaging, 2, 8. [DOI] [PMC free article] [PubMed] [Google Scholar]
- RAMACHANDRA R, BOUWER JC, MACKEY MR, BUSHONG E, PELTIER ST, XUONG NH & ELLISMAN MH 2014. Improving signal to noise in labeled biological specimens using energy-filtered TEM of sections with a drift correction strategy and a direct detection device. Microsc Microanal, 20, 706–14. [DOI] [PMC free article] [PubMed] [Google Scholar]
- ROLLINS CT, RIVERA VM, WOOLFSON DN, KEENAN T, HATADA M, ADAMS SE, ANDRADE LJ, YAEGER D, VAN SCHRAVENDIJK MR, HOLT DA, GILMAN M & CLACKSON T 2000. A ligand-reversible dimerization system for controlling protein-protein interactions. Proc Natl Acad Sci U S A, 97, 7096–101. [DOI] [PMC free article] [PubMed] [Google Scholar]
- SCHINDELIN J, ARGANDA-CARRERAS I, FRISE E, KAYNIG V, LONGAIR M, PIETZSCH T, PREIBISCH S, RUEDEN C, SAALFELD S, SCHMID B, TINEVEZ JY, WHITE DJ, HARTENSTEIN V, ELICEIRI K, TOMANCAK P & CARDONA A 2012. Fiji: an open-source platform for biological-image analysis. Nat Methods, 9, 676–82. [DOI] [PMC free article] [PubMed] [Google Scholar]
- SHEKHAWAT SS & GHOSH I 2011. Split-protein systems: beyond binary protein-protein interactions. Curr Opin Chem Biol, 15, 789–97. [DOI] [PMC free article] [PubMed] [Google Scholar]
- SHU X, LEV-RAM V, DEERINCK TJ, QI Y, RAMKO EB, DAVIDSON MW, JIN Y, ELLISMAN MH & TSIEN RY 2011. A genetically encoded tag for correlated light and electron microscopy of intact cells, tissues, and organisms. PLoS Biol, 9, e1001041. [DOI] [PMC free article] [PubMed] [Google Scholar]
- SPENCER DM, WANDLESS TJ, SCHREIBER SL & CRABTREE GR 1993. Controlling signal transduction with synthetic ligands. Science, 262, 1019–24. [DOI] [PubMed] [Google Scholar]
- SPOTTS JM, DOLMETSCH RE & GREENBERG ME 2002. Time-lapse imaging of a dynamic phosphorylation-dependent protein-protein interaction in mammalian cells. Proc Natl Acad Sci U S A, 99, 15142–7. [DOI] [PMC free article] [PubMed] [Google Scholar]
- STEFAN E, AQUIN S, BERGER N, LANDRY CR, NYFELER B, BOUVIER M & MICHNICK SW 2007. Quantification of dynamic protein complexes using Renilla luciferase fragment complementation applied to protein kinase A activities in vivo. Proc Natl Acad Sci U S A, 104, 16916–21. [DOI] [PMC free article] [PubMed] [Google Scholar]
- TCHEKANDA E, SIVANESAN D & MICHNICK SW 2014. An infrared reporter to detect spatiotemporal dynamics of protein-protein interactions. Nat Methods, 11, 641–4. [DOI] [PubMed] [Google Scholar]
- VAN DER KROGT GN, OGINK J, PONSIOEN B & JALINK K 2008. A comparison of donor-acceptor pairs for genetically encoded FRET sensors: application to the Epac cAMP sensor as an example. PLoS One, 3, e1916. [DOI] [PMC free article] [PubMed] [Google Scholar]
- WANG L, DAS U, SCOTT DA, TANG Y, MCLEAN PJ & ROY S 2014. alpha-synuclein multimers cluster synaptic vesicles and attenuate recycling. Curr Biol, 24, 2319–26. [DOI] [PMC free article] [PubMed] [Google Scholar]
Associated Data
This section collects any data citations, data availability statements, or supplementary materials included in this article.
Supplementary Materials
Data Availability Statement
Additional data supporting the findings of this study are available within the supplemental information files. The EM data is publicly available at the Cell Image Library under accession number CIL: P20094.