Abstract
We report the space-time characteristics of the wall-pressure fluctuations and wall shear-stress fluctuations from wall-modeled large eddy simulation (WMLES) of a turbulent channel flow at Reτ = 2000. Two standard zonal wall models (equilibrium stress model and nonequilibrium model based on unsteady RANS) are employed, and it is shown that they yield similar results in predicting these quantities. The wall-pressure and wall shear-stress fields from WMLES are analyzed in terms of their r.m.s. fluctuations, spectra, two-point correlations, and convection velocities. It is demonstrated that the resolution requirement for predicting the wall-pressure fluctuations is more stringent than that for predicting the velocity. At least δ/Δx > 20 and δ/Δz > 30 are required to marginally resolve the integral length scales of the pressure-producing eddies near the wall. Otherwise, the pressure field is potentially aliased. Spurious high wave number modes dominate in the streamwise direction, and they contaminate the pressure spectra leading to significant overprediction of the second-order pressure statistics. When these conditions are met, the pressure statistics and spectra at low wave number or low frequency agree well with the DNS and experimental data. On the contrary, the wall shear-stress fluctuations, modeled entirely through the RANS-based wall models, are largely underpredicted and relatively insensitive to the grid resolution. The short-time, small-scale near-wall eddies, which are neither resolved nor modeled adequately in the wall models, seem to be important for accurate prediction of the wall shear-stress fluctuations.
I. INTRODUCTION
Wall-modeled large eddy simulation (WMLES) is a technique deployed in large eddy simulation (LES) of high Reynolds number wall-bounded turbulent flows to reduce the computational cost. The premise of success in LES is that the stress-carrying large eddies are resolved everywhere in the computational domain by the underlying grid. However, the size of the large eddies near the wall becomes progressively smaller with increasing Reynolds number, and resolution of such minute structures in LES necessitates excessively large number of grid points. As a result, the cost of wall-resolved LES approaches that of direct numerical simulation (DNS) in practical high Reynolds number flows. In underresolved LES where such scales are not represented, it is hoped that underlying subgrid-scale (SGS) models capture accurately the effect of the unresolved near-wall turbulence on the resolved scales. However, it has been demonstrated that the currently available SGS models do not quantitatively account for the unresolved shear stresses in coarse LES [1], especially near the wall [2].
In WMLES, no attempt is made to resolve the computationally demanding near-wall structures. The grids are built to resolve only the energetic structures in the outer portion of the boundary layer. As a result, the grid spacings in WMLES scale with the local boundary layer thickness (rather than with the viscous length scale), which makes the cost of WMLES a linear function of Reynolds number [3]. Accordingly, orders of magnitude reduction in the number of grid points is achieved in WMLES, compared to the wall-resolved LES. In WMLES, the aforementioned underresolution of the near-wall eddies and inadequacy of SGS models on coarse near-wall grids are remedied by a wall model, which augments the total shear stress in the inner layer. This is mostly done by modeling the wall shear stress using a Reynolds-averaged approach. There have been several advances in the wall-stress modeling since the early works of Deardorff [4] and Schumann [5] that relied on the existence of the logarithmic mean velocity profile. Advances have been made by increasing the dimension and completeness of the model so that it incorporates more of the near-wall physics embedded in the Navier-Stokes equations. A two-layer zonal model that solves simplified or full flow equations on a separate near-wall grid was proposed by Balaras et al. [6], and it has been improved in several studies [7–12]. Recently Yang et al. [13] introduced a model based on integration of an assumed velocity profile that can account for the surface roughness. Two wall models directly model the velocity boundary conditions. In the model of Chung and Pullin [14,15], instantaneous slip velocities calculated from a wall shear-stress model and the stretch-vortex SGS model are prescribed on a lifted virtual wall. Bose and Moin [16] dynamically calculate the wall-slip velocities conforming the derivation of the LES equations using an elliptic differential filter. The latter is potentially attractive, since the model is free of empirically specified parameters and a law of the wall prescription assumed in other models.
Primary interest in WMLES is prediction of the mean velocity and the mean forces exerted on the solid body, and assessment of WMLES has almost always precluded secondary quantities such as the wall-pressure and wall shear-stress fluctuations. These quantities can be of great importance in external hydro- and aerodynamics, since they are directly related to the structural vibration and noise generation. A good example is the airframe noise, where the wall-pressure fluctuations are the dominant source of the cabin noise inside a fuselage. Computational prediction of the radiated flow-induced noise often utilizes acoustic projection methods based on Lighthill’s acoustic analogy [17], such as the integral method of Ffowcs Williams and Hawkings [18]. In such formulations, the wall-pressure and wall shear-stress fluctuations appear as the surface dipole source, which dominates the quadrupole source in low Mach number flows [19]. Additionally, the space-time characteristics of the wall-pressure fluctuations, such as the frequency spectrum and convection velocity, are the required inputs to some approximate analytical far-field sound spectral models [20–23].
Few applications of WMLES for noise prediction are found in the literature. In their simulation of turbulent flow at a moderate Reynolds number (Reθ ≈ 3000) past an asymmetric trailing edge of a model hydrofoil, Wang and Moin [8] reported that the frequency spectra of the wall-pressure fluctuations obtained with a two-layer zonal wall model agreed well with the results from a wall-resolved LES. Recently it was shown that getting the correct turbulent boundary layer inside the nozzle using an equilibrium stress wall model improved the far-field jet noise predictions [24,25].
The main purpose of the present study is to investigate the spatiotemporal characteristics of wall-pressure and wall shear-stress fluctuations obtained with WMLES. To our knowledge, this is the first such study reported in the literature. We expect that the present study will help elucidate to what extent these quantities from WMLES can be useful in prediction of flow-generated sound and structural vibration. Here we analyze the wall-pressure and wall shear-stress fluctuations in detail, in terms of their r.m.s. fluctuations, wave number-frequency spectra, two-point correlations, and convection velocities. High Reynolds number canonical turbulent channel flow is considered for this purpose, where the wall-pressure statistics and spectra are available from a DNS [26]. The paper is organized as follows: In Sec. II, flow configuration, wall models, and computation of power spectra are described. The space-time characteristics of the wall-pressure and wall shear-stress fluctuations from WMLES are analyzed in Sec. III. Conclusions are given in Sec. IV.
II. COMPUTATIONAL DETAILS
A. Flow configuration
WMLES of a compressible channel flow is performed at Reτ = 2000, the friction Reynolds number based on the channel half-height δ, the friction velocity uτ, and the kinematic viscosity ν = μ/ρ. The flow configuration is identical to one of the validation cases considered in Ref. [12], with additional finer grids employed to study the effect of the grid resolution on the wall-pressure and wall shear-stress fluctuations. The Mach number at the channel centerline is fixed at 0.2 for comparison to the incompressible reference data. The size of the computational domain is Lx = 25δ, Ly = 2δ, and Lz = 10δ in the streamwise (x), wall-normal (y), and spanwise (z) directions, respectively. The incompressible DNS of Hoyas and Jiménez [26] which incorporated 18 billion collocation points is used here as reference. In the baseline WMLES calculation, the uniform grid spacings in each direction are (Δx, Δy, Δz) = (0.1δ, 0.02δ, 0.0625δ) in the LES. The number of grid points in the LES totals 4 million with (Nx, Ny, Nz) = (250, 100, 160). In the fine WMLES calculations, the baseline grid is refined only in the wall-parallel directions to produce two finer grids (denoted by xz-refined-1 and xz-refined-2) with 16 and 64 million grid points. This choice is based on observations that the wall-parallel grid resolution affects crucially the pressure fluctuations predicted in WMLES (see Sec III). Grid refinement in the wall-normal direction did not have such influence on the pressure fluctuations. The calculation with the finest grid is done for establishing the grid convergence of the quantities predicted with WMLES. Owing to the high computational cost and nearly identical results produced with two wall models on coarser grids, only the equilibrium wall model is used with the finest grid. Periodic boundary conditions are applied in the homogeneous directions (x and z). The periodic channel is driven at a constant mass-flow rate by adding a spatially uniform but time-varying body force term to the streamwise momentum equation, which balances the streamwise drag force on the walls. The work done by the imposed pressure gradient is accounted for in the total energy equation by adding a consistent energy source term. The wall temperature is kept constant so that the global energy balance in the channel is achieved through wall-heat transfer.
B. Wall modeling
Since the LES grid is too coarse to support the stress-bearing near-wall turbulent structures and their sharp gradients, the usual no-slip and thermal wall-boundary conditions in the LES are replaced with approximate boundary conditions in terms of the wall stress and heat flux computed by the wall model. The wall-normal velocity is kept zero on the walls. Two standard zonal wall-flux models are considered in the present study: a nonequilibrium wall model and an equilibrium wall model. These models have been used mostly with structured grid solvers [6–9,11], but recently they have been extended to an unstructured framework within our code CHARLES, a cell-centered unstructured finite volume compressible LES solver [27]. Details of the flow solver and wall models are available in separate publications [10,12,28,29], where applications to high Reynolds number canonical boundary layers and an external aerodynamics configuration are discussed.
Both wall models require the specification of the matching location (or wall-model layer thickness, hwm) where the LES data are imposed. In the present study, this location is fixed for both wall models at a distance (hwm = 0.1δ) from the walls. This choice is made following the suggestion of Kawai and Larsson [9], who showed that at least three cells below the matching location are required in the LES grid for accurate wall modeling, and that variation of hwm has little effect on the mean flow so long as the first condition is met and hwm is placed within the log layer. Additionally, the number of grid points in the wall-normal direction is kept constant at Ny,wm = 30 in both wall models, with the same wall-normal grid stretching. It was found that finer normal resolution in the wall model domain (Ny,wm > 30) has no measurable impact on the flow statistics.
1. Nonequilibrium wall model
The nonequilibrium wall model (NEQWM) solves unsteady 3D Navier-Stokes equations on an embedded near-wall mesh with a RANS-type closure. Therefore, this wall model consists of partial differential equations (PDEs), bearing the same complexity as the primal LES. The wall-model mesh has the same grid in the wall-parallel directions as that of the primal LES grid, while a fine resolution in the wall-normal direction is required to impose the no-slip wall condition in the wall model. The flow in the wall model is driven by the LES solution imposed on the wall-model top boundaries. At each time step, the wall-shear stress (τw) and wall-heat flux (qw) calculated from the wall-model solution are used as Neumann boundary conditions for the LES. The wall-model equations are
| (1) |
| (2) |
| (3) |
where ρ is the density, ui is the velocity component, p is the pressure, E = p/[ρ(γ − 1)] + ukuk/2 is the total energy, and γ = cp/cv is the ratio of specific heats. The flow variables in the above equations are interpreted as ensemble-averaged quantities. The perfect gas relation is used for the equation of state. The stress tensor τij and heat flux vector qj are and , where μ is the molecular viscosity, λ is the molecular thermal conductivity, T is the temperature, and is the deviatoric part of the rate-of-strain tensor Sij. For the turbulence closure, a novel mixing-length model in Ref. [12] is used for μt and λt, which dynamically accounts for the resolved Reynolds stresses carried by the wall model.
2. Equilibrium wall model
The equilibrium wall model (EQWM) is obtained by ignoring all the terms in the nonequilibrium model except for the wall-normal diffusion. This is equivalent to the assumption of a constant stress layer near the wall in the equilibrium boundary layer. The wall-model equations then reduce to
| (4) |
| (5) |
where η refers to the local wall-normal coordinate and u‖ is the wall-parallel velocity component. The wall-parallel shear-stress vector is assumed to be aligned with u‖ at η = hwm imposed by the LES, and its modulus is calculated from the wall-model solution. On each wall face, the EQWM consists of a system of two coupled ordinary differential equations (ODE), and it is therefore computationally very efficient. However, it is generally expected to have limited performance in flows with strong nonequilibrium effects, because the unsteady advection, pressure gradient, and wall-parallel transport are neglected [8].
C. Computation of power spectra
We follow the standard technique for the computation of power spectra in Ref. [30]. Once the simulations reach the statistically-stationary state, instantaneous fluctuations of any wall variable, denoted by ϕ(x,z,t), are collected over a nondimensional time (, where Ub is the bulk velocity). The variable ϕ here is either the wall-pressure fluctuations (pw), the streamwise wall shear-stress fluctuations , or the spanwise wall shear-stress fluctuations . Since the pressure is defined at the cell center in the code, pw is collected from the centroids of the wall-adjacent cells located at y+ = 20. Extrapolation of the pressure to the wall location using a second-order truncated Taylor series had little impact on the wall-pressure statistics and spectra. The simulation time steps are Δt′+ = 0.25 and 0.2 for the coarse and the fine calculations, respectively. The sampling resolution is fixed at Δt+ = 8. The signal is then divided into M overlapping intervals in the time domain with 50% overlap. Here we take M = 12. The Hanning window is applied to the signal within each interval to minimize spectral leakage in the frequency spectrum. Let ϕm(x,z,t) and be the fluctuation signal in the mth time interval and its discrete Fourier transform (DFT), respectively. Here k1, k3, and ω are the discrete wave numbers and (angular) frequency. The definitions of DFT and inverse-DFT follow the standard in Ref. [31], and the corresponding discrete Parseval’s theorem has the form
| (6) |
First, the three-dimensional power spectral density Ψ (k1,k3,ω) is calculated by
| (7) |
Ψ is then rescaled to satisfy the discrete Parseval’s theorem. In order to preserve an important property of the continuous three-dimensional power spectrum
| (8) |
the discrete three-dimensional power spectrum is defined as
| (9) |
Two-dimensional power spectra are then obtained by integrating over the remaining dimension:
| (10) |
One-dimensional power spectra are obtained similarly:
| (11) |
The one-dimensional spectra are often presented in the space of positive wave numbers or frequencies, since they are symmetric about the zero wave number or frequency axes. Hence, one-dimensional spectra are defined by
| (12) |
Two-dimensional two-point autocorrelations R(rx,rz) and R(rx,rt) are calculated by taking the inverse-DFT of the corresponding two-dimensional power spectra and , and normalizing them with their respective maxima at zero separation. One-dimensional autocorrelations are obtained in a similar manner.
III. RESULTS
A. Mean flow statistics
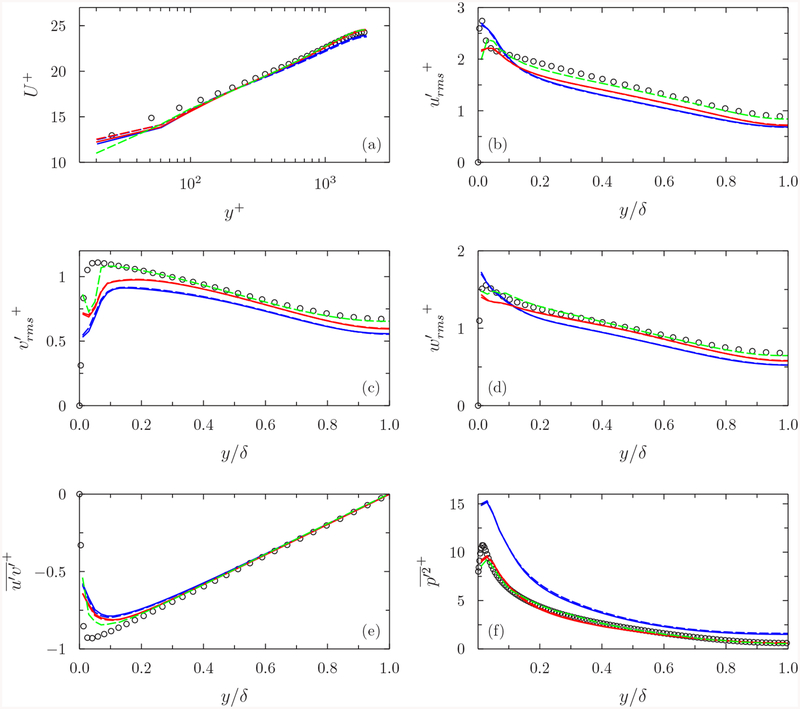
Figure 1 shows the distribution of the mean streamwise velocity, the resolved Reynolds stresses, and the resolved mean-square pressure fluctuations across the channel. The results from the LES with the NEQWM and the LES with the EQWM are in close agreement. This is expected since the assumptions leading to the EQWM from the NEQWM are valid in this canonical channel flow. For the velocity statistics, the results with the baseline grid are already in reasonable agreement with the DNS. The wall-parallel refinements lead to minor improvements. The velocity profile in the outer region is slightly improved. The Reynolds stresses above the matching location show closer agreement with the DNS, especially on the finest grid. In general, WMLES is expected to yield accurate prediction of the mean forces (mean shear stress and mean pressure) exerted on the wall, and the mean velocity in the outer region of boundary layers. The mean skin friction error should be much less than 3%, and it is reasonable to expect that the mean velocity agrees well with DNS or wall-resolved LES. According to this criterion, the results presented above are acceptable at all grid resolutions. Note that the mean velocity and the mean skin friction shown in Table I have largely converged to the DNS data on the coarsest grid, while the Reynolds stresses improve with the grid refinement. We suspect this would be a typical scenario in WMLES.
FIG. 1.
Mean flow statistics from WMLES of Reτ = 2000 channel flow: (a) Mean streamwise velocity. (b) Streamwise intensity. (c) Wall-normal intensity. (d) Spanwise intensity. (e) Reynolds shear stress. (f) Mean-square pressure fluctuation. Colors differentiate grid resolutions, and line types differentiate wall models. Blue lines, WMLES with the baseline grid; red lines, WMLES with the xz-refined-1 grid; green lines, WMLES with the xz-refined-2 grid; solid lines, LES with NEQWM; dashed lines, LES with EQWM; circles, DNS [26].
TABLE I.
Fluctuating wall pressure and shear stress in Reτ = 2000 turbulent channel flow. The numbers outside and inside parentheses are from the LES with the NEQWM and the LES with the EQWM, respectively. The calculation with the finest grid (xz-refined-2) was done with the EQWM only.
| Case | |||||
|---|---|---|---|---|---|
| Present WMLES (baseline) | 200/125 | 1.027(1.035) | 3.836(3.858) | 0.226(0.197) | 0.150(0.073) |
| Present WMLES (xz-refined-1) | 100/62.5 | 0.998(1.001) | 2.917(2.951) | 0.191(0.185) | 0.105(0.069) |
| Present WMLES (xz-refined-2) | 50/31.25 | (0.999) | (2.915) | (0.196) | (0.075) |
| Incompressible DNS [26] | 8.2/4.1 | 1 | 2.817 | 0.431 | 0.289 |
On the contrary, the wall-pressure fluctuations are largely overpredicted in the baseline WMLES (especially near the wall), and the prediction improves significantly with the wall-parallel grid refinements.
B. Remarks on the resolution of wall pressure in WMLES
A few remarks are in order regarding this unexpected pressure statistics. As will be evidenced in the subsequent sections, this behavior seems to be associated with the poorly resolved pressure field. In the baseline WMLES, strong 2-Δ waves in the streamwise direction were found from the pressure and density signals (they were not present in the velocity fields). These waves manifested themselves in the pile-up of energy at short wavelengths (⩽4Δx), accounting for approximately 20% of the total mean square pressure fluctuation near the wall. The spurious waves were not found in the initially laminar state, but they emerged through transition to turbulence and were trapped within the periodic channel. The amplitude of the wave was highest at the wall and lowest at the channel centerline.
Following observations were made to narrow the cause of the spurious waves. First, it was found that the problem persisted in no-slip LES calculations (no wall model). Second, the problem was also present in the pressure (but not in the velocity field) when the same flow was computed with an in-house incompressible staggered finite difference solver. Third, the problem persisted when the same flow was considered independently in a different research group, using a cell-centered, incompressible collocated finite volume unstructured solver (Oriol Lehmkuhl, Polytechnic University of Catalonia, Spain, private communication, September 2015). Fourth, the wall-parallel grid refinement reduced the amplitude of the spurious high wave number modes significantly. Last, a recent analysis of the DNS data [32] showed that the correlation length of the wall-pressure fluctuations in the streamwise direction is about 0.1δ, which is comparable to the grid spacing in the coarse WMLES.
All these observations suggest that the 2-Δ wave is induced not by numerical artifacts of the wall models or particular discretization schemes, but likely by the lack of grid resolution for the large-scale pressure structures. This view is supported by the fact that, in the baseline WMLES, less than 2 and 6 cells in the streamwise and spanwise directions, respectively, span the integral correlation lengths of the wall-pressure fluctuations (see Sec. III E). This causes the spurious high wave number modes in the poorly resolved pressure, which, in turn, may alias erroneously into the resolved wave number contents. Presumably, once generated, they are not suppressed owing to the stiff flow conditions (high Reynolds number) and the energy-conserving, nondissipative numerical schemes. Some dissipative ad hoc remedies, such as locally averaging the pressure signal every 10 time steps or upwinding, helped reduce the amplitude of the 2-Δ wave, but they were not pursued owing to their negative effects on the mean flow. As mentioned, the problem was mitigated when the baseline channel mesh was refined in the wall-parallel directions (x and z). The pile-up of energy still occurred near the cutoff wave number, but it possessed significantly lower amplitude than that in the coarse calculation, accounting for only 5% and 1% of the total mean square values on the xz-refined-1 and xz-refined-2 grids, respectively.
We conjecture that this problem in the pressure field may have persisted (but not discovered) in some of the reported WMLES calculations [13,14,16,33] of the same flow at similar or even coarser grid resolutions. Albeit undesirable, the problematic pressure field could be tolerated if one is interested only in the velocity statistics. However, this may not be admissible when WMLES is used for noise calculations or in flow-structure interaction problems. An obvious remedy is to use more grid points to resolve the integral scales of the wall-pressure structures (in this situation, a local grid adaptation in the near-wall region would be more suitable than the global mesh refinement.) Fortunately, the integral lengths of the wall pressure scale with δ in high Reynolds number wall-bounded flows [32,34], so the additional resolution requirement imposed by the wall pressure will not alter the scaling of the overall cost of WMLES, which is linear in Reynolds number [3].
C. r.m.s. fluctuation of wall pressure and wall shear stress
Table I compares the r.m.s wall-pressure and wall shear-stress fluctuations from the present WMLES to the DNS values. Note that the current wall models do not model the wall pressure and provide only the wall-shear stress to the LES. Therefore, τ1,rms and τ3,rms are calculated from the wall-model solution, whereas pw,rms is from the LES solution.
In WMLES, shows a convergence trend with the wall-parallel mesh refinements. is overpredicted by 36%, 4%, and 3% with the baseline, xz-refined-1, and xz-refined-2 meshes, respectively. has little variation with different wall models. It is anticipated that will eventually converge to the DNS value with finer grids.
On the contrary, and from the wall models are underpredicted by about 50% and 70%, respectively, compared to the DNS values. This is expected, since the quasi-streamwise near-wall vortices largely responsible for the wall shear-stress fluctuations [35] are not resolved in WMLES. Additionally, even if these structures were resolved in the LES, the wall models with a highly diffusive RANS closure would damp out the fluctuating LES signals imposed on the top boundary. In fact, such RANS-based wall models, at best, can produce the correct mean wall-shear stress. Therefore, the resolved fluctuation of the wall-shear stress is not represented adequately in the wall model, and it does not improve with mesh refinement in the outer layer.
The wall shear-stress fluctuations in the two wall models seem to respond differently to the wall-parallel grid refinement. Their values (especially τ3) in the NEQWM are higher than those in the EQWM. and in the EQWM have little variation with the grid refinement. As will be evidenced from their spectra in the next section, we suspect that τ1 and τ3 in the NEQWM are affected by the aliased LES pressure field imposed on the wall model. Note that the mean pressure gradient is neglected in the EQWM, and therefore the aliased pressure has no direct influence on τ1 and τ3 in the EQWM.
D. Spectra
In this section, the wave number-frequency spectra of pw, τ1, and τ3 from the present WMLES are presented, and they are compared to the available DNS and experimental data. In the DNS of Hoyas and Jiménez [26], only the wave number spectra of pw are available, and y+ = 5.8 is the lowest position in this DNS where the spectra are available. We use the DNS data at y+ = 19.8 for comparison (recall that pw in the present WMLES is defined at y+ = 20.) The DNS spectra at y+ = 5.8 and y+ = 19.8 had identical shapes with only a minute shift due to the difference in mean squared values. Other DNS and experimental data were measured on the wall.
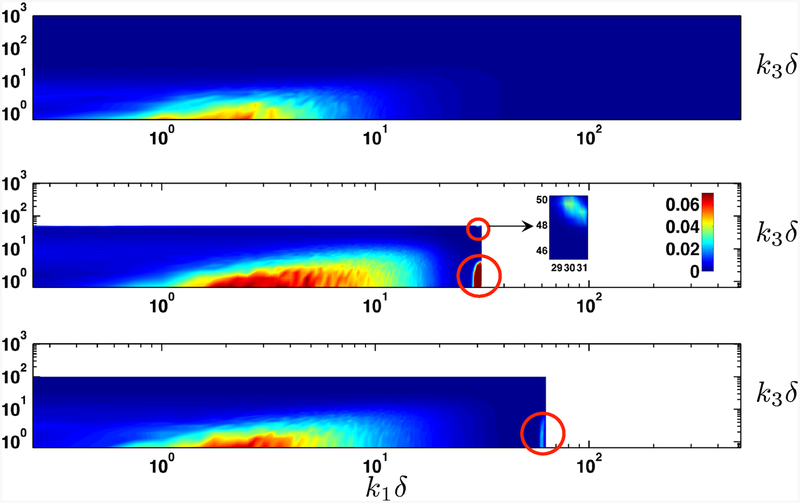
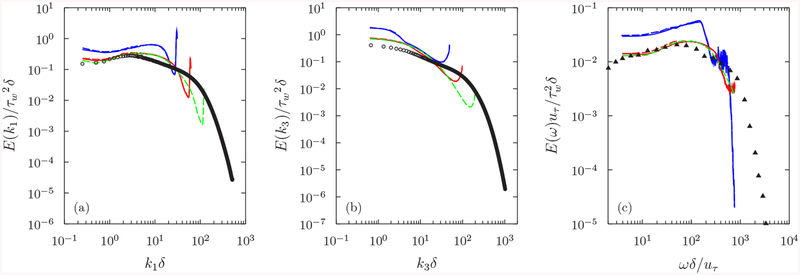
Figure 2 shows contour plots of the streamwise-spanwise wave number spectrum E(k1,k3) of the wall-pressure fluctuations from the LES with the NEQWM. In the baseline WMLES, a high-energy density associated with the 2-Δ wave is visible in the right corners. Since the one-dimensional spectra are obtained by reducing (summing) E(k1,k3) in the remaining direction, it is evident that the 2-Δ wave contaminates E(k1) in high k1, and E(k3) in low and high k3. This is reflected in the plots of E(k1) and E(k3) in Fig. 3. Additionally, the spectra are biased towards the high wave number region compared to the DNS. In the fine WMLES, the influence of the 2-Δ wave is much weaker, and better agreement with the DNS is observed.
FIG. 2.
Contour plots of the two-dimensional streamwise-spanwise wave number power spectrum of the wall-pressure fluctuations . Top, DNS [26]; middle, present WMLES (baseline mesh); bottom, present WMLES (xz-refined-1 mesh). Circled regions in WMLES are contaminated by aliasing.
FIG. 3.
Spectra of the wall-pressure fluctuations: (a) streamwise wave number; (b) spanwise wave number; (c) frequency. In each figure, colors differentiate grid resolutions, and line types differentiate wall models. Blue lines, WMLES with the baseline grid; red lines, WMLES with the xz-refined-1 grid; green lines, WMLES with the xz-refined-2 grid; solid lines, LES with NEQWM; dashed lines, LES with EQWM; circles, DNS of Hoyas and Jiménez [26] (Reτ = 2000); triangles, boundary layer measurement of Farabee and Casarella [36] (Reτ ≈ 1900).
Figure 3 shows the one-dimensional wave number spectra E(k1), E(k3) and the frequency spectrum E(ω) of the wall-pressure fluctuations. The pressure spectra from the calculations with the two different wall models are nearly indistinguishable. The 2-Δ wave is clearly visible in the wave number spectra from the baseline WMLES [Figs. 3(a)–3(b)]. Also, the spectra in the low wave number bands are largely overpredicted. At low wave numbers, E(k1) from the refined calculations agree well with the reference DNS. Aliasing near the cutoff wave number still persists in the refined WMLES, but its amplitude has diminished appreciably. The frequency spectrum shows similar behavior [Fig. 3(c)]. The low-frequency content in the baseline WMLES is overpredicted. Calculations with the baseline and the xz-refined-1 grids exhibit pile-ups in the high-frequency ranges. Under Taylor’s frozen turbulence hypothesis, these frequency ranges correspond to the convection of the spurious high wave number modes whose wavelengths are shorter than 4Δx, with the convection velocity shown in Table II. The aliasing error is dominant in this frequency range, and the spectrum is contaminated. This pile-up is mostly suppressed in the finest grid. Also, the low frequency contents from the two refined calculations are in good agreement with the boundary layer measurement of Farabee and Casarella [36].
TABLE II.
Overall convection velocities of pw, τ1, and τ3 as fractions of the channel centerline velocity (Uc/U0). The numbers outside and inside parentheses are from the LES with the NEQWM and the LES with the EQWM, respectively. The calculation with the finest grid (xz-refined-2) was done with the EQWM only.
| Case | pw | τ1 | τ3 |
|---|---|---|---|
| Present WMLES (baseline) | 0.56 (0.49) | 0.71 (0.76) | 0.69 (0.77) |
| Present WMLES (xz-refined-1) | 0.63 (0.58) | 0.72 (0.74) | 0.68 (0.77) |
| Present WMLES (xz-refined-2) | (0.57) | (0.76) | (0.77) |
Note that the wall-pressure spectra from WMLES (for high wave number or frequency ranges before the pile-up) show convergence to spectra that have steeper slope than those from the DNS and the experiment. Because this portion of the spectrum is known to be related with the eddies residing in the buffer layer and in the lower end of the logarithmic layer [37], the present WMLES with a coarse wall-normal resolution (Δy+ = 40) not resolving those eddies is unable to reproduce the high wave number or frequency pressure spectra correctly. It is expected that adequately resolving the eddies below the buffer layer could produce the correct slopes, but this would certainly defeat the purpose of wall modeling. In this context, one should not aim at predicting the high wave number or frequency wall-pressure spectra accurately with WMLES, but it is emphasized that the mean-square pressure fluctuations and the low wave number or frequency spectra can be still predicted reasonably well.
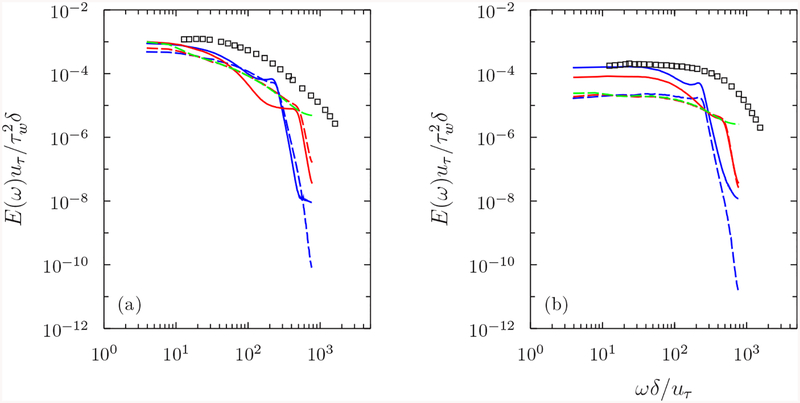
Since the reference DNS does not report spectra of τ1 and τ3, comparisons are made against a channel DNS data at a comparable Reynolds number [38] (Reτ = 1450) for the frequency spectra only (Fig. 4). Since τ1,rms and τ3,rms are underpredicted significantly, large deficits are expected in their spectra. In general, the low-frequency spectra of τ1 and τ3 from the NEQWM show better agreement with the DNS than those from the EQWM. However, the lack of energy in the high-frequency band in both τ1 and τ3 suggests that a proper representation of the small near-wall eddies with short time scales is crucial for accurate prediction of the wall shear-stress fluctuations, which cannot be achieved with RANS-based wall models. The spectra of τ1 and τ3 from the NEQWM exhibit plateaus at large ω, which are absent in the EQWM. The frequency range of these plateaus overlaps with those of the spurious pressure modes in Fig. 3, which suggests that the wall-shear stress fluctuations from the NEQWM are affected by the aliased LES pressure.
FIG. 4.
Frequency spectra of the wall shear-stress fluctuations: (a) τ1; (b) τ3. Colors differentiate grid resolutions, and line-types differentiate wall models. Blue lines, WMLES with the baseline grid; red lines, WMLES with the xz-refined-1 grid; green lines, WMLES with the xz-refined-2 grid; solid lines, LES with NEQWM; dashed lines, LES with EQWM; squares, channel DNS of Hu et al. [38] (Reτ = 1450).
E. Correlations
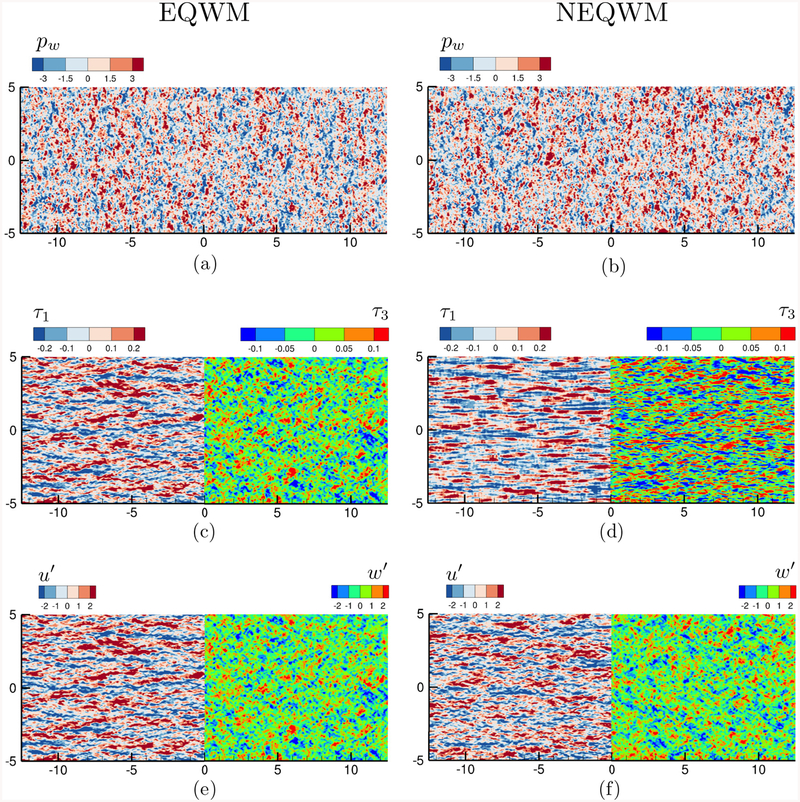
The two-point correlations and convection velocities of the wall variables are analyzed in this section. Before describing the results, it is worth inspecting the instantaneous fields in order to contrast the spatial structures of the wall variables obtained with the two wall models. Instantaneous snapshots of the wall-pressure and wall shear-stress fluctuations are visualized in Fig. 5, together with the streamwise and spanwise velocity fluctuations from the LES (u′ and w′) on the matching plane. In the contours of u′, streaky large-scale motions (LSMs) with lengths of approximately δ–3δ in the streamwise direction and up to δ in the spanwise direction are observed on the matching plane located near the lower end of the log layer. Pressure fields obtained with the two wall models are qualitatively similar, as their spectra are almost identical.
FIG. 5.
Instantaneous contours of the wall variables on the lower wall from the WMLES with the xz-refined-1 grid: top, ; middle, (left half) and (right half); bottom, u′+ (left half) and w′+ (right half) from the LES at the matching location (y+ = 200). Panels (a), (c), and (e) are from the LES with the EQWM, and panels (b), (d), and (f) are from the LES with the NEQWM.
Notable difference is found in the wall shear-stress fluctuations. In the EQWM, the wall shear-stress fluctuations are perfectly correlated with the velocity fluctuations imposed on the wall model top boundary. This is a direct consequence of the quasisteady assumption and the linear dependency of the EQWM solution on the top boundary conditions, as in the model of Schumann [5]. The situation is somewhat different in the NEQWM. The footprint of LSMs from the LES is still found in the contour of τ1, but at slightly upstream locations. Also, compared to the EQWM, the energetic structures of τ3 are more elongated in the streamwise direction, and structures with small spanwise scales are more densely populated. In view of the model of Piomelli et al. [39] and the recent inner-outer layer model [40], the phase lag of the wall shear-stress fluctuations due to the inclined LSMs seems to be better accounted for by the NEQWM than by the EQWM.
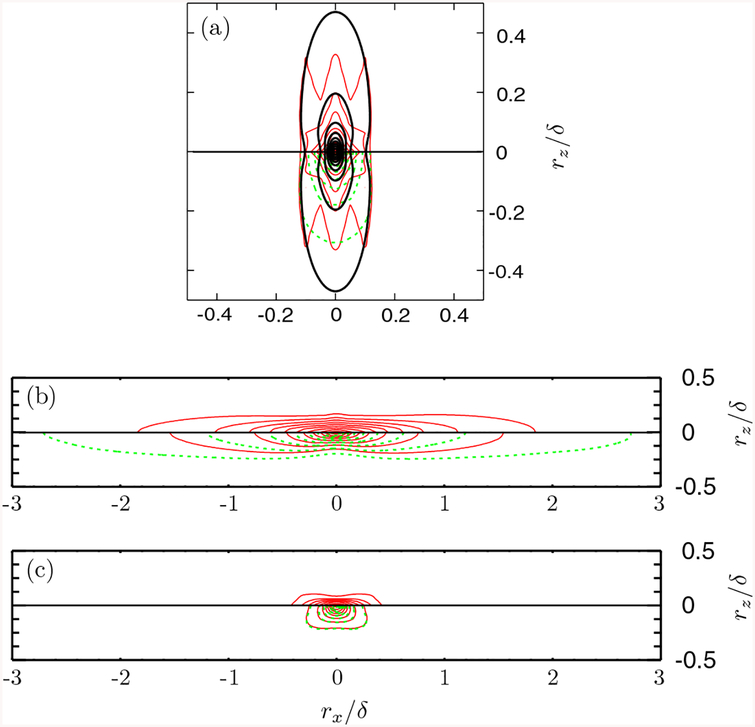
The aforementioned structures of the wall variables are characterized in an average sense by the two-point autocorrelations R(rx,rz), shown in Fig. 6. As expected, the pressure correlations in Fig. 6(a) obtained with the two wall models show little difference. Although not shown here for brevity, unphysical repeating patterns separated by Δrx = 2Δx = 0.2 were found in the baseline WMLES due to too high energy near the cutoff wave number. The presence of the large scale serrations in the medium-resolution grid (xz-refined-1) suggests that the integral scales of the wall-pressure fluctuations are still not well resolved. Such spurious patterns are suppressed in the finest grid, and closer agreement with the DNS is found. The contours in the fine WMLES and the DNS have circular shapes at small separations and oval shapes elongated in the spanwise direction at large separations. This is consistent with the findings in the literature [30,34].
FIG. 6.
Contours of the streamwise-spanwise two-point autocorrelation R(rx,rz): (a) pw, (b) τ1, (c) τ3. Lines in the top half (rz > 0) are from the LES with the NEQWM, and lines in the bottom half (rz < 0) are from the LES with the EQWM. Red solid lines, WMLES with the xz-refined-1 grid; green dashed lines, WMLES with the xz-refined-2 grid; black solid line in panel a, DNS [26,32]. Contour levels from 0.1 to 0.9 with 0.1 increment.
In Fig. 6(b) the correlation structures of τ1 from the two wall models are similar. Unlike pw, the large-scale fluctuations of τ1 are elongated in the streamwise direction. Difference between the two wall models is more pronounced in τ3, as in its spectra and instantaneous structures. The large-scale fluctuations of τ3 from the NEQWM are elongated in the streamwise direction, whereas those from the EQWM are more isotropic [Fig. 6(c)].
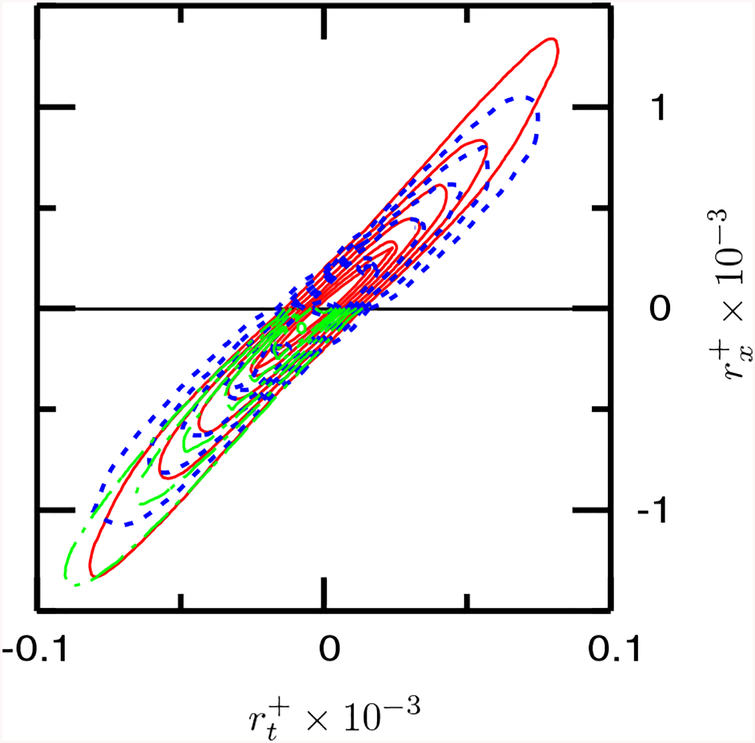
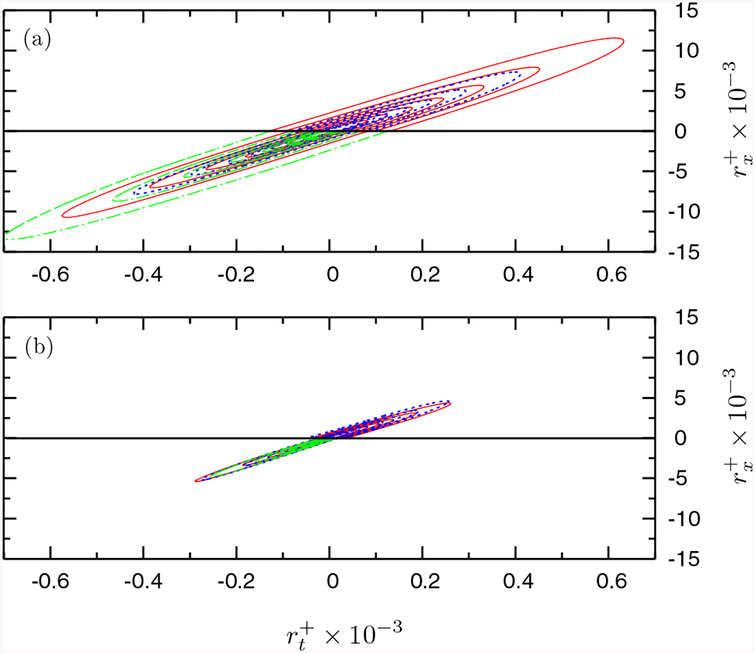
Figures 7 and 8 show the contours of the spatiotemporal two-point autocorrelation R(rx,rt). The strong convective nature of the wall variables is implied by the contours clustered in a thin band. The slope of this narrow band is generally interpreted as the convection velocity Uc. The overall convection velocities of the wall variables found from [30,41]
| (13) |
are summarized in Table II. The function F(U) had a unique maximum for each of the wall variables. As expected, only the convection velocity of pw responds to the outer-layer grid refinement, whereas the convection velocities of τ1 and τ3 do not. The convection velocity of pw is underpredicted compared to the often quoted values Uc/U0 = 0.7–0.8 [30,34,36,42], where U0 is the channel centerline (or freestream) velocity. Uc of pw obtained with the NEQWM seems more accurate than that obtained with the EQWM. The convection velocities of τ1 and τ3 are nearly the same, and their values from the EQWM are slightly higher than those from the NEQWM. No reference data for Uc of τ1 and τ3 are found at comparable Reynolds numbers, but Jeon et al. [41] reported 0.53U0 and 0.57U0 for τ1 and τ3 in their low Reynolds number channel DNS at Reτ = 180. It is conjectured that the present WMLES overpredicts the convection velocities of τ1 and τ3, especially in the EQWM where the high-speed footprint of LSMs are projected directly.
FIG. 7.
Contours of the streamwise-temporal two-point autocorrelation R(rx,rt) of pw. Lines in the top half (rx > 0) are from the LES with the NEQWM, and lines in the bottom half (rx < 0) are from the LES with the EQWM. Blue dashed line, present WMLES (baseline mesh); red solid line, present WMLES (xz-refined-1 mesh); green dash-dotted lines, present WMLES (xz-refined-2 mesh). Contour levels from 0.2 to 0.9 with 0.1 increment.
FIG. 8.
Contours of the streamwise-temporal two-point autocorrelation R(rx,rt): (a) τ1, (b) τ3. Lines in the top half (rx > 0) are from the LES with the NEQWM, and lines in the bottom half (rx < 0) are from the LES with the EQWM. Blue dashed line, present WMLES (baseline mesh); red solid line, present WMLES (xz-refined-1 mesh). green dash-dotted lines, present WMLES (xz-refined-2 mesh). Contour levels from 0.2 to0.9 with 0.1 increment.
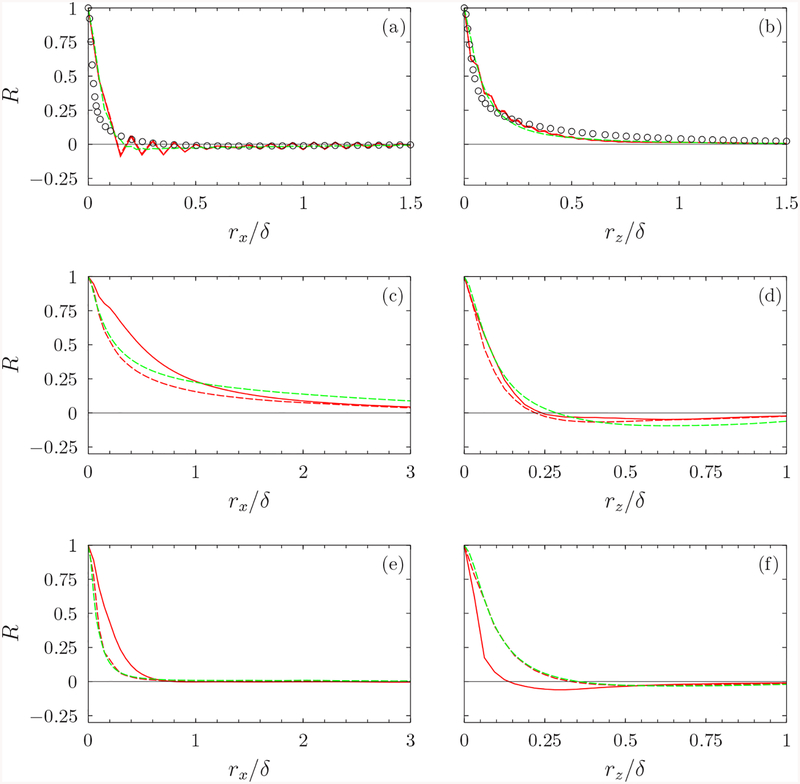
Figure 9 shows the one-dimensional spatial autocorrelations R(rx) and R(rz) of the wall variables. In their analysis of the reference DNS [26], Sillero et al. [32] obtained the integral lengths by integrating R from r = 0 to r = rc, where rc is the first zero of R (if any), or the closest intersection with R = 0.05. With this definition, the integral lengths of pw from the DNS [Figs. 9(a)–9(b)] are about 0.1δ and 0.36δ in the streamwise and spanwise directions, respectively. Obviously, such large-scale fluctuations of pw are not resolved in the baseline and the xz-refined-1 grids, and they are resolved marginally on the finest grid. This is reflected in the oscillation-free autocorrelations from the finest grid (xz-refined-2) [Figs. 9(a) and 9(b)].
FIG. 9.
One-dimensional spatial autocorrelations R(rx) and R(rz) of (a), (b) pw, (c), (d) τ1, (e), (f) τ3. Colors differentiate grid resolutions, and line-types differentiate wall models. Red lines, WMLES with the xz-refined-1 grid; green lines, WMLES with the xz-refined-2 grid; solid lines, LES with NEQWM; dashed lines, LES with EQWM; circles, DNS [26,32] (Reτ = 2000).
The two-point autocorrelations of τ1 and τ3 are shown in Figs. 9(c)–9(f), respectively. Large decorrelation length of τ1 in the streamwise direction again reflects the influence of the elongated streaky structures in the outer layer. Negative spanwise correlations are observed in both τ1 and τ3. Their minima are located at small separation distance of roughly rz = 0.3δ, which implies that the mean-spanwise spacing of the large scale structures near the matching location is 0.6δ.
IV. CONCLUSION
In the present study, the space-time characteristics of the wall-pressure and wall shear-stress fluctuations obtained from WMLES of a channel flow at Reτ = 2000 were investigated. The choice of wall model seems to have negligible effect on the wall-pressure field in this flow. While the velocity statistics are predicted reasonably well on the coarse grid (δ/Δx = 10 and δ/Δz = 16), prediction of the wall-pressure fluctuations to a comparable accuracy required additional wall-parallel grid resolution such that δ/Δx > 20 and δ/Δz > 30. Otherwise the pressure field is severely contaminated by the spurious 2-Δ waves, and the pressure statistics and spectra are overpredicted. When these conditions are met, the r.m.s fluctuations and low wave number or low-frequency spectra of the wall-pressure fluctuations agree reasonably well with the DNS and experimental data. The resolution requirement for accurate prediction of the wall-pressure fluctuations therefore seems to be more stringent than that required for the mean velocity. This aspect may have been overlooked in the previous WMLES computations which had comparable or coarser resolution in the wall-parallel directions. It warrants further investigation, especially when the technique is to be used for noise or vibration prediction.
Unlike the wall-pressure fluctuations, the wall shear-stress fluctuations modeled entirely through the RANS-based wall models are underpredicted. Furthermore, the LES grid refinement in the wall-parallel directions did not improve the prediction. The spectra of the shear-stress fluctuations show significant energy deficit in the high-frequency range, suggesting that the small eddies that are neither resolved nor modeled adequately by the RANS-based wall models make important contributions to the wall shear-stress fluctuations. We therefore conclude that LES employing RANS-based wall models has the inherent problem in predicting the wall-shear stress fluctuations. One may need a more sophisticated wall-layer model for accurate estimation of the wall-shear stress fluctuations. For instance, the recent inner-outer interaction model [40] accurately captures the shear stress fluctuations by accounting for the amplitude modulation of the small scales by the large-scale log-region motions.
The convection velocity of the wall-pressure fluctuations from the present WMLES improves with the outer layer grid refinement, but it is underpredicted by 10%–20% compared to the values reported in the literature.
In summary, we suggest that the large-scale features of the wall-pressure fluctuations are mostly signatures of the outer-layer structures and therefore can be reasonably well-predicted with WMLES. On the contrary, proper representation of the fast, small near-wall eddies seems to be necessary for correct prediction of wall shear-stress fluctuations, and therefore the RANS-based wall models do not predict them accurately regardless of the grid resolution.
ACKNOWLEDGMENTS
This work was supported by the Winston and Fu-Mei Stanford Graduate Fellowship and NASA Aeronautics Scholarship Program, and by NASA under the Subsonic Fixed-Wing Program (Grant No. NNX11AI60A). The authors are grateful to Prof. Javier Jiménez and Dr. Juan Sillero for providing the pressure spectra and correlation data from the reference DNS.
References
- [1].Jiménez J and Moser RD, Large-eddy simulations: Where are we and what can we expect? AIAA J. 38, 605(2000). [Google Scholar]
- [2].Sayadi T and Moin P, Large eddy simulation of controlled transition to turbulence, Phys. Fluids 24, 114103(2012). [Google Scholar]
- [3].Choi H and Moin P, Grid-point requirements for large eddy simulation: Chapman’s estimates revisited, Phys. Fluids 24, 011702(2012). [Google Scholar]
- [4].Deardorff JW, The numerical study of three dimensional turbulent channel flow at large Reynolds numbers, J. Fluid Mech 41, 453(1970). [Google Scholar]
- [5].Schumann U, Subgrid scale model for finite difference simulations of turbulent flows in plane channels and annuli, J. Comput. Phys 18, 376(1975). [Google Scholar]
- [6].Balaras E, Benocci C, and Piomelli U, Two-layer approximate boundary conditions for large-eddy simulations, AIAA J. 34, 1111(1996). [Google Scholar]
- [7].Cabot W and Moin P, Approximate wall boundary conditions in large-eddy simulation of high Reynolds number flow, Flow Turbul. Combust 63, 269(2000). [Google Scholar]
- [8].Wang M and Moin P, Dynamic wall modeling for large-eddy simulation of complex turbulent flows, Phys. Fluids 14, 2043(2002). [Google Scholar]
- [9].Kawai S and Larsson J, Wall-modeling in large eddy simulation: Length scales, grid resolution, and accuracy, Phys. Fluids 24, 015105(2012). [Google Scholar]
- [10].Bodart J and Larsson J, Sensor-based computation of transitional flows using wall-modeled large eddy simulation, in Annual Research Briefs (Center for Turbulence Research, Stanford University, 2012), pp. 229–240. [Google Scholar]
- [11].Kawai S and Larsson J, Dynamic non-equilibrium wall-modeling for large eddy simulation at high Reynolds numbers, Phys. Fluids 25, 015105(2013). [Google Scholar]
- [12].Park GI and Moin P, An improved dynamic non-equilibrium wall-model for large eddy simulation, Phys. Fluids 26, 015108(2014). [Google Scholar]
- [13].Yang XIA, Sadique J, Mittal R, and Meneveau C, Integral wall model for large eddy simulations of wall-bounded turbulent flows, Phys. Fluids 27, 025112(2015). [Google Scholar]
- [14].Chung D and Pullin DI, Large-eddy simulation and wall modeling of turbulent channel flow, J. Fluid Mech 631, 281(2009). [Google Scholar]
- [15].Inoue M and Pullin DI, Large-eddy simulation of the zero-pressure gradient turbulent boundary layer up to Reθ = O(1012), J. Fluid Mech 686, 507(2011). [Google Scholar]
- [16].Bose ST and Moin P, A dynamic slip boundary condition for wall-modeled large-eddy simulation, Phys. Fluids 26, 015104(2014). [Google Scholar]
- [17].Lighthill MJ, On sound generated aerodynamically: I. General theory, Proc. R. Soc. London 211, 564(1952). [Google Scholar]
- [18].Ffowcs Williams JE and Hawkings DL, Sound generation by turbulence and surfaces in arbitrary motions, Philos. Trans. R. Soc. London 264, 321(1969). [Google Scholar]
- [19].Wang M, Freund JB, and Lele SK, Computational prediction of flow-generated sound, Annu. Rev. Fluid Mech 38, 483(2006). [Google Scholar]
- [20].Howe MS, A review of the theory of trailing edge noise, J. Sound Vib 61, 437(1978). [Google Scholar]
- [21].Brooks TF and Hodgson TH, Trailing edge noise prediction from measure surface pressure, J. Sound Vib 78, 69(1981). [Google Scholar]
- [22].Amiet RK, Noise due to turbulent flow past a trailing edge, J. Sound Vib 47, 387(1976). [Google Scholar]
- [23].Amiet RK, Acoustic radiation from an airfoil in a turbulent stream, J. Sound Vib 41, 407(1975). [Google Scholar]
- [24].Brès GA, Ham FE, Nichols JW, and Lele SK, Nozzle wall modeling in unstructured large eddy simulations for hot supersonic jet predictions, AIAA Paper No. 2013–2142 (2013). [Google Scholar]
- [25].Brès GA, Jaunet V, Le Rallic M, Peter Jordan, Colonius T, and Lele SK, Large eddy simulation for jet noise: the importance of getting the boundary layer right, AIAA Paper No. 2015–2535 (2015). [Google Scholar]
- [26].Hoyas S and Jiménez J, Scaling of the velocity fluctuations in turbulent channels up to Reτ = 2003, Phys. Fluids 18, 011702(2006). [Google Scholar]
- [27].Khalighi Y, Ham F, Moin P, Lele SK, Schlinker R, Reba R, and Simonich J, Noise prediction of pressure-mismatched jets using unstructured large eddy simulation, in ASME Turbo Expo (Paper No. GT2011–46548) (2011). [Google Scholar]
- [28].Park GI and Moin P, Numerical aspects and implementation of a two-layer zonal wall model for LES of compressible turbulent flows on unstructured meshes, J. Comput. Phys 305, 589(2016). [Google Scholar]
- [29].Bodart J and Larsson J, Wall-modeled large eddy simulation in complex geometries with application to high-lift devices, in Annual Research Briefs (Center for Turbulence Research, Stanford University, 2011), pp. 37–48. [Google Scholar]
- [30].Choi H and Moin P, On the space-time characteristics of wall-pressure fluctuations, Phys. Fluids A 2, 1450(1990). [DOI] [PMC free article] [PubMed] [Google Scholar]
- [31].Moin P, Fundamentals of Engineering Numerical Analysis, 2nd ed. (Cambridge University Press, New York, 2010). [Google Scholar]
- [32].Sillero JA, Jiménez J, and Moser RD, Two-point statistics for turbulent boundary layers and channels at Reynolds numbers up to δ+ ≈ 2000, Phys. Fluids 26, 105109(2014). [Google Scholar]
- [33].Lee J, Cho M, and Choi H, Large eddy simulations of turbulent channel and boundary layer flows at high Reynolds number with mean wall shear stress boundary condition, Phys. Fluids 25, 110808(2013). [Google Scholar]
- [34].Willmarth WW, Pressure fluctuations beneath turbulent boundary layers, Annu. Rev. Fluid Mech 7, 13(1975). [Google Scholar]
- [35].Kravchenko AG, Choi H, and Moin P, On the relation of near-wall streamwise vortices to wall skin friction in turbulent boundary layers, Phys. Fluids A 5, 3307(1993). [Google Scholar]
- [36].Farabee TM and Casarella MJ, Spectral features of wall pressure fluctuations beneath turbulent boundary layers, Phys. Fluids A 3, 2410(1991). [Google Scholar]
- [37].Bradshow P, Inactive motion and pressure fluctuations in turbulent boundary layers, J. Fluid Mech 30, 241(1967). [Google Scholar]
- [38].Hu ZW, Morfey CL, and Sandham ND, Wall pressure and shear stress spectra from direct simulations of channel flow, AIAA J. 44, 1541(2006). [Google Scholar]
- [39].Piomelli U, Ferziger J, Moin P, and Kim J, New approximate boundary conditions for large eddy simulations of wall-bounded flows, Phys. Fluids A 1, 1061(1989). [Google Scholar]
- [40].Mathis R, Marusic I, Chernyshenko SI, and Hutchins N, Estimating wall-shear-stress fluctuations given an outer region input, J. Fluid Mech 715, 163(2013). [Google Scholar]
- [41].Jeon S, Choi H, Yoo J, and Moin P, Space-time characteristics of the wall shear-stress fluctuation in a low Reynolds number channel flow, Phys. Fluids 11, 3084(1999). [Google Scholar]
- [42].Kim J, On the structure of pressure fluctuations in simulated turbulent channel flow, J. Fluid Mech 205, 421(1989). [Google Scholar]


