Abstract
In the US, cardiovascular disease, cancer, and diabetes are in the top ten leading causes of death categories. The diseases compromise US life-expectancy and account for significant US health-care costs. This observational study investigates the US population’s 1997–2017 Centers for Disease Control and Prevention (CDC) WONDER ICD-10 mortality records to extract the prevalence rates for leading causes of death by diabetes, neoplasms (cancers), and diseases of the circulatory system. The variables of race and age are examined for each disease in order to evaluate demographic and age-group risks. To document the public health burden from these three chronic conditions, mortality data from CDC WONDER was analyzed using MS-Excel and Statistical Analysis System (SAS) software. The general trend of deaths by diabetes, neoplasms, and diseases of the circulatory system has been progressively decreasing nationally; however, a significantly higher trend in mortality rates is observed for the Black or African American populations. Furthermore, over the 1997–2017 observational period, the crude mortality rates for the 45–54 (middle-age) and lower age-groups are below national mortality rate averages but are troublingly increasing for diabetes and notably, for the diseases of the circulatory system, the (younger) 25–34 age-group had a crude mortality rate increase of 6.78%.
I. INTRODUCTION
In 2004, it was estimated that cardiovascular diseases, cancer, and diabetes, accounted for two-thirds of all US deaths and approximately $700 billion in associated health-care costs [1]. In 2017, heart disease and cancer are still found to be the first and second leading causes of death, and diabetes, the seventh leading cause of death [2], [3]. However, due to concerted public health programs for chronic disease control efforts and due to the advancements in screening and clinical treatment, the risk of death from complications from the three listed conditions has steadily declined [4], [5].
On the other hand, US obesity rates continue to rise sharply, [6]–[8] and obesity is shown to be significantly impacting the US population’s mortality rates [9]–[12]. Additionally, a number of studies have linked the pathologies of cancer, cardiovascular disease, and diabetes to obesity [5], [9]–[20] . Hence, for qualified judgements, it is of interest to compare the mortality rate trends where obesity (or overweight) was listed as a causative or contributory factor in death, to cases where cancer, cardiovascular disease, and diabetes, are primary underlying contributary factors.
In the US, data on the underlying leading causes of death [24] are widely available to the public on the Centers for Disease Control and Prevention (CDC) Wide-ranging Online Data for Epidemiologic Research (WONDER) database [25]. The extensive data include documented cause of death categories using the Tenth Revision of the International Classification of Diseases (ICD-10) coding [26], [27]. Since no uniform medical certificate of death exists, each death’s underlying cause is selected from an array of conditions reported in the medical certification section on the death certificate [24], [28], [29]. As a result, there are a variety of ICD-10 code reporting errors [13], [30]. However, the ICD-10 code data has been shown to have significant clinical value in physician-patient settings [31]–[33], and the public CDC WONDER database’s ICD-10 information has generated valuable awareness on the negative impacts of the nation’s waistline on human health [10], [12], [13], [20], [34]–[37].
In the past two decades, the average body mass index of a vast majority of Americans has appreciably increased [6], [38]. As a direct result, evidence from epidemiological studies show that their life-expectancy [39], [40] and quality of life are gradually decreasing [14], [41]. Obesity has detrimental impacts on joints, muscles, and bones, [42]–[44] and its health risks associated with chronic health conditions [5], [9]–[20] including diabetes [15], [21], [23], [25], malignant neoplasms (cancers) [45]–[47], and diseases of the circulatory system [15], [19], [21], [23], [34], [46], are well documented.
A recent thorough analysis [10] of the archived 1999–2016 CDC WONDER ICD-10 overweight and obesity codes on US death certificates revealed that even though obesity is impacting all segments of the US population, it is disproportionally affecting those who are from the Black or African American (B/AA) and the American Indian or Alaska Native (AI/AN) races. The study also showed surging crude death rates for all the decennial age-groups, where obesity (or being overweight) was listed as a contributing factor on the death certificate, and the (near middle-age) 35–44 age-group experienced the highest crude death rate increase of 174.93% [10].
While the age adjusted mortality rates associated with complications from chronic conditions has steadily declined [3]–[5], the frequency of death from diabetes, malignant neoplasms, and cardiovascular issues, as aggregated for the entire US population are key indicators of health outcomes, as they continue to be largely responsible for the leading causes of death nationally [2], [3]. To elucidate any probable increased risk with abdominal fatness [6], [23], [25], [40], this project’s objective is to explore the 1999–2017 CDC WONDER ICD-10 mortality records for diabetes, neoplasms, and diseases of the circulatory system, and compare the results to the prior published 1999–2016 obesity prevalence [7], [8] and obesity-related mortality data [10].
II. Methods
The 1999–2017 mortality records for diabetes, neoplasms, and diseases of the circulatory system data was data-mined from the CDC WONDER public database [25] records using Statistical Analysis System (SAS) software. The ICD-10 codes for the three disease categories of interest are: diabetes mellitus, E10-E14, neoplasms, C00-D48, and diseases of the circulatory system, I00-I99. The national mortality rates for each disease for all 50 US states and the District of Columbia was subset by population demographics—ethnicity/race (White, Black or African American, Asian or Pacific Islander and American Indian or Alaskan Native) and 10-year (decennial) age-group categories (15–24, 25–34, 35–44, 45–54, 55–64, 65–74, 75–84 and 85+). For each year, CDC WONDER also provides the bridged-race population estimates [22] and these numbers are updated annually. In this project, age adjusted mortality rates per 100,000 are utilized [3], [10], [12], [13], [20] when available, to remove the effects of age from crude rates. This allows for meaningful comparisons across populations with differing underlying age structures. Apart from 10-year age-groups, age adjusted rates are used for the purpose of this study. The datasets were downloaded into MS-Excel, and the SAS program was used for graph creation. For the race categories, to highlight the confidence intervals (CI), confidence bands are used to show the confidence limits.
III. Results and Discussion
Figs. 1–3and Table I portray the 1999–2017 race-based age adjusted mortality rate figures due to the chronic conditions of diabetes, neoplasms, and diseases of the circulatory system.
Figure 1.
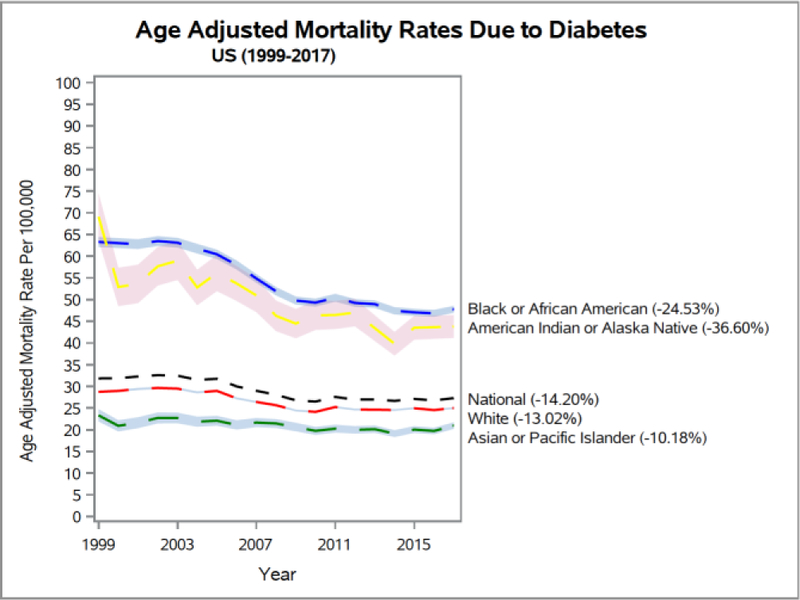
1999–2017 US age adjusted mortality rates due to diabetes.
Figure 3.
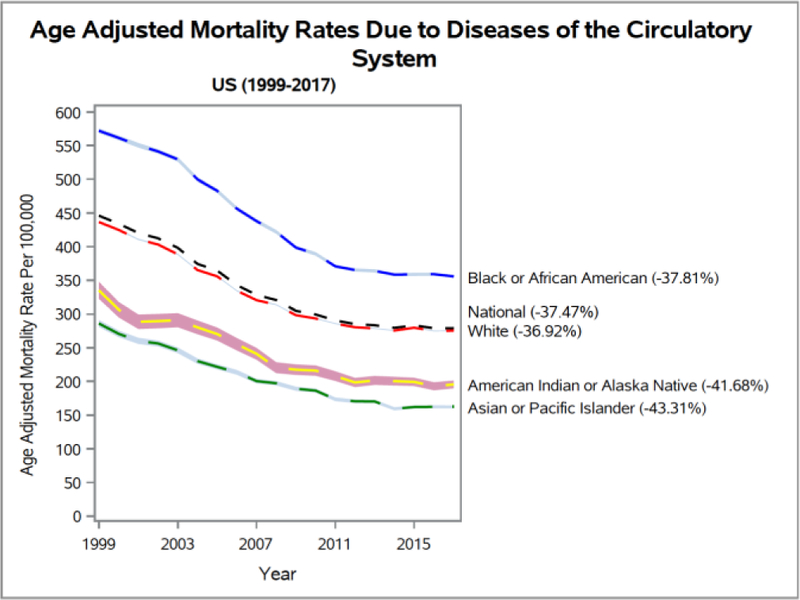
1999–2017 US age adjusted mortality rates due to diseases of the circulatory system.
Table I.
Age Adjusted Mortality Rates By Race
| Year/Race | Disease | Rate | 95% CI |
|---|---|---|---|
| 1999 | Diabetes | ||
| White | 28.74 | [28.50, 28.98] | |
| Black or African American | 63.26 | [62.11, 64.41] | |
| Asian or Pacific Islander | 23.31 | [21.90, 24.73] | |
| American Indian or Alaska Native | 69.06 | [63.67, 74.45] | |
| Neoplasms | |||
| White | 257.52 | [256.80, 258.25] | |
| Black or African American | 326.87 | [324.28, 329.46] | |
| Asian or Pacific Islander | 159.04 | [155.54, 162.53] | |
| American Indian or Alaska Native | Circulatory System Diseases | 175.75 | [167.20, 184.30] |
| White | 436.62 | [435.68, 437.56] | |
| Black or African American | 572.03 | [568.52, 575.54] | |
| Asian or Pacific Islander | 286.08 | [280.91, 291.25] | |
| American Indian or Alaska Native | 335.13 | [322.55, 347.72] | |
| 2017 | Diabetes | ||
| White | 25.00 | [24.80, 25.20] | |
| Black or African American | 47.74 | [46.95, 48.53] | |
| Asian or Pacific Islander | 20.94 | [20.19, 21.69] | |
| American Indian or Alaska Native | Neoplasms | 43.78 | [41.14, 46.42] |
| White | 200.45 | [199.90, 201.01] | |
| Black or African American | 224.01 | [222.32, 225.70] | |
| Asian or Pacific Islander | 122.69 | [120.91, 124.47] | |
| American Indian or Alaska Native | 128.30 | [123.81, 132.79] | |
| White | Circulatory System Diseases | 275.40 | [274.76, 276.05] |
| Black or African American | 355.75 | [353.58, 357.93] | |
| Asian or Pacific Islander | 162.19 | [160.90, 164.29] | |
| American Indian or Alaska Native | 195.46 | [189.64, 201.27] |
For the three chronic diseases, when the number of deaths is adjusted for ageing in all races as in Figs. 1–3, it shows that the age adjusted death rates are declining rapidly. In Figs. 1–3, the upper and lower bounds of the confidence bands merge at few points. For diabetes (Fig. 1), the B/AA and AI/AN death rates are much higher than the national averages. In addition, the B/AA death rates are considerably above the age adjusted national mortality death rates due to neoplasms (d diseases of the circulatory system (Fig. 3). The AI/AN mortality rates dip markedly below the national averages in Figs. 2 and 3. Diversely in Fig. 1, the mortality rates for the White (W) race trends a little lower than the national averages, and, for Figs. 2 and 3, it coincides with the national averages at several points. Also, Figs.1–3, show the morality rates for the Asian or Pacific Islander (A/PI) race are consistently far beneath the national trend lines.
Figure 2.
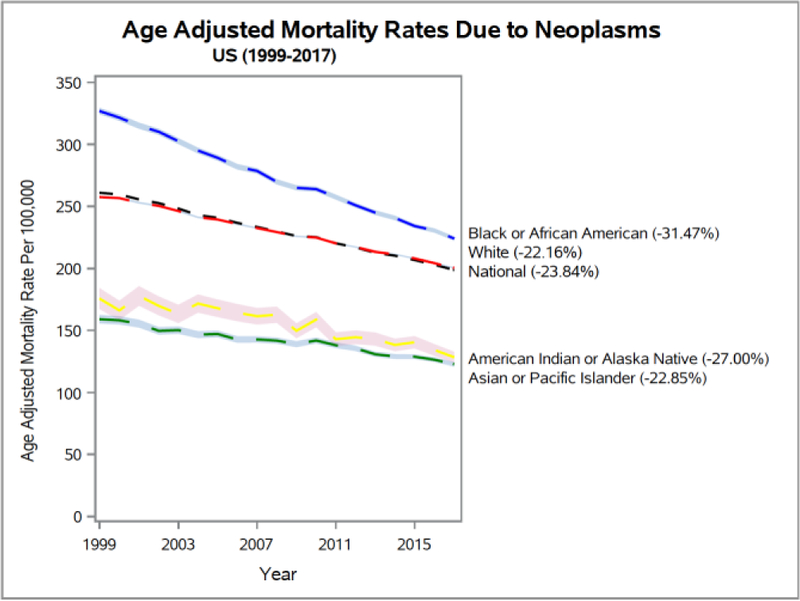
1999–2017 US age adjusted mortality rates due to neoplasms
To examine the relationships between age and the observed national mortality rate averages for diabetes, neoplasms, and the diseases of the circulatory system, Figs. 4–3 and Table II, provide the 1999–2017 crude mortality rate information for the 15–85+ decennial age-group categories (15–24, 25–34, 45–54, 55–64, 75–84, and 85+). In general, for the three disease conditions, groups below the (middle-age) 45–54 age range, fall appreciably below the 1997–2017 national mortality rate averages, and for the diseases of the circulatory system, the 55–64 age group fell slightly below the national averages.
Figure 4.
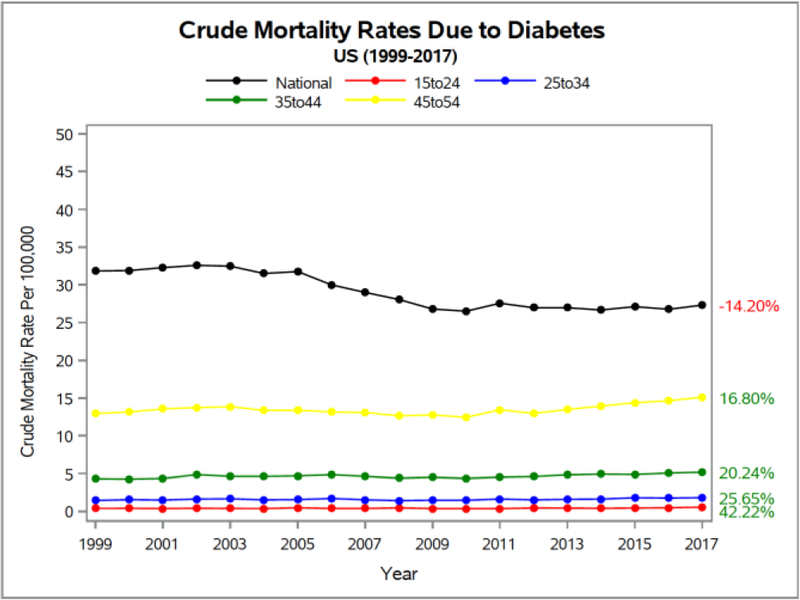
1999–2017 US crude mortality rates due to diabetes for the age-groups, 15–24, 25–34, 35–44, and 45–54.
Table II.
Crude Mortality Rates By decennial age-groups
| Year/Age–Group | Disease | Rate | 95% CI |
|---|---|---|---|
| 1999 | Diabetes | ||
| 15–24 | 0.40 | [0.34, 0.46] | |
| 25–34 | 1.45 | [1.33, 1.57] | |
| 35–44 | 4.31 | [4.12, 4.50] | |
| 45–54 | 12.95 | [12.58, 13.31] | |
| 55–64 | 38.26 | [37.47, 39.04] | |
| 65–74 | 91.80 | [90.41, 93.18] | |
| 75–84 | 177.97 | [175.61, 180.34] | |
| 85+ | 317.24 | [311.82, 322.65] | |
| Neoplasms | |||
| 15–24 | 4.71 | [4.49, 4.93] | |
| 25–34 | 10.39 | [10.08, 10.71] | |
| 35–44 | 37.88 | [37.31, 38.45] | |
| 45–54 | 129.43 | [128.27, 130.60] | |
| 55–64 | 379.34 | [376.87, 381.82] | |
| 65–74 | 841.65 | [837.46, 845.84] | |
| 75–84 | 1368.04 | [1361.49, 1374.60] | |
| 85+ | 1888.70 | [1875.49, 1901.92] | |
| Circulatory System Diseases | |||
| 15–24 | 3.48 | [3.29, 3.66] | |
| 25–34 | 9.87 | [9.56, 10.18] | |
| 35–44 | 38.34 | [37.77, 38.91] | |
| 45–54 | 117.26 | [116.15, 118.37] | |
| 55–64 | 329.20 | [326.90, 331.51] | |
| 65–74 | 891.04 | [886.73, 895.35] | |
| 75–84 | 2484.02 | [2475.18, 2492.85] | |
| 85+ | 8220.52 | [8192.95, 8248.10] | |
| 2017 | Diabetes | ||
| 15–24 | 0.57 | [0.50, 0.64] | |
| 25–34 | 1.82 | [1.69, 1.94] | |
| 35–44 | 5.18 | [4.96, 5.40] | |
| 45–54 | 15.12 | [14.75, 15.49] | |
| 55–64 | 35.49 | [34.92, 36.06] | |
| 65–74 | 71.91 | [70.94, 72.87] | |
| 75–84 | 140.77 | [138.86, 142.69] | |
| 85+ | 262.39 | [258.44, 266.33] | |
| Neoplasms | |||
| 15–24 | 3.36 | [3.19, 3.53] | |
| 25–34 | 8.29 | [8.03, 8.56] | |
| 35–44 | 27.17 | [26.66, 27.67] | |
| 45–54 | 94.00 | [93.08, 94.92] | |
| 55–64 | 277.02 | [275.43, 278.62] | |
| 65–74 | 577.99 | [575.25, 580.72] | |
| 75–84 | 1092.38 | [1087.04, 1097.73] | |
| 85+ | 1682.46 | [1672.46, 1692.46] | |
| Circulatory System Diseases | |||
| 15–24 | 2.72 | [2.57, 2.88] | |
| 25–34 | 10.54 | [10.24, 10.84] | |
| 35–44 | 33.12 | [32.56, 33.67] | |
| 45–54 | 97.43 | [96.50, 98.37] | |
| 55–64 | 239.28 | [237.80, 240.76] | |
| 65–74 | 508.57 | [506.00, 511.14] | |
| 75–84 | 1396.90 | [1390.86, 1402.94] | |
| 85+ | 5263.48 | [5245.80, 5281.16] |
These observations are in line with prior 1999–2016 obesity prevalence [7], [8], and obesity related mortality data [10]. From 1999 to 2016 there was a 29.8% increase in age adjusted obesity prevalence among US adults (aged 20 years and over) as their obesity prevalence rate was 30.5% in 1999 and 39.6% in 2016 [7]. For youths (2–19 years), the corresponding obesity prevalence numbers were 13.9% and 18.5% respectively (33.1% increase) [7]. During the same 1999–2016 time period, there was a substantial 141.90% age adjusted mortality rate increase, when obesity or overweight was listed as an influential factor on the CDC WONDER death records [10]. The 1999–2016 results also showed that the mortality rates for the B/AA and the AI/AN populations gravitated at significantly higher elevations when compared to the national averages [10]. In addition, the conditions of obesity (or overweight) impacted the 1999–2016 mortality rates of all decennial age-groups and the 35–44 age group had significantly higher rates (174.93%) [10].
When analyzing the mortality rate patterns by age in detail, first for diabetes (Fig. 4), the national crude mortality rate has declined by 14.20%. In addition, we reveal that the 15–24, 25–34, 35–44, and 45–54 age-groups, when compared to the national averages, had very reduced crude death rates, but the burden of diabetes in these groups is alarmingly high, as their mortality rate averages have increased by 42.22%, 25.65%, 20.24%, and 16.8% respectively. Contrarily, the Fig. 5 data demonstrates that the 55–64, 65–74, 75–84, and 85+ age-groups had higher 1999–2017 crude mortality rates (than national averages) but, are all falling. Nevertheless, the 55–64 age group has the smallest decline (−7.24%).
Figure 5.
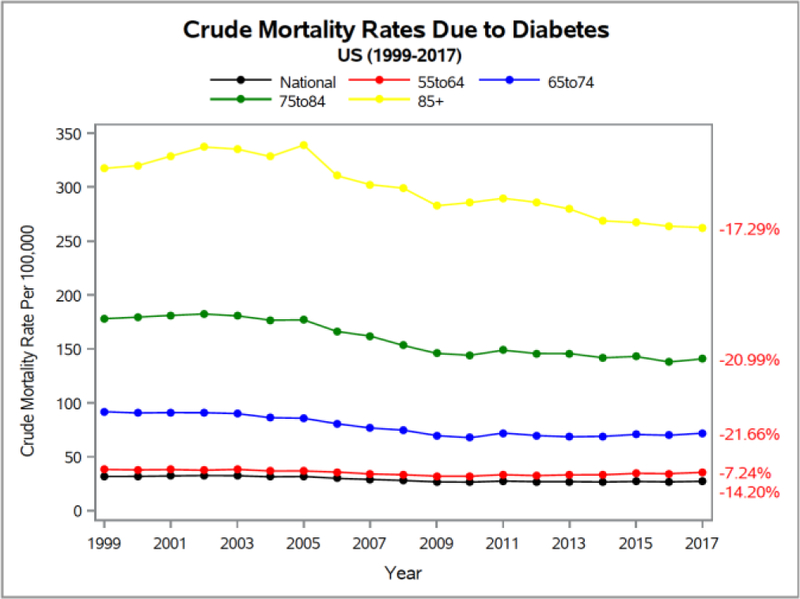
1999–2017 US crude mortality rates due to diabetes for the age-groups, 55–64, 65–74, 75–84, and 85+.
For malignant neoplasms (Figs. 6, 7), the 1999–2017 crude mortality rates are decreasing with time and the national averages fell by 23.84%. The 45–54 (middle-age) and lower age-groups were considerably below the national averages, and the 55–64 and higher age-groups had higher rates.
Figure 6.
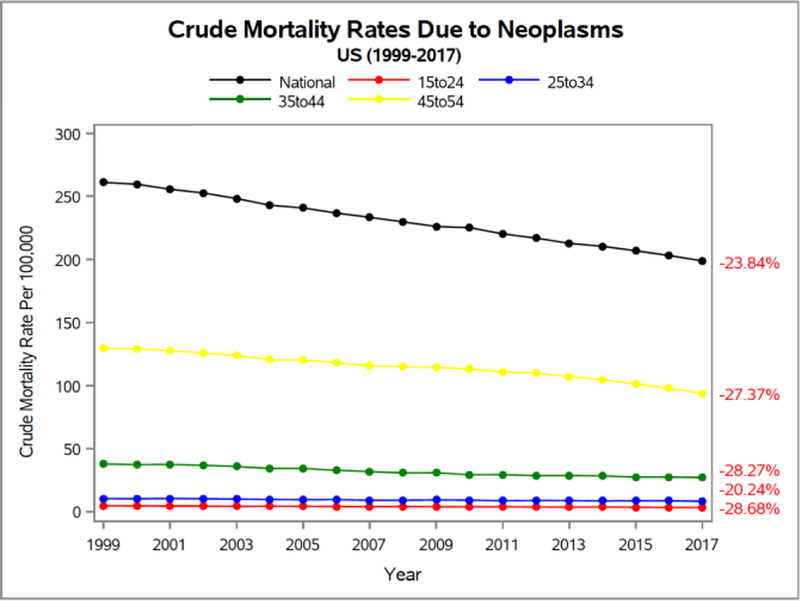
1999–2017 US crude mortality rates due to neoplasms for the age-groups, 15–24, 25–34, 35–44, and 45–54.
Figure 7.
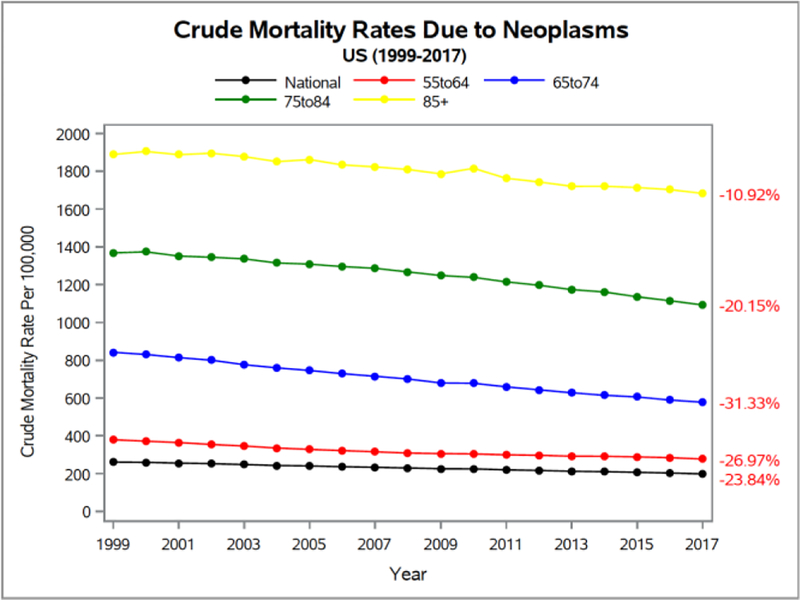
1999–2017 US crude mortality rates due to neoplasms for the age-groups, 55–64, 65–74, 75–84, and 85+.
As shown in Figs. 8 and 9, for the diseases of the circulatory system, there are declining 1997–2017 crude mortality rates when compared to the national averages in all but the 25–34 decennial age-groups. The national averages declined by 37.47% but the crude mortality rate in the 25–34 age-group increased by 6.78%.
Figure 8.
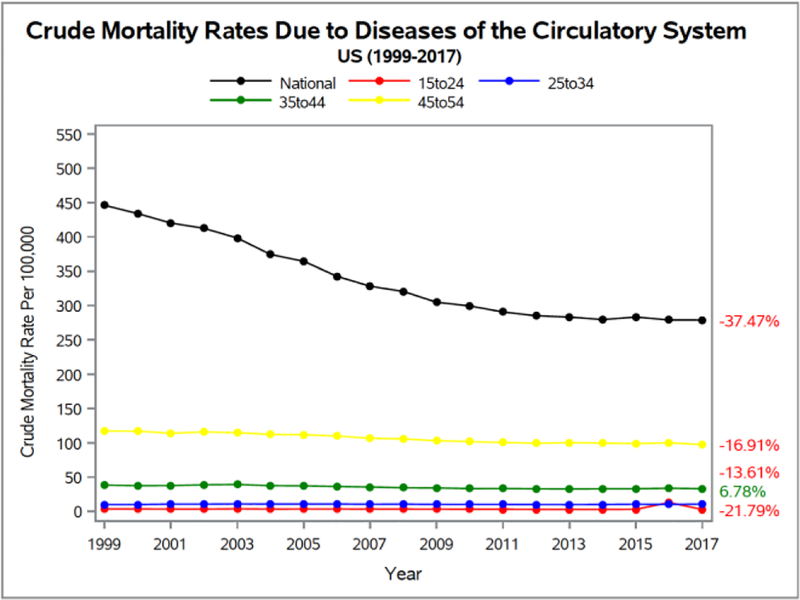
1999–2017 US crude mortality rates due to diseases of the circulatory system for the age-groups, 15–24, 25–34, 35–44, and 45–54.
Figure 9.
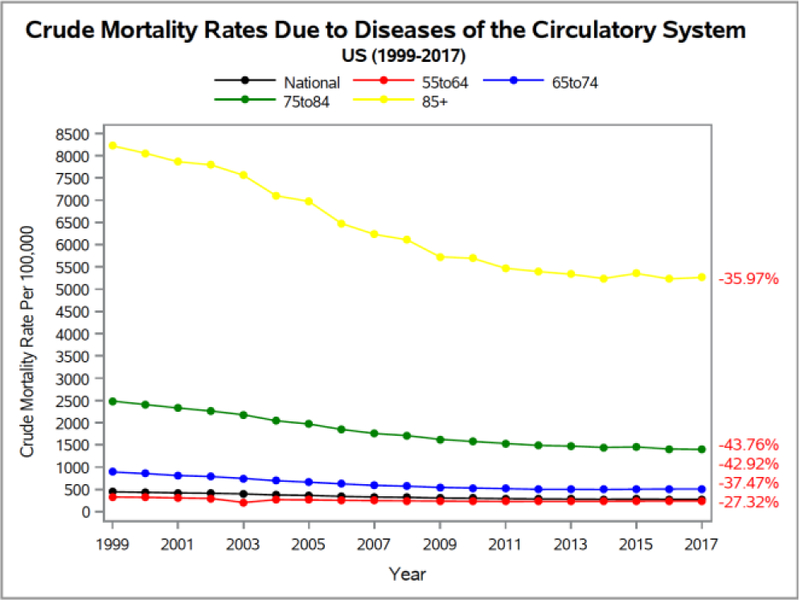
1999–2017 US crude mortality rates due to diseases of the circulatory system for the age-groups, 55–64, 65–74, 75–84, and 85+.
In summary, the observed progression in Figs. 1–9 and Tables I and II for the race-based age adjusted mortality rates and the decennial age-group crude death rates can be undoubtedly rationalized by the earlier 1999–2016 reported race and age-group based mortality rate increases where obesity or overweight was listed as a primary factor in death [10]. In that study, the B/AA and the AI/AN populations together with the 35–44 age-groups, when compared to the national obesity related mortality rate averages, had excessively higher death rate increases. Alternatively, the obesity related death rates of the W race followed closely with the national averages while the A/PI race had death rates that were distinctly under the national trendline [10].
Additional justification for the presented results (in Figs. 1–9, and Tables I and II) is provided by obesity being a very complex condition [6], [23], [25], [40] that is impacting both, the quality of life and human lifespan [11], [15], [16], [19], [21], [22], and where diabetes, malignant neoplasms, and the diseases of the circulatory system are shown to be aligned with the people who are overweight or obese [5], [9]–[20]. Furthermore, the 2015–2016 National Health and Nutrition Examination Survey [8] demonstrated that the US prevalence of obesity has increased among people of all race groups. 37.9% of W and nearly half of the B/AA (46.8%) and AI/AN (43.7%) adults were obese, whereas adults from the A/PI race had comparatively reduced rates (12.7%). The survey also showed that, in general, 35.7% of adults ages 20 to 39 had obesity, and 7.8% had severe obesity. Older American adults had even worse results with 42.8% of the 40–59 age-group being obese (8.5% with severe obesity) and 41.0% of the adults over 60 were obese (6.3% had severe obesity). Hence, there is a clear logical progression between the previous obesity related observations and our current project findings.
IV. Conclusions
The 1997–2017 race-based age adjusted mortality rates and decennial age-group based crude death rates for diabetes, neoplasms, and circulatory system diseases, are downward trending but comprehensively track US obesity prevalence [6]–[8] and obesity-related mortality results [10], [13], [20].
For diabetes, when compared to the 1997–2017 national mortality rate averages, we show that the B/AA and AI/AN races are disproportionally affected whereas the W and A/PI races have lower death rates. Additionally, the crude mortality rates due to diabetes for the youngest decennial age-groups, 15–24, 25–34, 35–44, and 45–54 rose significantly to, 42.2%, 25.65%, 20.24%, and 16.8% respectively.
The percentages of death from neoplasms in the B/AA population is undeniably higher than the 1997–2017 national averages. During the same time period, the W race’s average coincides with the national mortality rate averages, while those of the AI/AN and A/PI races fall far below. The middle-age (45–54) and below age-groups progress underneath and far-removed from the national trend line, while the 55–64 and higher age-groups are above.
For the diseases of the circulatory system, the advancements in the 1997–2017 age adjusted mortality rates for the B/AA populations is far higher than the national averages but they are much lower for the AI/AN and A/PI races. The W race has death rates that very similar to the national averages. In addition, for this condition, the 65–74 and older Americans have much higher 1997–2017 crude mortality rates than the national averages, while the 55–64 and younger Americans have lower values.
Despite the steady decline in race- and age-based mortality rates for the three diseases, the factual findings provide nonjudgmental evidence for Americans to rethink obesity to improve their lifestyle interventions for weight-management.
Acknowledgments
Wesley College acknowledges support from an IDeA award from NIH-NIGMS (P20GM103446, DE-INBRE program), an NSF-EPSCoR award (Grant No. IIA-1301765, OIA-1757353), an NSF (DUE) S-STEM grant 1355554 (Wesley College Cannon Scholar program), the NASA Delaware Space Grant Consortium (NNX15AI19H), and the State of Delaware. The opinions and views expressed in this article are those of the authors and do not necessarily reflect the opinions and views of any of the federal and state funding agencies.
NIH-NIGMS IDeA award (P20GM103446); NSF-EPSCoR award (Grant No. IIA-1301765, OIA-1757353); NSF (DUE) S-STEM grant 1355554 (Cannon Scholar program); NASA Delaware Space Grant Consortium grant program (NNX15AI19H); State of Delaware.
Contributor Information
Malcolm J. D’Souza, Professor of Chemistry & Dean of Interdisciplinary/ Collaborative Sponsored Research at Wesley College, Dover, Delaware, 19901, USA. He is the principal lead on the listed grants and the Wesley College STEM Undergraduate Research Center for Analytics, Talent, and Success
Riza C. Li, Wesley College 2016 summa cum laude graduate in mathematics. Currently, she is a PhD candidate in the Center for Bioinformatics and Computational Biology, University of Delaware, Newark, Delaware, 19711, USA
Morgan L. Gannon, 2017 Wesley College biology graduate. Currently, she is a Physician Assistant Student Extern at the Advanced Plastic Surgery Center, Delaware, 19711, USA
Derald E. Wentzien, Professor of Mathematics & Data Science at Wesley College, Dover, Delaware, 19901, USA. He is the faculty lead on the Wesley College Informatics certificate and minor programs sponsored through the STEM UR-CATS
References
- [1].Eyre H et al. , “Preventing cancer, cardiovascular disease, and diabetes: a common agenda for the American Cancer Society, the American Diabetes Association, and the American Heart Association.,” Circulation, 2004. [DOI] [PubMed] [Google Scholar]
- [2].National Center for Health Statistics, “Health, United States, 2016: With chartbook on long-term trends in health,” 2017. [PubMed] [Google Scholar]
- [3].Xu J, Murphy SL, Kochanek KD, Bastian B, and Arias E, “Deaths: Final Data for 2016.,” Natl. Vital Stat. Rep, 2018. [PubMed] [Google Scholar]
- [4].Weir HK et al. , “Heart Disease and Cancer Deaths — Trends and Projections in the United States, 1969–2020,” Prev. Chronic Dis, 2016. [DOI] [PMC free article] [PubMed] [Google Scholar]
- [5].Case A and Deaton A, “Mortality and morbidity in the 21st century.,” Brookings Pap. Econ. Act, 2017. [DOI] [PMC free article] [PubMed] [Google Scholar]
- [6].Hales CM, Fryar CD, Carroll MD, Freedman DS, and Ogden CL, “Trendsinobesity and severe obesity prevalence in usyouth and adultsby sex and age, 2007–2008 to 2015–2016,” JAMA - Journal of the American Medical Association. 2018. [DOI] [PMC free article] [PubMed] [Google Scholar]
- [7].Hales CM, Carroll MD, Fryar CD, and Ogden CL, “Prevalence of Obesity Among Adults and Youth: United States, 2015–2016,” NCHS data brief, no 288 Hyattsville, MD: Natl. Cent. Heal. Stat., 2017. [PubMed] [Google Scholar]
- [8].National Center for Health Statistics, “NHANES - National Health and Nutrition Examination Survey Homepage,” Centers for Disease for Health Statistics. 2016. [Google Scholar]
- [9].Grover SA et al. , “Years of life lost and healthy life-years lost from diabetes and cardiovascular disease in overweight and obese people: A modelling study,” Lancet Diabetes Endocrinol., 2015. [DOI] [PubMed] [Google Scholar]
- [10].D’Souza MJ, Bautista RC, and Wentzien DE, “Data Talks: Obesity-Related Influences on US Mortality Rates,” Res. Heal. Sci, vol. 3, no. 3, p. 65, June 2018. [DOI] [PMC free article] [PubMed] [Google Scholar]
- [11].Voss JD, Pavela G, and Stanford FC, “Obesity as a threat to national security: the need for precision engagement,” Int. J. Obes, 2018. [DOI] [PMC free article] [PubMed] [Google Scholar]
- [12].D’Souza MJ et al. , “Integrative Biological Chemistry Program Includes The Use Of Informatics Tools, GIS And SAS Software Applications.,” Contemp. issues Educ. Res. (Littleton, Colo.), vol. 8, no. 3, pp. 193–214, 2015. [DOI] [PMC free article] [PubMed] [Google Scholar]
- [13].D’Souza MJ et al. , “Data-intensive Undergraduate Research Project Informs to Advance Healthcare Analytics,” in 2018 IEEE Signal Processing in Medicine and Biology Symposium (SPMB), 2018, pp. 1–8. [DOI] [PMC free article] [PubMed] [Google Scholar]
- [14].Masters RK, Reither EN, Powers DA, Yang YC, Burger AE, and Link BG, “The impact of obesity on US mortality levels: The importance of age and cohort factors in population estimates,” Am. J. Public Health, 2013. [DOI] [PMC free article] [PubMed] [Google Scholar]
- [15].Pi-Sunyer X, “The medical risks of obesity,” Postgrad. Med, 2009. [DOI] [PMC free article] [PubMed] [Google Scholar]
- [16].Kopelman P, “Health risks associated with overweight and obesity,” Obes. Rev, 2007. [DOI] [PubMed] [Google Scholar]
- [17].Centers for Disease Control and Prevention, “Adult Obesity Causes & Consequences,” Overweight & Obesity, 2018. . [Google Scholar]
- [18].Ellies LG, Johnson A, and Olefsky JM, “Obesity, inflammation, and insulin resistance,” in Obesity, Inflammation and Cancer, 2013. [Google Scholar]
- [19].Guh DP, Zhang W, Bansback N, Amarsi Z, Birmingham CL, and Anis AH, “The incidence of co-morbidities related to obesity and overweight: A systematic review and meta-analysis,” BMC Public Health, 2009. [DOI] [PMC free article] [PubMed] [Google Scholar]
- [20].D’Souza MJ, Wentzien DE, Bautista RC, and Gross CC, “Investigation Of Obesity-Related Mortality Rates In Delaware.,” Am. J. Heal. Sci, vol. 8, no. 1, pp. 19–32, June 2017. [PMC free article] [PubMed] [Google Scholar]
- [21].O’Neill S and O’Driscoll L, “Metabolic syndrome: A closer look at the growing epidemic and its associated pathologies,” Obes. Rev, 2015. [DOI] [PubMed] [Google Scholar]
- [22].Malnick SDH and Knobler H, “The medical complications of obesity,” QJM. 2006. [DOI] [PubMed] [Google Scholar]
- [23].Martí ML, “The metabolic syndrome,” Prensa Med. Argent, 2016. [Google Scholar]
- [24].Park SJ, Jung J, Choi SW, Lee HJ, Blesso CN, and U. TCof Ghada NY Soliman A (Department of Environmental, Occupational, and Geospatial Health Sciences, CUNY Graduate School of Public Health and Health Policy, “Underlying Cause of Death 1999–2016 on CDC WONDER Online Database,” Nutrients, 2018. [Google Scholar]
- [25].Center for Disease Control and Prevention, “Chronic Disease Overview | Publications | Chronic Disease Prevention and Health Promotion | CDC,” Atlanta, 2016. . [Google Scholar]
- [26].Gonzalez T and Chiodo C, “ICD 10,” Foot Ankle Int., 2015. [DOI] [PubMed] [Google Scholar]
- [27].WHO, “International Classification of Diseases (ICD-10),” Fam. Pract. Manag, 2010. [Google Scholar]
- [28].Mokdad AH, Marks JS, Stroup DF, and Gerberding JL, “Actual Causes of Death in the United States, 2000,” Journal of the American Medical Association. 2004. [DOI] [PubMed] [Google Scholar]
- [29].Centers for Disease Control and Prevention and National Center for Health Statistics, “Underlying Cause of Death 1999–2016 on CDC WONDER Online Database, released December, 2017,” Data are from the Multiple Cause of Death Files, 1999–2016, as compiled from data provided by the 57 vital statistics jurisdictions through the Vital Statistics Cooperative Program., 2017. . [Google Scholar]
- [30].Pritt BS, Hardin NJ, Richmond JA, and Shapiro SL, “Death certification errors at an academic institution,” Archives of Pathology and Laboratory Medicine. 2005. [DOI] [PubMed] [Google Scholar]
- [31].Institute of Medicine, “IOM Report: The Future of Emergency Care in the United States Health System,” Acad. Emerg. Med, 2006. [DOI] [PubMed] [Google Scholar]
- [32].Rao RB, Krishnan S, and Niculescu RS, “Data mining for improved cardiac care,” ACM SIGKDD Explor. Newsl, 2007. [Google Scholar]
- [33].Bowman S, “Coordinating SNOMED-CT and ICD-10: getting the most out of electronic health record systems,” J. AHIMA, 2005. [PubMed] [Google Scholar]
- [34].Flegal KM, Graubard BI, Williamson DF, and Gail MH, “Cause-specific excess deaths associated with underweight, overweight, and obesity,” J. Am. Med. Assoc, 2007. [DOI] [PubMed] [Google Scholar]
- [35].Flegal KM, “Excess deaths associated with obesity: cause and effect,” Int. J. Obes, 2006. [DOI] [PubMed] [Google Scholar]
- [36].O’Malley KJ, Cook KF, Price MD, Wildes KR, Hurdle JF, and Ashton CM, “Measuring diagnoses: ICD code accuracy,” Health Services Research. 2005. [DOI] [PMC free article] [PubMed] [Google Scholar]
- [37].D’Souza MJ, Walls K-JE, Rojas C, Everett LM, and Wentzien DE, “Effect Of Gender And Lifestyle Behaviors On BMI Trends In A Sample Of The First State’s Undergraduate Population.,” Am. J. Heal. Sci, vol. 6, no. 1, pp. 59–74, June 2015. [DOI] [PMC free article] [PubMed] [Google Scholar]
- [38].Bentham J et al. , “Worldwide trends in body-mass index, underweight, overweight, and obesity from 1975 to 2016: a pooled analysis of 2416 population-based measurement studies in 128 9 million children, adolescents, and adults,” Lancet, 2017. [DOI] [PMC free article] [PubMed] [Google Scholar]
- [39].Singh GK, Kochanek KD, and MacDorman MF, “Advance Report of Final Mortality Statistics, 1994,” Mon. Vital Stat. Rep, 1996. [Google Scholar]
- [40].Johnson NNB et al. , “CDC National Health Report: Leading Causes of Morbidity and Mortality and Associated Behavioral Risk and Protective Factors— United States, 2005–2013,” MMWR Suppl., 2014. [PubMed] [Google Scholar]
- [41].Jia H and Lubetkin EI, “The impact of obesity on health-related quality-of-life in the general adult US population,” J. Public Health (Bangkok), 2005. [DOI] [PubMed] [Google Scholar]
- [42].Tomlinson DJ, Erskine RM, Morse CI, Winwood K, and Onambélé-Pearson G, “The impact of obesity on skeletal muscle strength and structure through adolescence to old age,” Biogerontology. 2016. [DOI] [PMC free article] [PubMed] [Google Scholar]
- [43].Leonard MB et al. , “Tibia and radius bone geometry and volumetric density in obese compared to non-obese adolescents,” Bone, 2015. [DOI] [PMC free article] [PubMed] [Google Scholar]
- [44].Tomlinson DJ, Erskine RM, Winwood K, Morse CI, and Onambélé GL, “The impact of obesity on skeletal muscle architecture in untrained young vs. old women,” J. Anat, 2014. [DOI] [PMC free article] [PubMed] [Google Scholar]
- [45].Rzechonek A et al. , “Influence of obesity on the course of malignant neoplastic disease in patients after pulmonary metastasectomy,” In Vivo (Brooklyn)., 2018. [DOI] [PMC free article] [PubMed] [Google Scholar]
- [46].Rudisill C, Charlton J, Booth HP, and Gulliford MC, “Are healthcare costs from obesity associated with body mass index, comorbidity or depression? Cohort study using electronic health records,” Clin. Obes, 2016. [DOI] [PMC free article] [PubMed] [Google Scholar]
- [47].Siegel RL, Miller KD, and Jemal A, “Cancer statistics, 2019.,” CA. Cancer J. Clin, 2019. [DOI] [PubMed] [Google Scholar]


