

Summary
Resistance to antimicrobial and chemotherapeutic agents is a significant clinical problem. Overexpression multidrug efflux pumps often creates broad-spectrum resistance in cancers and pathogens. We describe a mutation, A666G, in the yeast ABC transporter Pdr5 that shows greater resistance to most of the tested compounds than does an isogenic wild-type strain. This mutant exhibited enhanced resistance without increasing either the amount of protein in the plasma membrane or the ATPase activity. In fluorescence-quenching transport assays with rhodamine 6G in purified plasma membrane vesicles, the initial rates of rhodamine 6G fluorescence quenching of both the wild-type and mutant showed a strong dependence on ATP concentration, but were about twice as high in the latter. Plots of initial rate of fluorescence quenching versus ATP concentration exhibited strong cooperativity that was further enhanced in the A666G mutant. Resistance to imazalil sulfate was about 3–4x as great in the A666G mutant strain as in the wild type. When this transport substrate was used to inhibit rhodamine 6G transport, the A666G mutant inhibition curves also showed greater cooperativity than the wild-type strain. Our results suggest a novel and important mechanism: under selection, Pdr5 mutants can increase drug resistance by improving cooperative interactions between drug-transport sites.
Keywords: ABC transporter, multiple drug resistance, Pdr5, yeast, plasma membrane
Graphic Abstract
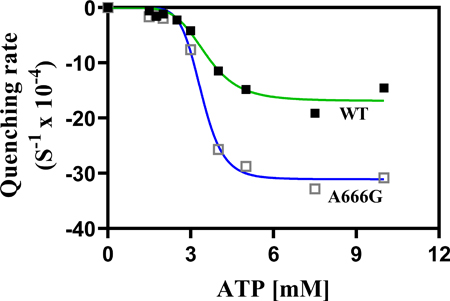
The A666G mutation in Pdr5, the major multi-drug transporter in Saccharomyces cerevisiae (yeast), dramatically increases multidrug resistance. The graphic shows plots of the initial rate of rhodamine 6G transport measured as fluorescence quenching versus ATP concentration in purified plasma membrane vesicles. The greater sigmoidicity of the A666G mutant curve (blue line) indicates increased cooperativity between drug-binding sites resulting in increased resistance.
Introduction
Broad-spectrum resistance to antibiotics in pathogens and chemotherapeutic agents in tumor cells remains a major clinical problem. Multiple mechanisms are responsible for this, with genetic alterations in ATP-binding cassette (ABC) multidrug transporters playing a major role. Often, multidrug resistance results from overexpression of these proteins in fungal pathogens and cancers (Kolotoylannis and Lewis, 2002; Goodman, Fojo, and Bates, 2002; Lage, 2003; Prasad et al., 2014; Kathawala et al., 2015). It seemed plausible that additional mechanisms for increased multidrug resistance existed and were worth identifying.
Multidrug transporters of the ABC superfamily are polytopic proteins. They bind and hydrolyze nucleotides in the nucleotide-binding domains (NBDs). The energy from binding and hydrolysis is used to effect conformational changes in the transmembrane domains (TMDs), where drugs bind to many sites in a large drug-binding pocket. These changes allow the transporter to cycle from an inward-facing, drug-binding conformation to an outward-facing, drug-releasing structure (Seeger, Bordignon, and Hohl, 2013). Activities at these separate domains are coordinated through a transmission interface that has been well characterized in the yeast Pdr5 multidrug transporter, the founding member of the large Pdr fungal subfamily of ABC proteins (Gblenska, Krijger, and Breunig, 2006). Typically, loss-of-function mutations in the transmission interface exhibit reduced ATPase and GTPase activities, increased drug hypersensitivity to xenobiotic agents, and increased resistance to noncompetitive inhibition of ATPase activity (Sauna et al., 2008; Downes et al., 2013, reviewed in Golin and Ambudkar, 2015).
The Pdr subfamily of fungal transporters is closely related to the ABCG family found in plants and animals (Lamping et al., 2010). Both subfamilies have a reverse orientation of NBDs and TMDs, high basal ATPase activities, a cis-orientation of the signaling interface, and short intracellular loops.
As is the case with other multidrug transporters, overexpression of Pdr5 leads to hyperresistance (Meyers et al., 1992). Furthermore, these high levels of Pdr5 are stably maintained even under conditions of nutrient stress (Rahman et al., 2018). Recently, however, Downes et al. (2013) demonstrated that multidrug-resistant yeast cells that were already overexpressing the Pdr5 transporter achieved even greater levels of drug resistance because of gain-of-function mutations in the transmission interface. In particular, they showed that a V656L substitution in intracellular loop-2 (ICL-2) of Pdr5 was responsible for approximately doubling resistance. Remarkably, there was no further increase in either the amount of Pdr5 in the plasma membrane (PM) or the level of ATPase activity. Molecular modeling of this region suggests that ICL-2 is too short to make direct contact with an ATP-binding site. Nevertheless, it appears to play a significant role in intradomain crosstalk. A V656A mutant exhibited significant levels of ATPase activity, but had almost no transport. Furthermore, the hypersensitive E244G Q-loop mutation was suppressed by the V656L mutation. The Q-loop is known to play a critical role in the intradomain crosstalk of ABC transporters, including Pdr5 (Urbatsch et al., 2000; Dalmas et al, 2005; Ananthaswamy et al. 2010). Kolaczkowski et al. (2013) characterized a series of hyperresistant mutants in the CaCdr1 transporter of the pathogenic fungus C. albicans in an important study. This ABC efflux pump has 56% amino acid identity to Pdr5. The mutations lie in the signal transmission interface, and these investigators analyzed both single-mutant and multiple-mutant combinations with respect to drug resistance and ATPase activity in the presence of transport substrates. Several these mutants were similar phenotypically to ours, but the mechanism responsible for the increased resistance in these mutants was not elucidated.
In this report, we probe the mechanism responsible for Pdr5-mediated hyperresistance with a more robust mutant: an A666G alteration located near Val-656 that appeared in two screens for mutants that increased cycloheximide resistance (Downes et al.2013).
ABC transporters are known to have multiple drug-binding sites (Bruggemann et al., 1989; Golin et al., 2003; Shukla et al., 2003) with simultaneous binding of more than one molecule (Loo, Bartlett, and Clarke, 2005; Lugo and Sharom, 2005). An early study demonstrated that mammalian multidrug transporter P-glycoprotein (P-gp) binds azidopine in two places (Martin et al., 2000). It is now clear that both regions are part of the large, drug-binding pocket. Our results suggest that transport efficiency and therefore resistance are enhanced by the A666G mutation, which establishes significant cooperativity between transport sites.
Results
Isolation of the A666G mutation
The A666G mutation appeared in two separate genetic screens. In the first screen, it was isolated as a suppressor of a Q-loop region mutant N242K, which resulted in increased hypersensitivity to Pdr5 transport substrates (Sauna et al., 2008). In the second screen, yeast cells already overexpressing Pdr5 were plated on a lethal concentration of cycloheximide (Downes et al., 2013). The A666G substitution arose here as well. We recreated this mutation on the integrating plasmid pSS607, which was placed in the ΔPdr5 strain R-1. We confirmed that the resulting strains were hyperresistant to cycloheximide. We performed all of the work in this study with the recreated mutation. We made two additional substitutions: A666V and A666L. The former was phenotypically identical to the A666G mutant. Western bloting demonstrated that the latter failed to localize to the PM (data not shown).
The evolutionary relationships between fungal ABC transporters was the subject of a detailed study (Gebelska, Krijger, and Breunig, 2006). The Pdr subfamily was initially described as one of eight clusters found in fungi. It was further subdivided into four groups of ABC transporters, each resembling Pdr5, Snq2, Pdr12, or Pdr11. A more recent study divided the Pdr subfamily into nine distinct clusters (Lamping et al., 2010). Among transporters of this subfamily, Ala-666 shows 97% conservation (Lamping et al., 2010).
The steady-state level of Pdr5 was not increased in A666G mutant PM vesicles
To determine whether the steady-state level of Pdr5 in PM vesicles could account for the large increase in drug resistance, we performed a Western blot analysis with three sets of purified PM vesicles from the A666G strain with WT and ΔPdr5 preparations as controls. We obtained a Pdr5/Pma1 ratio for each of the samples in each blot where Pdr5 could be detected. We then compared these values from the WT and the A666G mutant preparations. The A666G had 1.03 ±0.26 the amount of Pdr5 as the WT. A t-test indicated no significant difference between the two sets of preparations. The results therefore demonstrate that steady-state levels of Pdr5 in vesicles prepared from the WT and A666G strains do not differ (Fig. 1A). During the course of this study, we switched to a vastly improved method for purifying vesicles. This ensured preparations of much higher enzyme and transport activity. Coomassie blue-stained samples of WT, A666G, and ΔPdr5 preparations are shown in Fig. 1B. The Pdr5 band, which was absent in the ΔPdr5 sample, was estimated to make up roughly 10% of the total PM vesicle protein. We also determined that the ΔPdr5 vesicles consistently had more Pma1 in PM vesicles than either the WT or A666G mutant preparations.
Fig. 1. The steady-state level of Pdr5 in PM vesicles is unaltered in the A666G mutant.
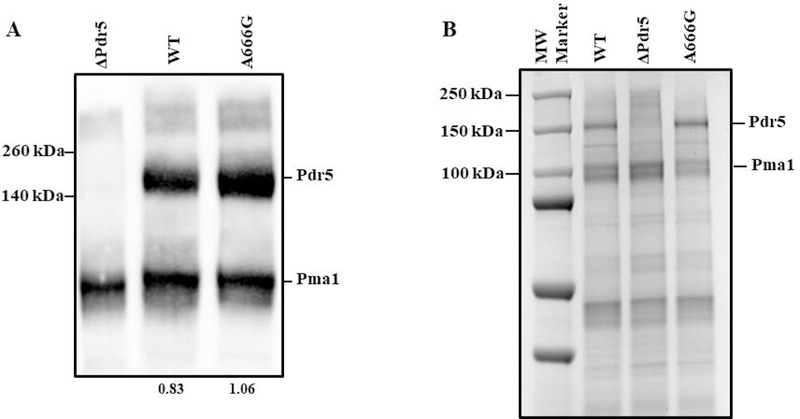
(A) We performed Western blotting as described in the Experimental Procedures with 10 μg of purified PM vesicle protein solubilized for 30 min at 37 °C in SDS-PAGE. All lanes are from the same gel, but a lane with a blot of another strain was cropped and is not shown. The ratio of Pdr5/ Pma1 is shown below the WT and A666G lanes. (B) We performed gel electrophoresis with 10 μg samples of solubilized PM vesicle protein prepared according to Kolaczkowski et al. (1996) as modified by Ernst et al. (2008). Following electrophoresis as described in the Experimental Procedures, the gel was stained in SimplyBlue Safe Stain solution for one hour and destained in reverse osmosis water overnight. A different set of molecular weight markers was used in each panel.
The ATPase activities of the WT and A666G PM vesicle preparations are similar
We routinely measured the ATPase activity of all of our PM vesicle preparations with 3 mM ATP at 35 ˚C. We saw no difference in activity between the PM vesicles (data not shown). We also tested the ATPase activity as a function of ATP concentration at 35 ˚C in four independent sets of PM vesicle preparations from both strains, with the same Hepes transport buffer (pH 7.0) employed in fluorescence-quenching studies described below. We made each pair, consisting of PM vesicles from the WT and mutant, on the same day or on successive days. Under these conditions we noted little difference in the ATPase activities of the WT and mutant preparations (Fig. 2A). Therefore, the increased resistance of the A666G mutant cannot be attributed to increased ATPase activity. Similarly, the Km values were not significantly different (Fig. 2B).
Fig. 2. The WT and mutant PM vesicle preparations have indistinguishable ATPase activities.
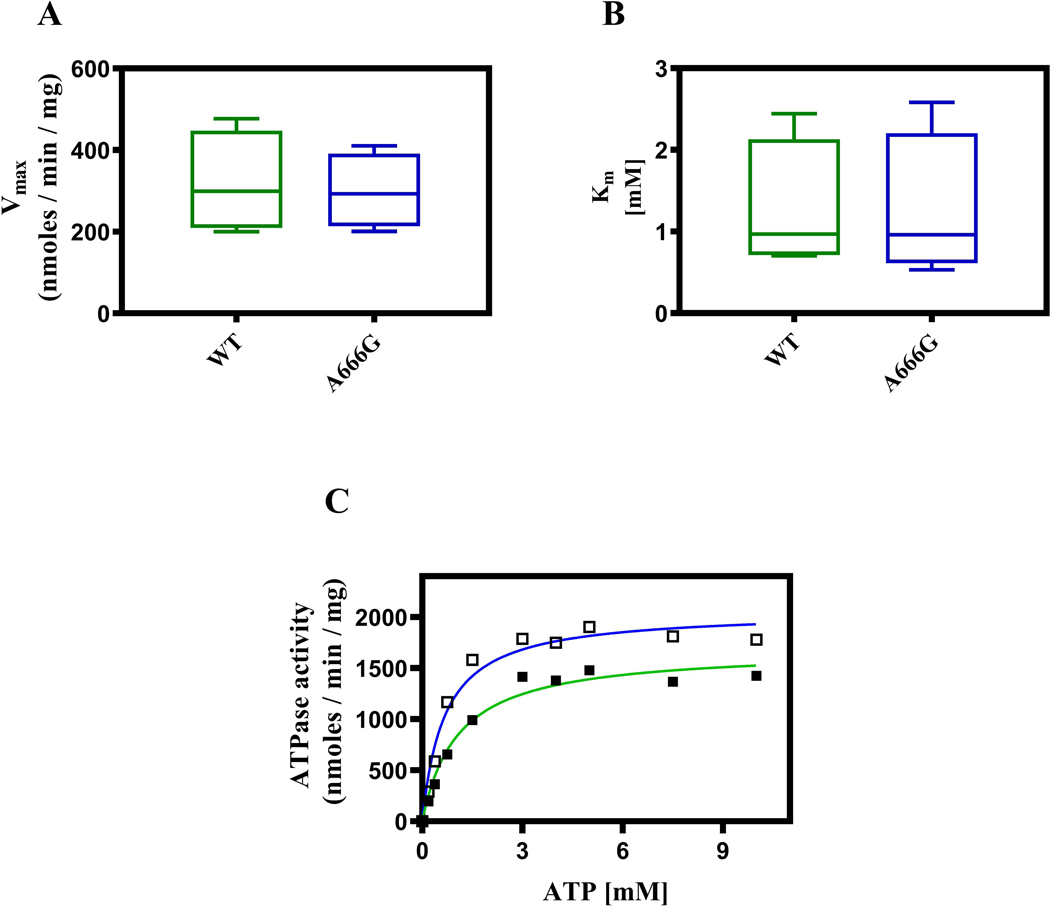
Vmax (A) and Km (B) values from assays of four PM vesicles preparations from WT (green box) and A666G (blue box) mutant strains. The assays were performed in Hepes buffer (pH 7.0) as described in the Experimental Procedures. The horizontal bars indicate the median values. (C) ATPase activity was also assayed in Tris-glycine buffer (pH 9.5). No other parameters of the assay were altered. In this panel: green line (■) = WT; blue line = (□) A666G mutant.
These vesicles have a large amount of Pma1, which retains significant activity at a pH of 7.0. This results in significant background, especially at ATP concentrations that are 3 mM or greater. We therefore probably underestimated the Pdr5-specific ATPase, although we saw no difference between the strains. Pdr5 ATPase activity has a broad pH range (Ernst et al., 2008). When Tris-glycine (pH 9.5) served as the assay buffer to measure the activities in two sets of PM vesicles (Fig. 2C), the background observed in the negative control was considerably reduced. In this particular experiment, the Vmax of the WT ATPase activity was ~1.5 μmoles/min/mg and the Km was ~1.1 mM. The corresponding values for the A666G mutant were 1.9 μmoles/min/mg and 0.7 mM.
The A666G mutant increased resistance to many Pdr5 transport substrates
We compared the resistance of the WT and A666G strains to the six Pdr5 transport substrates shown in Fig. 3. Five additional plots are found in the Supporting Information (Fig. S1). The entire collection encompassed compounds that are distinct in structure and mechanism of action (tamoxifen, two trialkyltin chlorides, cycloheximide, and cerulenin) and a set of structurally similar compounds (bifonazole, clotrimazole, imazalil sulfate, and cyproconazole) that inhibit ergosterol (and therefore membrane) biosynthesis. Thus, we tested 11 Pdr5 transport substrates. These varied considerably in hydrophobicity and size. Cycloheximide was the most polar (logP = 0.56); tripentyltin chloride was the most hydrophobic (log p = 5.84) and largest. Cerulenin was the smallest of the Pdr5 substrates tested.
Fig. 3. The A666G mutant exhibits strong hyperresistance to multiple Pdr5 substrates.
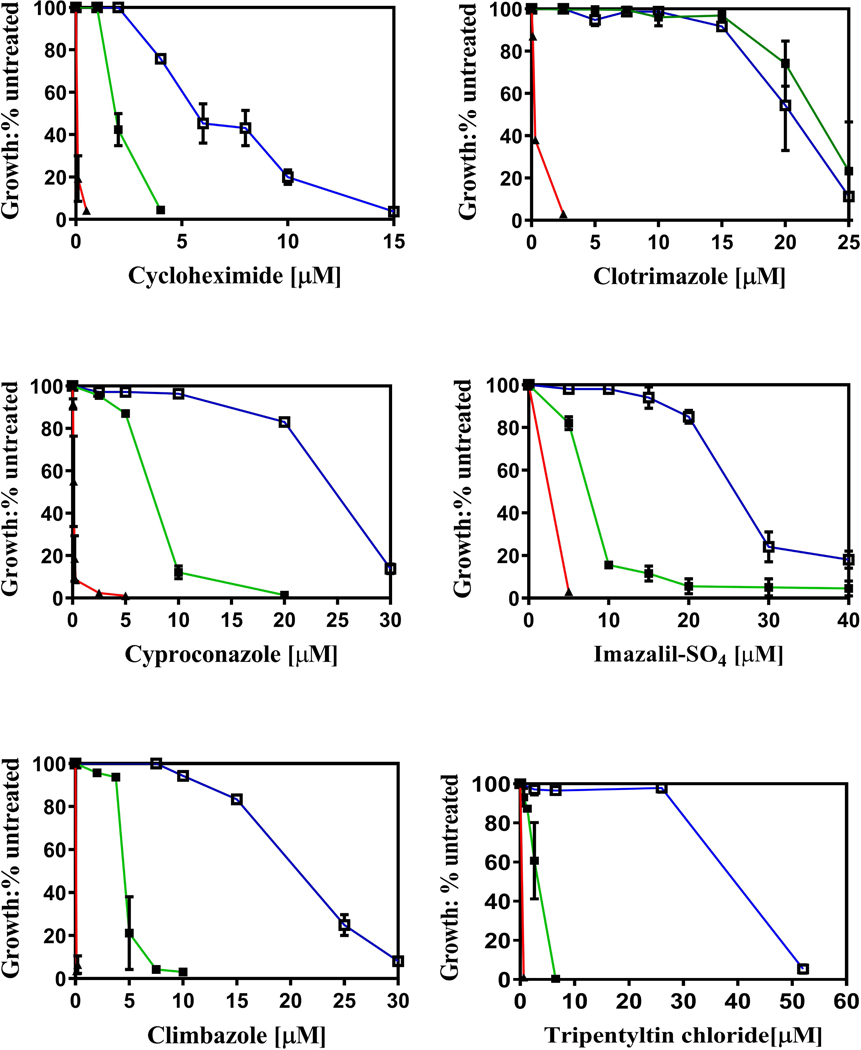
Cells were cultured in YPD broth at 30 °C for 48 h in the presence of drugs as described in the Experimental Procedures. YPD cultures of each strain that contained no drug served as an untreated control for growth comparisons. Cell concentration was determined at 600 nm. In this figure: ■, green, WT; ▲, red, ΔPdr5; and □, blue, A666G (n = 3).
The A666G mutation created robust resistance to 10 of the 11 tested compounds. Depending on the compound, the resistance to these substrates in the A666G mutant strain was roughly 2–4x higher than in the WT. The mutant did not exhibit enhanced clotrimazole resistance. In two-way ANOVA tests only the plots for clotrimazole showed no significant difference between the WT and A666G strains.
Identification of substrates whose transport is not enhanced by the A666G mutation may have bearing on the mechanism of resistance. The clotrimazole data are complicated by the fact that this transport substrate is a potent inhibitor of Pdr5 ATPase in vitro, which might limit any additional resistance above the WT level in vivo. In the Supporting Information, we identify coumarin 6 as a strong Pdr5 substrate whose transport was not enhanced further by the A666G mutant (Fig. S2) and did not inhibit Pdr5-specific ATPase activity.
The A666G mutant had increased R6G transport in whole cells
We also compared the whole-cell R6G transport capability of the WT, A666G, and G312A mutant strains with 5 μM (Fig. 4A) and 10 μM R6G (Fig. 4B). The G312A null mutant and the isogenic ΔPdr5 strain served as negative controls. In an assay with 5μM R6G, the WT strain accumulated a median value of 94.4 arbitrary fluorescence units (a.u.); the ΔPdr5 strain retained 1920 a.u. Cells treated with 50 mM 2-deoxyglucose to deplete ATP levels retained levels of fluorescence that were comparable to the negative control. Fluorescence was 6x as great in the WT as in the A666G strain (15.7 a.u.). A similar result appeared in a transport assay conducted with 10 μM R6G. In this case, the differential between the A666G and WT strains was about 5x (Fig. 4B).
Fig. 4. The A666G mutant enhances R6G transport in whole cells.
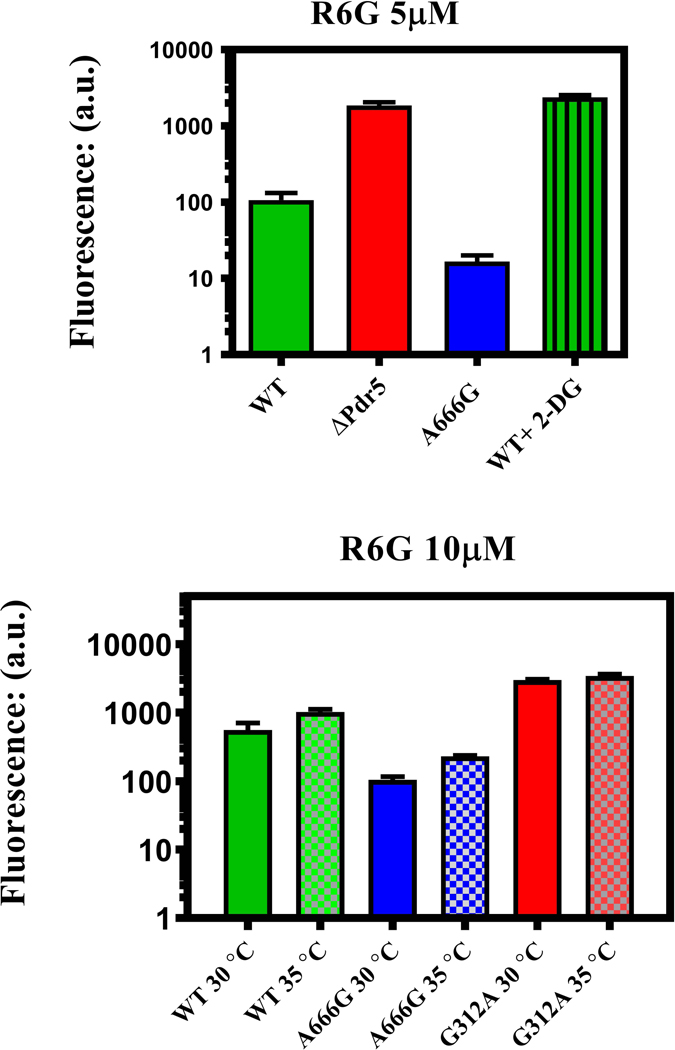
Transport of 5 μM (A) or 10 μM (B) R6G against a concentration gradient was performed as described in the Experimental Procedures at 30 °C for 90 min. The median fluorescence (a.u.) obtained from sorting 10,000 cells/sample is shown (n = 3). We also compared transport at 30 °C and 35 °C in the same strains (B). Each independent culture (n = 3) was split into two portions and transport was monitored at the two temperatures with the whole-cell transport protocol described in the Experimental Procedures.
Whole-cell transport experiments and measurements of drug resistance were carried out at 30 ˚C, and various in vitro assays were performed at 35 ˚C. We therefore performed one set of whole-cell transport experiments at the higher temperature to determine whether the relative difference between the strains was maintained (Fig. 4B). Although transport was reduced overall, the WT still accumulated about 5x as much R6G as the A666G mutant strain. We concluded that the A666G mutant was not temperature sensitive and that the results obtained at the two temperatures were comparable.
Imazalil sulfate inhibits R6G transport in whole cells
In a previous study, imazalil sulfate (IMZ) exhibited concentration-dependent inhibition of R6G whole-cell transport (Mehla et al., 2014). IMZ was also useful because it did not inhibit Pdr5 ATPase activity at the concentrations used in our transport assays (Downes et al., 2013). When 5 μM R6G was the substrate, IMZ caused concentration-dependent inhibition with levels of retained fluorescence reaching that of the ΔPdr5 control (Fig. 5A). The IC50 of IMZ in the WT strain was ~60–70 μM. The A666G mutant, however, behaved differently. It took a larger concentration of IMZ to begin to see inhibition. At higher concentrations, however, the mutant curve rose sharply so that the IC50 (about 100 μM) was similar to that of the WT. When we used a nonlinear transformation to make plots of the log of the IMZ concentration versus the fluorescence (Fig. 5B), the WT curve had a Hill (h) coefficient of 0.9, but the mutant value was 2.4, suggesting cooperativity between transport sites.
Fig. 5. Imazalil sulfate inhibition of R6G transport is concentration dependent.
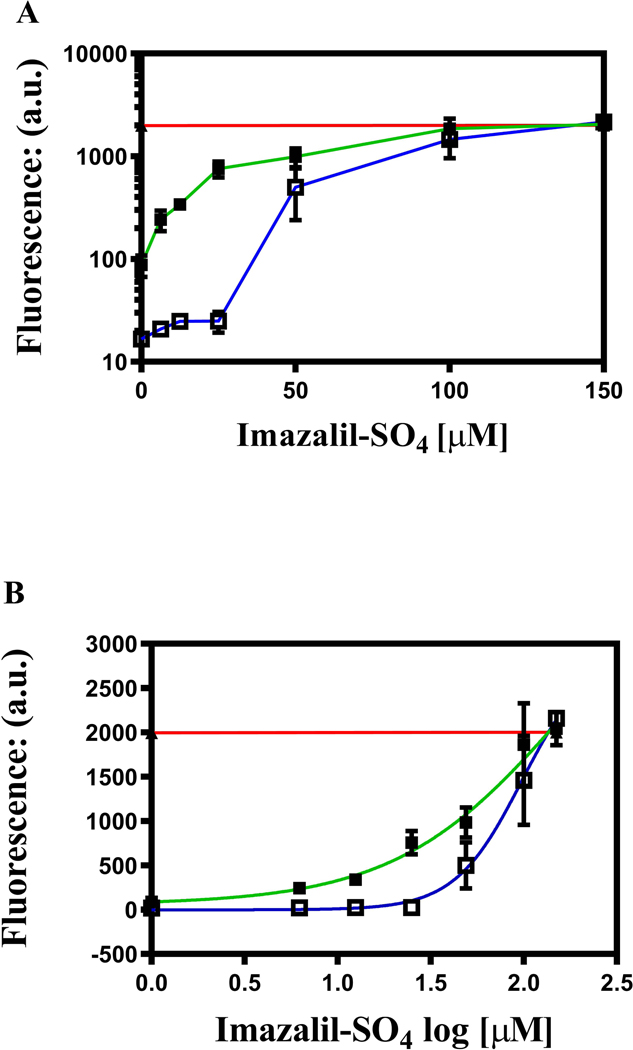
(A) Inhibition of 5 μM R6G transport was performed in the presence of IMZ. The assay was the same as the one used throughout the whole-cell transport studies except that during inhibition assays, IMZ was added at the same time as R6G and remained throughout the entire incubation period. The red line indicates the level of fluorescence in the ΔPdr5 control strain. In these experiments, n = 6 for WT (green line) and n = 4 for the A666G mutant (blue line). (B) A logarithmic plot constructed from the same data.
The concentrations of IMZ used to inhibit R6G transport also inhibited growth in culture. Although the gating profiles of IMZ-treated cells obtained during fluorescence cell sorting were similar to the untreated controls and gave no evidence of increased cellular damage or death during the relatively short incubation period, caution is required in interpreting these results. Studies carried out by Siegel and Ragsdale (1978) demonstrated effects of imazalil on ergosterol precursor pools in as early as 30 minutes. Therefore, it was important to perform the in vitro studies described below.
The A666G mutant enhanced R6G fluorescence quenching in purified PM vesicles
We developed a fluorescence-quenching assay suitable for measuring R6G transport for Pdr5 (Kolaczkowski et al., 1996) and have used it to analyze the transport capability of several mutants (Ernst et al., 2008; Furman et al., 2013). R6G is a known inhibitor of Pdr5 ATPase, however. It was therefore important to establish whether the WT and A666G mutant enzyme activities were inhibited to the same degree. If, for example, the A666G mutant enzyme was more sensitive to inhibition than the WT, the initial rate (IR) of fluorescence quenching would be underestimated in the mutant. In the Supporting Information(Fig.S.3, panel A), we present data indicating that the IC50 of the A666G ATPase was only modestly lower than that of the WT when assayed in Hepes (pH 7.0) buffer with relatively high concentrations of R6G (5–35 μM). At the concentration of R6G used in most of our quenching experiments (100 nM), the WT enzyme retained 90% of the activity found in untreated samples; the A666G mutant retained 80% (Fig. S3, panel B).
We initially assayed a single preparation of PM vesicles from the WT and A666G strains (Fig. 6A). We performed reactions with 3 mM ATP, a concentration thought to be physiological for Saccharomyces (Ozalp et al., 2010). As expected, the kinetics of R6G quenching in the WT and A666G strains were first order (R-squared values = 0.9926 and 0.9965, respectively) when we performed a linear regression on a plot of the natural logarithm (ln) of the fluorescence a.u. versus time (Fig. 6B). PM vesicles from the isogenic ΔPdr5 served as a negative control and showed no quenching. The plot from this preparation yielded a slope that was not significantly different from zero. We obtained a similar result when we omitted ATP from a reaction containing either WT or A666G (data not shown). Because the ATPase activities of the WT and A666G PM vesicles used in this experiment were similar, we concluded that the IR of fluorescence quenching was about twice as fast in the mutant.
Fig. 6. Pdr5-mediated R6G transport is enhanced in PM vesicles prepared from A666G cells.
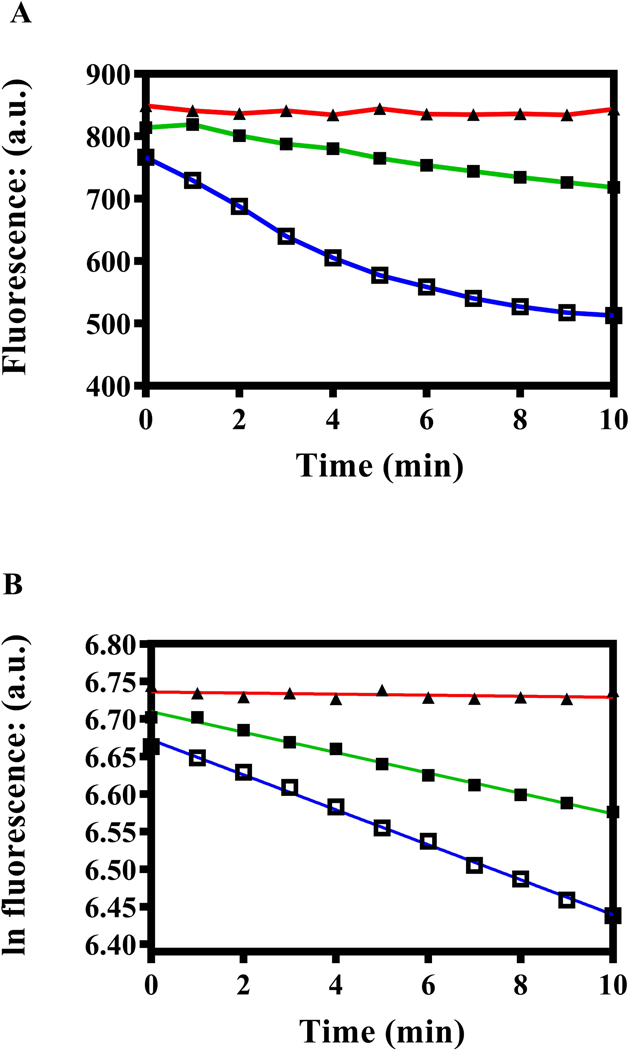
In these experiments: ■, green, WT; ▲, red, ΔPdr5; and □, blue, A666G. Fluorescence quenching was carried out as described in the Experimental Procedures at 35 °C with 30 μg PM vesicle protein suspended in transport buffer containing 100 nM R6G and 3 mM ATP in a final volume of 2 ml, as described by Furman et al. (2013). (A) Quenching was carried out with PM vesicles prepared from WT, ΔPdr5, and the A666G mutant strains as described in the Experimental Procedures. The plot shows the fluorescence in a.u. at 1-min intervals. (B) A linear regression was performed on the same data shown in Fig. 7A by plotting the ln fluorescence (a.u.) against the time with GraphPad software. (C) Fluorescence-quenching experiments used independent PM preparations from the WT and A666G mutant strains. Initial quenching rates were determined by linear regression performed on each plot shown in panel B. We plotted the rates were plotted against ATPase activity determined in Hepes transport buffer with 3mM ATP, with the assay described in the Experimental Procedures.
ATPase activities varied somewhat from one PM vesicle preparation to another; furthermore, we switched to a much-improved method of PM vesicle preparation that yielded significantly higher ATPase activities. We used this method to prepare the PM vesicles used exclusively in the experiments described in Figures 8 and 9. Therefore, it was important to determine whether initial rates of R6G fluorescence quenching and ATPase activity were proportional. Results presented in the Supporting Information(section S2 and Fig. S4) demonstrate that this was the case.
Fig. 8. The A666G mutant enhances cooperativity between transport sites.
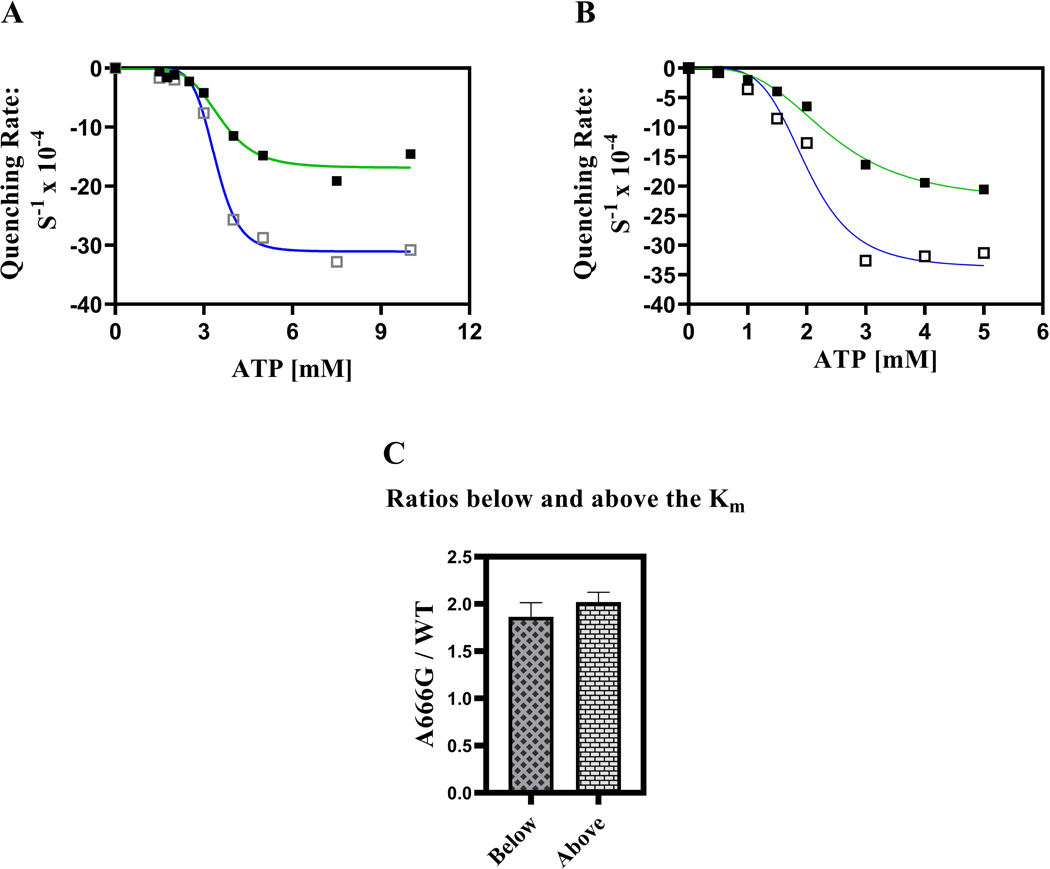
Fluorescence quenching was performed with 100 mM R6G at 35 °C for 20 min as described in the Experimental Procedures except that 60 μg of purified PM vesicles were used in each reaction with the first set of PM vesicles tested (A) and 30 μg were used with a second set of WT and mutant PM vesicles (B). In each panel: ■, green line = WT; □, blue line = the A666G mutant. The ratio of the A666G mutant and WT IRs are compared above and below the Km (C).
Fig. 9. Inhibition of R6G fluorescence quenching by IMZ mirrors the results with whole-cell transport studies.
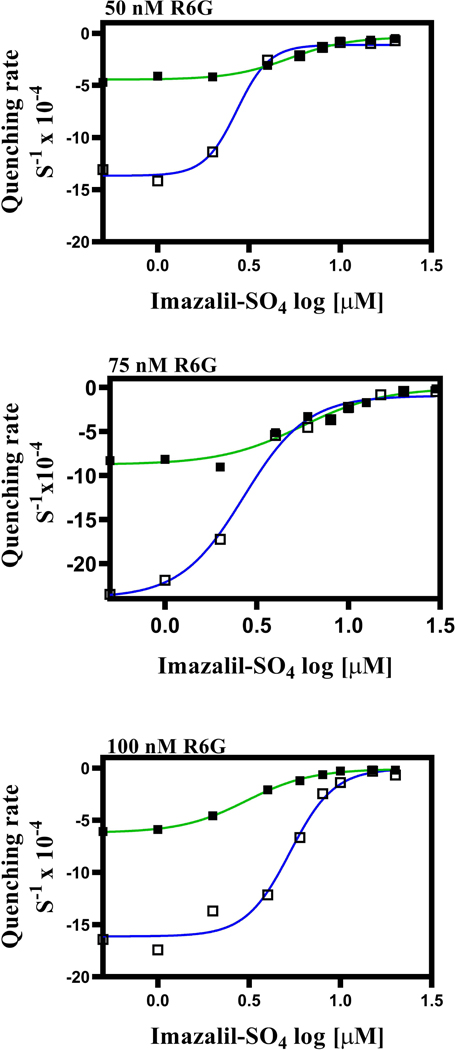
Fluorescence quenching experiments were performed with 25 μg of purified PM vesicle protein for 20 min at 35 °C as described in the Experimental Procedures. A different pair of PM vesicles was used to monitor fluorescence quenching at 75 nM R6G. Inhibition studies were performed with IMZ with (A) 50 nM, (B) 75 nM, and (C) 100 nM R6G with various concentrations of IMZ (0.5–30 μM). The IRs were determined with Graph Pad software through the same linear transformation that was applied to the tamoxifen data. The resulting curves were fitted by a nonlinear transformation (IR versus log [inhibitor], variable slope with four parameters). In all panels: WT = ■, green line; A666G = □, blue line.
No large changes occurred in the IRs of fluorescence quenching over an 8x range of R6G concentrations
We looked at the IRs of fluorescence quenching over an 8x range in R6G concentration in preparations of WT and the A666G mutant (12.5 nM–100 nM). We observed no consistent change in the quenching rates over this range of concentrations (Fig. 7). If anything, the mutant rates decreased very slightly with increased concentrations of R6G.
Fig. 7. IRs of fluorescence quenching measured over a range of R6G concentrations.
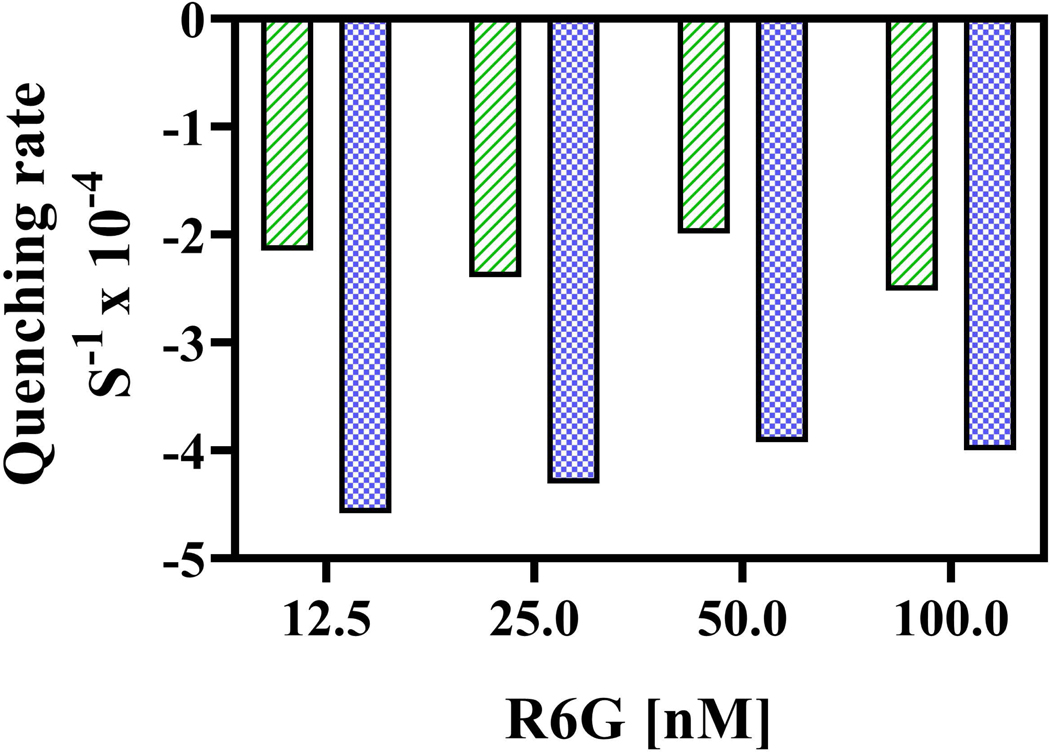
Fluorescence quenching experiments with WT (green bar) and A666G (blue bar) PM vesicles were performed as described in the Experimental Procedures with different concentrations of R6G (12.5nM – 100nM).
The enhanced fluorescence quenching observed in the A666G PM vesicles is attributable to increased cooperativity between transport sites
To evaluate whether the A666G phenotype is attributable to altered kinetics of the drug transport cycle, we initially compared the IRs of fluorescence quenching of the WT and mutant PM vesicles with similar preparation dates and ATPase activities over a range of ATP concentrations (1.5–10 mM).
With the improved method of purifying PM vesicles, we obtained preparations of much higher ATPase activity and fluorescence-quenching capability. We observed that at higher IRs of R6G fluorescence quenching, the curves became nonlinear with increasing time in both WT and A666G vesicles. Simply doing a linear regression on the entire data set (20 minutes) would have resulted in an underestimation of the IRs of fluorescence quenching once we performed a linear transformation (and the R-squared values in some cases would have been poor). Therefore, we determined the IRs of R6G fluorescence quenching for these from the linear portion of the curves, with linear regression. Representative plots of the ln fluorescence versus time are found in the Supporting Information(Fig. S5) from assays with 1.5 mM, 3.0 mM, and 5.0 mM ATP. The linear portions used to determine rates are indicated. The R-squared values for the linear portions were all >0.99.
When we plotted the rates versus ATP concentration (Fig. 8A), several features were readily apparent. The curves for both the mutant and the WT fit a nonlinear transformation that used an allosteric sigmoid equation. The R-squared values for the WT and A666G plots were 0.9776 and 0.9921, respectively, indicating a reasonably strong fit. The Km (ATP)s necessary to reach half the Vmax of fluorescence quenching were similar: 3.5 mM for the WT and 3.4 mM for the A666G mutant (Table 2). There was a remarkable increase in the IRs of fluorescence quenching between 3- and 4-mM ATP in both cases. This largely accounts for the high h coefficients of 5.9 for the WT and 8.6 for the mutant. This cooperativity represents interactions between the drug transport sites rather than the ATP hydrolysis sites. Pdr5-mediated ATPase activity is well studied, follows strict Michaelis-Menten kinetics, and therefore exhibits no cooperativity (Golin et al., 2007; see also Fig. 2C).
Table 2.
IR of fluorescence quenching versus ATP concentration: kinetic parameters†
| Kinetic parameters | WT | A666G |
|---|---|---|
| Vmax Quenching (S−1 × 10⁻⁴) | −19 (3.5) | −33 (1.4) |
| Km Quenching (mM) | 2.9 (0.9) | 2.2 (0.4) |
| Hill values (h) | 4.7 (1.8) | 6.8 (2.6) |
| Vmax ATPase (μmol / min / mg)‡ | 1.4 (0.2) | 1.4 (0.7) |
| Km ATPase (mM) | 2.1 (1.3) | 2.1 (0.9) |
The kinetic parameters are the average values for the experiments shown in Fig. 8A and 8B. The kinetic parameters were determined with GraphPad Prism 8.0 software. The standard deviations are included in parentheses. Each point on a curve is the average IR of R6G fluorescence quenching for two quenching reactions. One of these (2 mM ATP, A666G) was recognized as an outlier by Graphpad software and removed.
The ATPase activity was measured in Tris-glycine buffer (pH 9.5).
The higher h coefficient observed in the plot from the A666G mutant was potentially of importance because it suggested a mechanism by which resistance could be enhanced. For this reason, we prepared a new set of WT and A666G PM vesicles and again tested the effect of varying ATP concentrations on the IRs of fluorescence quenching. In this experiment, however, we also measured the IRs of R6G fluorescence quenching at the lower ATP concentrations of 0.5 and 1.0 mM. The results in the two experiments were qualitatively similar (Fig. 8B). Pertinent kinetic data for the experiments shown in Fig. 8 are averaged and presented in Table 2.
The Supporting Information presents results from a set of WT and A666G mutant preparations that were made and tested independently of each other (Fig. S6A and -B). In addition, an earlier experiment that used a pair of WT and A666G PM vesicles prepared with the original purification method and therefore of lower ATPase and quenching activity (Fig. S6C). In all of these, the h coefficient was noticeably higher for the mutant than the WT.
We compared the enhancement of quenching in the A666G PM vesicles at each of the ATP concentrations that we tested (Fig. 8C). Overall, we saw no significant difference in enhancement at concentrations that were above or below the Km values. However, in both experiments, the ATP concentration directly above the Km resulted in the largest enhancement.
The inhibition of R6G fluorescence quenching by IMZ in A666G PM vesicles also exhibited enhanced cooperativity
We also observed enhanced cooperativity in the A666G mutant PM vesicles when we used IMZ to inhibit R6G fluorescence quenching. We compared the inhibition of R6G fluorescence quenching with 50, 75, and 100 nM R6G in new pairs of PM vesicles prepared from the WT and A666G strains (Fig. 9A-C). The lowest concentration of IMZ used (0.5 μM) resulted in 0%−15% inhibition relative to the untreated control depending on the strain and R6G concentration. The mutant curves exhibited greater cooperativity than the WT ones at all three concentrations. The data are summarized in Table 3, where they are compared to the values obtained from experiments in which we monitored the IR of R6G fluorescence quenching as a function of ATP concentration. The h coefficients for both WT and mutant were higher in the experiments where ATP was varied than in those in which we used imazalil sulfate as an inhibitor.
Table 3. Summary of h values from various experiments.
The h values were determined for two different types of experiments. One set of experiments determined the IRs as a function of ATP concentration. A second set of experiments compared the inhibition of R6G fluorescence quenching in WT and A666G PM vesicles by imazalil sulfate.
| Strain | Conditions | Mean h value | n | SD |
|---|---|---|---|---|
| WT (JG2015) | Varying the ATP concentration | 4.1 | 3† | 1.6 |
| WT (JG2015) | Imazalil sulfate inhibition | 2.3 | 3 | 0.5 |
| A666G | Varying the ATP concentration | 6.6 | 3† | 1.8 |
| A666G | Imazalil sulfate inhibition | 3.7 | 3 | 1.1 |
These calculations include an experiment performed with an additional PM preparation of WT and A666G PM vesicles made and tested separately. The additional plots are found in the (Supporting Information Fig. S6A, B).
Discussion
Traditionally, cancers and pathogenic organisms are screened for the overexpression of these efflux pumps. In this report, we describe the phenotypic features of a novel mutation: A666G, which exhibited robust enhancement in drug resistance. This mutant acquired under selection generally had IC50 values that were 2.5–4x as high as the WT depending, on the substrate. When we measured R6G efflux in whole cells, the WT retained ~3.4–6x as much fluorescence as the mutant. Significantly, these enhancements occurred despite no further increase in the ATPase activity or the steady-state level in the PM.
These observations have major implications for therapeutic treatment of cancers and fungal pathogens. They suggest that further robust resistance mediated by ABC transporters may be obtained without overexpression. The transport of clotrimazole and coumarin 6, however, was not enhanced by this alteration. We observed no difference in clotrimazole resistance or coumarin 6-transport capability between the WT and A666G mutant strains. Understanding the mechanism behind the increased resistance that defines the A666G mutant phenotype might offer improved treatment of fungal resistance and drug-resistant cancer. It may help identify therapeutic compounds that are more effective because mutants similar to A666G are unable to enhance their transport.
Our observations suggest a novel mechanism for the resistance exhibited by the A666G mutant. Conservation of this residue in numerous clinically relevant fungal transporters and the similar phenotype of the A666G substitution in CaCdr1 suggests that this could be a significant way to increase multidrug resistance.
Both whole-cell transport and fluorescence-quenching assays in the presence and absence of competing transport substrates indicate that this mutant makes the efflux process more efficient by increasing cooperativity between transport sites. It is important to note that cooperativity between drug-binding sites in P-gp has been known for some time (Shapiro and Ling, 1997). That a genetic modification can result in greater resistance because of increased cooperativity is a novel and important observation, however. Although there are numerous examples of multidrug transporter overexpression leading to hyperresistance, the mechanism behind mutants such as A666G remained unknown. When the IRs of R6G fluorescence quenching were plotted as a function of ATP concentration, both mutant and WT preparations showed cooperativity. However, it was greater in the mutant. We observed a similar phenomenon with IMZ inhibition of R6G fluorescence quenching. It should be noted, however, that small changes in the IRs of R6G fluorescence quenching can result in relatively large changes in h coefficients. Therefore, a single experiment is probably not definitive. For instance, in the plot shown in Fig. 8A, the 95% confidence interval for the WT gives a range for the h coefficient of 4.2–8.6. For the A666G mutant the range is 6.7–11. When we pooled all of the data including that found in the Supporting Information, the difference in h coefficients between WT and mutant was significant according to a t-test (p = 0.036). Furthermore, in all of the experiments in which we determined the h coefficient, the mutant value was always higher than the corresponding WT coefficient obtained at the same time. Thus, the evidence that the A666G mutant enhances resistance by increasing cooperativity between transport sites is striking.
Interestingly, when we compared the kinetics of IMZ inhibition of R6G transport to ATP-dependent R6G fluorescence quenching, the former exhibited less cooperativity in both the mutant and WT preparations. The WT differential was statistically significant (p = 0.022). This observation suggested that although Pdr5 ATPase is unstimulated by its substrates, they affect the interaction between transport sites. Consistent with this idea is the observation that IMZ is a weaker substrate than R6G. For instance, the ΔPdr5 strain was only 10 times as sensitive to IMZ as the WT (Downes et al., 2013). In contrast, the strain lacking Pdr5 retained 20 times as much R6G fluorescence as the WT strain. Furthermore, it took micromolar amounts of IMZ to completely inhibit nanomolar amounts of R6G quenching.
We considered the possibility that the cooperativity we observed could be accounted for by the kinetic drug selection model first proposed by Ernst et al. (2008) to explain the behavior of a substrate-specific H-loop mutation of Pdr5. This model proposes that the time spent in each conformational state during the transport cycle is subject to genetic control. Therefore, a mutation could lead to a longer period spent in the inward-facing, drug-binding structure. This might also result in a longer period for a substrate to interact with Pdr5 and perhaps allow increased cooperativity. This model may very well explain some of the interesting FK506 hyperreistant mutants in Cdr1 and Pdr5 (Tanabe et al., 2018). Although we have no concrete kinetic evidence that it explains the behavior of the A666G mutant, some observations from this study lend support to this model. The kinetic drug selection model predicts that when the IRs of the quenching reaction are below the Km (which is ~2.0–3.5 mM ATP), the differential between the mutant and WT should be reduced or perhaps even eliminated because the ATP is rate limiting. Under such conditions, the entire transport cycle would be moving relatively slowly and the substrate (R6G) would therefore have more time to interact with even the WT transporter. It is not clear how far below the Km the ATP concentration would need to be to observe such an effect. Although we saw no significant difference when we compared the quenching enhancement above and below the Km, the difference at the 0.5 mM ATP concentration was lower (1.5x faster in the mutant preparations) than that observed directly above the Km (2.3x faster in the mutant preparations). Furthermore, the lack of an enhancement in coumarin 6 transport (Supporting Information) in the A666G strain makes us cautious about discarding kinetic substrate selection as the explanation for this mutant’s behavior. One prediction of this model is that strong Pdr5 substrates (for instance, those that equilibrate rapidly) might interact so quickly with Pdr5 that the time spent in the drug-binding conformation is not rate limiting. The transport of such compounds would therefore not be enhanced further by increasing the proportion of time spent in the drug-binding (inward-facing) conformation.
The recently reported cryo-EM structure of ABCG2 (Manolaridis et al., 2018) suggests that substrates bind to an inner pocket containing drug-binding sites. During the ATP-driven conformational switch, drug molecules pass through a gate to an outer binding pocket before release. It is possible that Pdr5 has an analogous structure. Pdr5 has a gating function and Ser-1368 is critical (Mehla et al., 2014). An alignment of ABCG2 and Pdr5 places Ser-1368 quite close to Leu-554 and Leu-555, which make up part of the gate in the former efflux pump. It is possible that the A666G mutant fosters even greater cooperativity between two pockets during this two-step exit process.
Experimental procedures
Yeast strains and plasmids
All the Saccharomyces cerevisiae strains (Table 1) we used were isogenic and derived from R-1, which lacks all PM ABC transporters and contains a PDR1–3 mutation, which causes overexpression of PDR5. Thus, the Pdr5 efflux pump mediates virtually all drug resistance to the particular compounds that we tested. This strain offers numerous other advantages for genetic and biochemical analyses, which are described in detail elsewhere (Sauna et al., 2008; Ananthaswamy et al., 2010). It served as a negative control for most of the experiments in this paper. We also used a phenotypically null mutation, G312A, as a negative control. We cultured the strains at 30 °C in yeast extract, peptone, dextrose (YPD) medium. We used the pSS607-integrating plasmid for site-directed mutagenesis, as previously described (Golin et al., 2007). This plasmid has a WT PDR5 gene under the transcriptional control of its own upstream region, as well as a URA3-selectable marker. We initially used isogenic strains containing two copies of either WT or an A666G mutant gene to make purified PM vesicles for ATPase, fluorescence-quenching, and vesicle-transport assays. Double-copy strains were also used for the whole-cell-transport assays with [3H]-clotrimazole. In general, we cultured cells in yeast extract, peptone, dextrose (YPD) medium at 30 °C. Cultures used to perform whole-cell-transport assays were grown in synthetic dextrose, yeast nitrogen base medium (SD) supplemented with uracil and histidine. Later in the study, when we switched to a better method for purifying PM vesicles that yielded preparations of much higher ATPase activity, we used the single-copy WT (JG2015) and A666G strains for the biochemical assays.
Table 1.
Yeast strains used in this study
| Strain number | Genotype | Reference |
|---|---|---|
| R-1 | MATα his1, ura3, PDR1-3, pdr5::KanMX4, snq2, yor1, pdr3, pdr10, ycf1 | Sauna et al., 2008 |
| JG2015 | Isogenic to R-1, but contains an insertion of pSS607 that has a WT PDR5 gene in addition to the pdr5::KanMX4 cassette | Golin et al., 2007 |
| JG2063 | Isogenic to JG2015 but containing a G312A mutation in the insertion plasmid pSS607 instead of the WT allele | Furman et al., 2013. |
| JG2133 | Isogenic to JG2015, but containing an A666G mutation in the insertion plasmid pSS607 instead of the WT allele | This study |
| JG2004 | Isogenic to JG2015, but the pdr5::KanMX4 cassette was replaced with a second copy of PDR5 | Sauna et al., 2008 |
| JG2153 | Isogenic to JG2133, but the strain contains two copies of the A666G mutation | This study |
All of the yeast strains used in this study are derivatives of the R-1 strain.
Chemicals and media
We purchased most of our chemicals from Sigma Aldrich. Five-fluoroorotic acid and G-418 came from Research Products International, and we obtained climbazole, cerulenin, cyproconazole, tebuconazole, and IMZ from LKT laboratories and from Sigma Aldrich. We purchased tributyltin chloride from Alfa Aesar. All chemicals were dissolved in DMSO except for 5-fluoroorotic acid and G-418, which were dissolved in sterilized YPD medium, and cycloheximide, which was dissolved in sterile, MilliQ water. [3H]-coumarin 6 (20 Ci/mmol) came from American Radiolabeled Chemicals.
Measurement of relative resistance of strains
To measure the relative resistance of each strain to all the compounds except for R6G, we inoculated yeast strains in 5ml of YPD broth and grew them overnight at 30 °C in an incubator shaker overnight at 110 rpm. The next day, we placed 2 ml of sterile YPD broth into sterile glass tubes. We introduced the desired concentration of drug into each tube. We measured the absorption of overnight culture with a spectrophotometer at ABS600 and used the value to calculate the cell concentration; we added 0.5 × 10⁵ cells (typically 2–5 μl). We incubated cultures at 30 °C for 48 h at 110 rpm in a shaking incubator. We measured absorbance at 600 nm (A600). We used isogenic WT and Δpdr5 strains to compare the susceptibility of the mutants to the drugs. For each strain, an untreated culture served as a growth control.
Site-directed mutagenesis
We introduced the Ala-666 substitutions into pSS607 with a Quikchange Lightning site-directed mutagenesis kit (Agilent Technologies). We designed mutant primers with a genomics program provided by Agilent Technologies (www.genomics.agilent.com). The mutant plasmids were introduced into XL-Gold E. coli by transformation, as described in the Quikchange instruction manual. We extracted plasmid DNA from the transformants with an IBI miniprep kit (Midwest Scientific) and had it sequenced commercially to confirm the presence of the mutation in the plasmid (SeqWright). We introduced the mutant plasmid DNA into R-1 with a Sigma Aldrich yeast transformation kit. Genetic testing described elsewhere (Ananthaswamy et al., 2010) confirmed that the construct was correctly inserted.
Preparation of purified PM vesicles
We initially prepared purified PM vesicles essentially as described by Shukla et al. (2003), with minor modifications. We determined the protein concentration of PM vesicle protein with a bicinchonic acid kit. Although this protocol gave satisfactory results, the proportion of Pdr5 in PM vesicles and therefore the ATPase activity varied significantly from preparation to preparation. Midway through this study, we adopted the procedure of Kolaczkowski et al. (1996) as modified by Ernst et al. (2008), which significantly reduces the amount of contaminating mitochondrial membrane and gives consistently higher ATPase activity.
Gel electrophoresis of PM vesicle proteins
To check the quality of PM vesicle proteins, we solubilized samples containing 5 and 10 μg PM vesicle protein in SDS-PAGE buffer for 30 min at 37 °C. We separated the proteins on NU PAGE 7% tris acetate gels (125–150 V for ~80 min; Life Technologies) before staining them for one hour in SimplyBlue (Coomaissie G-250) Safe Stain (Thermo Fisher) and destaining for 24–36 hours in MilliQ water.
Western blots of Pdr5 in PM vesicles
We conducted Western blotting with 10 μg PM vesicle protein as previously described (Downes et al., 2013). We performed the transfer from the gel to the nitrocellulose membrane (400 mAmp, 60 min) with an X Cell II minicell apparatus (Invitrogen). We purchased all the antibodies from Santa Cruz Biotechnology. We diluted the polyclonal goat anti-Pdr5 (yC18) and anti-Pma1 (yN-20) antibodies 1:1000 and 1:250, respectively. We blocked the nitrocellulose membranes for 30 min with 5% nonfat milk in PBS containing 1% Tween 20. Following this, we incubated the filters with both the Pdr5 and Pma1 primary antibodies overnight at 4 °C. We washed three times for 15 min before adding a 1:5000 dilution of secondary antibody (donkey, antigoat IgG horseradish peroxidase; SC2033) and incubating at room temperature for 2 h. We developed blots with a Novex ECL horseradish peroxidase chemiluminescent substrate reagent kit (Thermofisher). The relative amount of Pdr5 protein was compared from the Pdr5/Pma1 ratio as previously described (Downes et al., 2013).
Assay of ATPase activity
We initially measured Pdr5-specific ATPase activity for 8 min at 35 °C with 16 μg purified PM vesicle protein in a final volume of 100 μl as previously described (Golin et al., 2007), except that we assayed activity for 8 min at 35 °C in the same Hepes transport buffer used to measure Pdr5-mediated coumarin 6 and R6G quenching (50mM Hepes, pH 7.0, and 5 mM MgCl2). After we switched to the PM vesicle preparation method of Kolaczkowski et al. (1996), we reduced the amount of protein/assay to 5.0 μg. To measure the ATPase activity of the PM vesicles purified with the Kolackowshi method, we used 300mM Tris-glycine buffer (pH 9.5) in a final volume of 100 μl for 8 min at 35 °C. To reduce background, we added 0.2 mM ammonium molybdate, 50mM KNO3, and 10mM NaN3, respectively (Goffeau et al., 1988). The non-Pdr5 activity observed in ΔPdr5 negative control PM vesicles was subtracted as background before calculating activity.
Assay of [3H]-coumarin 6 transport in whole cells
To measure [3H]-coumarin 6 transport against a concentration gradient (Supporting Information), 3 × 10⁶ cells in the exponential phase of growth were pelleted in sterile Eppendorf tubes. We removed the supernatant and resuspended the pellets in 500 μl of 0.02 M Hepes, 1 mM glucose (pH 7.0) containing [3H]-coumarin 6 made up to 20 μM with nonradioactive compound. We incubated the cells at 30 °C in a circulating water bath for 90 min, pelleted them, and washed them twice with 1 ml of cold 0.02M Hepes buffer (pH 7.0) minus glucose. The pellets were resuspended in 500 μl of the same buffer and analyzed with a Triathler liquid scintillation counter (Lab Logic).
R6G transport in whole cells
We measured R6G transport against a 10μM concentration gradient. We placed 3 × 10⁶ cells in 500 μl of 0.02 M Hepes, 1 mM glucose (pH 7.0), and 10 μM R6G, and incubated them at 30 °C for 90 min. The cells were pelleted and washed with 1 ml of cold 0.02M Hepes buffer (pH 7.0) minus glucose. The pellets were resuspended in 500 μl of the same buffer and analyzed with a FACSort with an excitation wavelength of 529 nm and an emission wavelength of 553 nm. For each determination, the median retained fluorescence was obtained from sorting 10,000 cells. We analyzed the data with a CellQuest program. We expressed retained fluorescence in a.u. When IMZ was used to inhibit R6G transport, it was present throughout the assay.
R6G and coumarin 6 transport in purified PM vesicles
We performed assays of R6G quenching in purified PM vesicles as described by Kolaczkowski et al. (1996) with the same buffer conditions at 35 °C and a few minor modifications (Furman et al., 2013). We compared activities in preparations that were made within a few days of each other, with identical buffers and reagents. Unless otherwise indicated, each reaction contained 30 μg of purified PM vesicle protein. We used a Varian Cary Eclipse fluorimeter (Agilent Technologies). The excitation wavelength was 529 nm, and the emission wavelength was 553 nm. We used 12.5–100 nM R6G for the quenching reactions. We mixed multiple reactions’ worth of components in a 15-ml tube to ensure uniformity across a set of assays. Following this, we split the mixture and placed 2-ml portions in cuvettes. We added a fixed concentration of ATP to one tube and immediately placed it in the fluorimeter at 35 °C; we monitored quenching for 8–20 min, depending on the experiment. Our kinetic analysis of quenching used Varian Cary Eclipse kinetics software (Agilent Technologies). Fluorescence was expressed as a.u. In inhibition studies with IMZ, the antagonist was present for the duration of the reaction. The same fluorescence quenching assay was adapted for use with coumarin 6 (Supporting Information). We used coumarin 6 concentrations of 100–300 nM. The excitation was 460 nm, and the emission wavelength was 500 nm.
Statistical and kinetic analyses
We performed statistical and kinetic analyses with Prism GraphPad 8 software. Error bars in the figures or a ± designation in the text indicates the standard error of the mean.
Supplementary Material
Acknowledgements
This work was supported by NSF grant MCB1048838 and NIH grant GM07721 to JG. SVA’s work is supported by the Intramural Health, National Cancer Institute, Center for Cancer Research. We thank Dante Nicotera and William Braungart for help with the fluorescence-quenching assays and Ekaterina Nestorovich for help with the analysis of fluorescence-quenching plots.
4 This work was supported by NSF grant MCB1048838 and NIH grant GM07721
Footnotes
Conflict of interest
The authors declare no conflict of interest with the contents of this article. Thecontent is solely the responsibility of the authors and does not necessarily represent the official views of the National Institutes of Health.
References
- Ananthaswamy N, Rutledge R, Sauna ZE, Ambudkar SV, Dine E, Nelson E, Xia D, and Golin J (2010) The signaling interface of the yeast multidrug transporter Pdr5 adopts a cis configuration and there are functional overlap and equivalence of the deviant and canonical Q-loop residues. Biochemistry, 49, 4440–4449. [DOI] [PMC free article] [PubMed] [Google Scholar]
- Bruggemann EP, Germann UA, Gottesman MM, and Pastan I (1989) Two different regions of P-glycoprotein are photoaffinity labeled by azidopine. Journal of Biological Chemistry, 264, 15483–15488. [PubMed] [Google Scholar]
- Dalmas O, Orelle C, Foucher AE, Geourjon C, Crouzy S, Pietro AD, and Jault JM (2005) The Q-loop Disengages from the First Intracellular Loop during the Catalytic Cycle of the Multidrug ABC Transporter BmrA, Journal of Biological Chemistry, 280, 36857–36864. [DOI] [PubMed] [Google Scholar]
- Downes MT, Mehla J, Ananthaswamy N, Wakschlag A, LaMonde M, Dine E, Ambudkar SV, and Golin J (2013) The transmembrane interface of the Saccharomyces cerevisiae multidrug transporter Pdr5: Val-656 located in intracellular-loop 2 plays a major role in drug resistance. Antimicrobial Agents and Chemotherapy, 57, 1025–1034. [DOI] [PMC free article] [PubMed] [Google Scholar]
- Ernst R, Kueppers P, Klein CH, Schwarzmueller T, Kuchler K, and Schmitt L (2008) A mutation of the H-loop selectively affects rhodamine transport by the yeast ABC transporter Pdr5. Procedings of The National Academy of Sciecnes of The United States of America, 105, 5069–5074. [DOI] [PMC free article] [PubMed] [Google Scholar]
- Furman C, Mehla J, Ananthaswamy N, Arya N, Kulesh B, Kovach I, and Golin J (2013). The deviant ATP-binding site of the multidrug efflux pump Pdr5 plays an active role in the transport cycle. Journal of Biological Chemistry, 288, 30420–30431. [DOI] [PMC free article] [PubMed] [Google Scholar]
- Gbelska Y, Krjger J-J, and Breunig KD. (2006). Evolution of gene families: the multidrug transporter genes in five related yeast species. FEMS Yeast Research, 6, 345–355. [DOI] [PubMed] [Google Scholar]
- Goffeau A and Dufour JP (1988) Plasma membrane ATPase from the yeast Saccharomyces cerevisiae. Methods in Enzymology, 157:528–533. [DOI] [PubMed] [Google Scholar]
- Golin J and Ambukar SV (2015) The multidrug transporter Pdr5 on the 25th anniversary of its discovery: an important model for the study of asymmetric ABC transporters. Biochemical Journal, 467, 353–363. [DOI] [PMC free article] [PubMed] [Google Scholar]
- Golin J, Ambudkar SV, Gottesman MM, Habib A, Sczepanski J, Ziccardi W, and May L (2003) Studies with novel Pdr5p substrates demonstrate a strong size dependence for xenobiotic efflux. Journal of Biological Chemistry, 278, 5963–5969. [DOI] [PubMed] [Google Scholar]
- Golin J, Kon ZN, Wu CP, Martello J, Hanson L, Supernavage S, Ambudkar SV, and Sauna ZE (2007) Complete inhibition of the Pdr5 multidrug efflux pump ATPase activity by its transport substrate clotrimazole suggests GTP as well as ATP may be used as an energy source. Biochemistry, 46, 13109–13119. [DOI] [PubMed] [Google Scholar]
- Gottesman MM, Fojo T, and Bates SE (2002) Multidrug resistance in cancer: role of ATP- dependent transporters. Nature Review of Cancer, 2, 46–58. [DOI] [PubMed] [Google Scholar]
- Kathawala RJ, Gupta P, Ashley CR, and Chen Z-S. (2015) The modulation of ABC transporter-mediated multidrug resistance in cancer: a review of the past decade. Drug Resistance Updates, 18, 1–17. [DOI] [PubMed] [Google Scholar]
- Kolaczkowski M, van der Rest M, Cybularz-Kolaczkowski A, Soumillion JP, Konigs WN, and Goffeau A (1996) Anticancer drugs, ionophoric peptides, and steroids as substrates of the yeast multidrug transporter Pdr5. Journal of Biological Chemistry, 271, 31543–31548. [DOI] [PubMed] [Google Scholar]
- Konotoylannis D and Lewis RE (2002) Antifungal drug resistance of pathogenic fungi. Lancet, 355, 1135–1144. [DOI] [PubMed] [Google Scholar]
- Kolaczkowski M, Sroda-Pomianek K, Kolaczkowski A, and Hichalak K (2013) A conserved interdomain communication pathway of peudosymmetrically distributed residues affects the substrate specificity of fungal multidrug transporter Cdr1. BBA Biomembranes, 1828, 479–490. [DOI] [PubMed] [Google Scholar]
- Lage H (2003) ABC transporters: implication on drug resistance from microorganisms to human cancers. International Journal of Antimicrobial Agents, 22, 188–199. [DOI] [PubMed] [Google Scholar]
- Lamping E, Baret PV, Holmes AR, Monk BC, Goffeau A, and Cannon RD (2010) Fungal PDR transporters: phylogeny, topology, motifs, and function. Fungal Genetics and Biology, 47 (2), 127–142. [DOI] [PMC free article] [PubMed] [Google Scholar]
- Li D, Zhang J, Anpo M, Xue M, and Liu Y (2005) Photophysical and photochemical properties of coumarin-6 molecules incorporated within MCM-48. Materials Letters, 59, 2120–2123. [Google Scholar]
- Loo TW, Bartlett MC, and Clarke DM (2003) Simultaneous binding of two drugs in the binding pocket of human multidrug resistance protein P-glycoprotein. Journal of Biological Chemistry, 278, 39706–39710. [DOI] [PubMed] [Google Scholar]
- Lugo M and Sharom FJ (2005) Interactions of LDS-751 and rhodamine 123 with P-glycoprotein. Evidence for simultaneous binding of both drugs. Biochemistry, 44, 14020–14029. [DOI] [PubMed] [Google Scholar]
- Manolaridis I, Jackson SM, Taylor NMI, Korval J, Stahlberg H, and Locker KP (2018) Cryo-EM structures of a human ABCG2 mutant trapped in ATP-bound and substrate bound states. Nature, 563, 426–430. [DOI] [PMC free article] [PubMed] [Google Scholar]
- Martin C, Berridge C, Higgins CF Mistry P, Charlton P, and Callaghan R. (2000) Communication between multiple drug-binding sites pn P-glycoprotein. Molecular Pharmaceutics, 56, 624–632. [DOI] [PubMed] [Google Scholar]
- Mehla J, Ernst R, Moore R, Wakschlag A, Marquis MK , Ambudkar SV, and Golin J (2014) Evidence for a diode-baseed mechanism in a multispecific ATP-binding cassette (ABC) transporter Pdr5. Journal of Biological Chemistry, 289, 26597–26606. [DOI] [PMC free article] [PubMed] [Google Scholar]
- Meyers S, Schauer W, Balzi E, Wagner M, Goffeau A, and Golin J (1992) Interaction of the pleiotropic drug resistance genes PDR1 and PDR5. Current Genetics 21, 431–436. [DOI] [PubMed] [Google Scholar]
- Ozalp VC, Pedersen TR, Nielsen LJ, and Olsen LF (2010) Time-resolved measurements of intracellular ATP in the yeast, Saccharomyces cerevisiae using a new type of nanosensor Journal of Biological Chemistry, 285, 37579–37588. [DOI] [PMC free article] [PubMed] [Google Scholar]
- Pfaller MA (2012) Antifungal drug resistance: mechanisms, epidemiology, and consequences for treatment. The American Journal of Medicine, 125, S3–S13. [DOI] [PubMed] [Google Scholar]
- Prasad R, Banerjee A, Khandewal NK, and Dhamagaye S (2014) The ABCs of Candida albicans multidrug transporter Cdr1p. Eukaryotic Cell, 14, 1154–1164. [DOI] [PMC free article] [PubMed] [Google Scholar]
- Rahman H, Carneglia I, Lausten M, Robertello M, Choy J, and Golin J (2018) Robust, pleiotropic drug resistance 5 (Pdr5)-mediated drug resistance is vigorously maintained in Saccharomyces cerevisiae during glucose and nitrogen limitation. FEMS Yeast Research, 18, foy029. [DOI] [PMC free article] [PubMed] [Google Scholar]
- Rutledge RM, Esser L, Ma J, and Xia D (2011) Toward understanding te mechanism of action of the yeast multidrug transporter Pdr5p: A molecular modeling study (2011) Journal of Structural Biology, 173, 333–344. [DOI] [PMC free article] [PubMed] [Google Scholar]
- Sauna ZE, Bohn SS, Rutledge R, Dougherty MP, Cronin S, May L, Xia D, Ambudkar SV, and Golin J (2008) Mutations define cross-talk between the N-terminal transporter Pdr5: Possible conservation of a signaling interface for coupling ATP hydrolysis to drug transport. Journal of Biological Chemistry, 28, 35010–35023. [DOI] [PMC free article] [PubMed] [Google Scholar]
- Seeger MA, Bordignon E, and Hohl M (2015) ABC exporters from a structural perspective in George AM. (ed) ABC Transporters: Forty Years Springer, p. 65–84. [Google Scholar]
- Shapiro A And Ling V (1997) Positively cooperative sites for drug transport by P-glycoprotein with distinct drug specificities. European Journal of Biochemistry, 250, 130–137. [DOI] [PubMed] [Google Scholar]
- Shukla S, Saini P, Jha S, Ambudkar SV, and Prasad R (2003) Functional Characterization of C.albicans ABC transporter Cdr1. Eukaryotic Cell, 2, 1361–1375. [DOI] [PMC free article] [PubMed] [Google Scholar]
- Siegel M and Ragsdale N Antifungal mode of action of imazalil. (1978) Plant Biochemistry and Physiology 9: 48–56. [Google Scholar]
- Tanabe K, Bonus M, Tomryama S, Miyoshi K, Nagi M, Nimi K, Chindamporn A, et al. (2018) FK506 resistance of S. cerevisiae Pdr5 and C. Albicans Cdr1 involves mutants in transmembrane domains and extracellular loops. Antimicrobial Agents and Chemotherapy, Doi 10.1128/AAC.01146-18. [DOI] [PMC free article] [PubMed] [Google Scholar]
- Urbatsch IL, Gimi K, Wilke-Mounts S, and Senior AE (2000) Investigation of the role of glutamine-471 and glutamine-1114 in the catalytic sites of P-glycoprotein. Biochemistry 39, 11921–11927. [DOI] [PubMed] [Google Scholar]
Associated Data
This section collects any data citations, data availability statements, or supplementary materials included in this article.