Up to 60% of sickle cell anemia (SCA) adults have evidence of chronic kidney disease (CKD).[1] We hypothesized that kidney ultrasound measures of echogenicity and size may serve as a non-invasive prognostic markers for CKD in SCA. Among University of Illinois at Chicago SCA patients who received ultrasounds as part of routine care, increased kidney echogenicity was an independent predictor of CKD progression among all 177 SCA patients with longitudinal follow up as well as in the subset of 104 with normal kidney function at the time of the ultrasound and 96 who had ultrasounds performed for non-renal indications.
Kidney biopsy is associated with a risk for bleeding and is infrequently performed in patients with SCA but renal ultrasonography is non-invasive, safe and widely available. In non-SCA cohorts, kidney echogenicity correlates with tubulointerstitial damage, glomerulosclerosis,[2] and reduced estimated glomerular filtration rate (eGFR).[3] Small kidney size correlates with some histopathologic changes[2] but does not consistently predict kidney function.[3] Abnormal kidney ultrasound findings have been described in SCA, with 15–30% of patients having enlarged kidneys and 10–18% having increased echogenicity.[4, 5] The prevalence of small kidney size and the association of abnormal kidney ultrasound findings with eGFR or albuminuria in SCA are unclear.
We retrospectively analyzed the association of abnormal kidney ultrasound findings with 1) kidney function, 2) genetic predictors of sickle cell nephropathy, and 3) CKD progression in SCA adults (HbSS or HbSβ0-thalassemia) treated at the University of Illinois at Chicago. The protocol was approved by the Institutional Review Board prior to data collection. A total of 267 SCA patients with genotyping data for APOL1 G1/G2, BCL11A rs1427407, and α-thalassemia status were screened for abdominal or retroperitoneal ultrasounds performed as part of their routine care between 2/2002 and 2/2018. All SCA patients with an ultrasound performed during this time period were included in the analysis. Laboratory and clinical data were extracted from the electronic medical charting system, Cerner PowerChart, closest to the time when the ultrasounds were performed. The eGFR was calculated using serum creatinine and the CKD-Epidemiology Collaboration formula.[6]
Kidney ultrasounds were independently reviewed by radiologists who were masked to the measures of kidney function. Right kidney measurements were used in this analysis. Normal kidney ranges were considered to be 10–14 cm in men and 9–13 cm in women. Echogenicity was classified as normal if the renal cortex was less echogenic than the adjacent liver, mildly increased if the renal cortex was of the same or greater echogenicity than the adjacent liver, and markedly increased if the renal cortex echogenicity obliterated the renal sinus.[4] Hemoglobinuria was defined as urinalysis positive for blood by dipstick with <2 red blood cells per high power field. Genotyping for APOL1 G1 and G2, α-thalassemia, and BCL11A rs1427407 variants was performed by real time polymerase chain reaction as previously described and APOL1 G1/G2 was defined as homozygous or compound heterozygous inheritance of the G1 and G2 variants.[1]
We evaluated the association of abnormal kidney ultrasound findings with macroalbuminuria (≥300 mg albumin/g creatinine) and eGFR<60mL/min/1.73m2 (low eGFR) using the Cochran’s test for linear trend. Variables by kidney ultrasound findings were compared using the linear trend or Kruskall-Wallis tests for linear variables and Cochran’s test for linear trend or Chi square for categorical variables. Applying the Bonferroni correction, P ≤0.003 (0.05/17) was considered significant for univariate analyses. The association of genetic variants with kidney ultrasound findings was assessed by logistic regression analysis adjusting for age, sex, hydroxyurea therapy, and eGFR at the time the ultrasounds were performed. Longitudinal data from the time the ultrasound was performed were utilized to determine CKD progression, defined as a 50% eGFR decline or requirement for dialysis. CKD progression was examined in those with at least 6 months of follow up from the time of ultrasound with Kaplan-Meier survival curves and Cox proportional hazards ratio, adjusting for age, sex, hydroxyurea therapy, and eGFR at the time the ultrasound was performed. Systat 13 (Systat Software Corporation, Chicago IL) was used for the statistical analyses.
Between 2/2002 and 2/2018, 185 SCA patients underwent ultrasounds of the abdomen or kidney as part of routine medical care. The median age at the time of ultrasound was 35 years and 62% were female. Of the 185 ultrasound evaluations, 89 (48%) were performed to evaluate the kidneys and the remaining were performed for other indications (Supplementary Table 1). Twenty-five percent of the patients had urine albumin ≥300mg/g creatinine, 28% had eGFR <60mL/min/1.73m2, and 15% had the combination at the time of ultrasound.
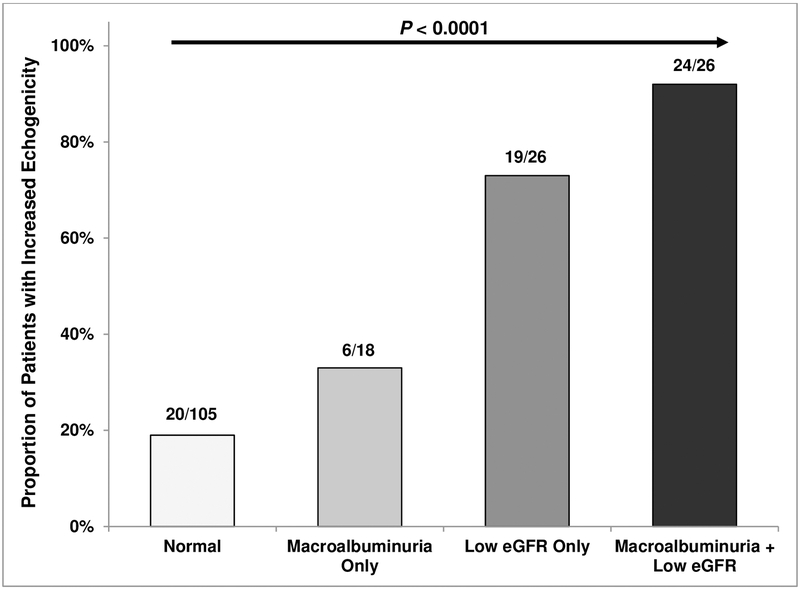
Echogenicity was mildly increased in 43 (23%) and markedly increased in 28 (15%) of the patients. The proportion of patients with increased kidney echogenicity was greater in those with macroalbuminuria-only (33%), low eGFR-only (73%), or the combination of both (92%), compared to those with normal kidney function (19%)(P <0.0001)(Figure 1A). Individuals with increased kidney echogenicity were older and had greater albuminuria and lower eGFR (Table 1). On multivariable analysis, absence of α-thalassemia (OR 5.2, 95% CI: 1.9–14.0; P =0.002) and coinheritance of the APOL1 G1/G2 risk variants (OR 5.3, 95% CI: 1.2–23.7; P =0.03) were associated with increased kidney echogenicity after adjusting for age, sex, hydroxyurea therapy, and baseline eGFR.
Figure 1A:
Kidney echogenicity by kidney function status.
Table 1.
Clinical, laboratory, and genetic factors by kidney echogenicity
| Variable | N | Normal | N | Mild Increase | N | Marked Increase | P value |
|---|---|---|---|---|---|---|---|
| Age (years) | 114 | 27 (22 – 41) | 43 | 44 (36 – 50) | 28 | 42 (30 – 50) | < 0.0001 |
| Gender (male:female) | 114 | 34% : 66% | 43 | 51% : 49% | 28 | 36% : 64% | 0.4 |
| Diabetes mellitus (%) | 114 | 3 (3%) | 43 | 0 (0%) | 28 | 2 (7%) | 0.4 |
| Hydroxyurea use (%) | 114 | 51 (45%) | 43 | 26 (60%) | 28 | 14 (50%) | 0.3 |
| ACE-inhibitor/ARB use (%) | 114 | 14 (12%) | 43 | 10 (23%) | 28 | 5 (18%) | 0.2 |
| Body mass index (kg/m2) | 112 | 23 (21 – 26) | 42 | 23 (21 – 26) | 28 | 23 (21 – 27) | 0.7 |
| Systolic blood pressure (mmHg) | 114 | 115 (104 – 127) | 43 | 122 (108 – 139) | 28 | 123 (111 – 143) | 0.007 |
| Ferritin (ng/mL) | 94 | 498 (173 – 1643) | 40 | 669 (324 – 1474) | 26 | 897 (285 – 3117) | 0.07 |
| White blood cell count (x 103/μL) | 114 | 12.0 (8.8 – 15.6) | 43 | 11.3 (8.9 – 14.1) | 28 | 12.7 (10.6 – 17.6) | 0.7 |
| Hemoglobin (g/dL) | 114 | 8.0 (7.2 – 9.2) | 43 | 8.1 (7.2 – 9.0) | 28 | 8.2 (7.3 – 9.0) | 0.6 |
| LDH (u/L) | 100 | 382 (261 – 511) | 42 | 411 (287 – 577) | 27 | 361 (295 – 667) | 0.3 |
| Hemoglobinuria (%) | 101 | 19 (19%) | 35 | 13 (37%) | 23 | 9 (39%) | 0.01 |
| Albuminuria (mg/g creatinine) | 106 | 29 (9 – 112) | 42 | 158 (24 – 799) | 27 | 515 (121 – 2228) | < 0.0001 |
| eGFR (mL/min/1.73m2) | 114 | 139 (113 – 153) | 43 | 46 (33 – 94) | 28 | 36 (20 – 90) | < 0.0001 |
| α-/αα or α-/α- | 47 (42%) | 9 (22%) | 3 (12%) | ||||
| G/T or T/T | 42 (37.5%) | 18 (42%) | 15 (58%) | ||||
| APOL1 G1/G2 risk variant | 112 | 10 (9%) | 43 | 3 (7%) | 26 | 7 (27%) | 0.04 |
ACE, angiotensin converting enzyme; ARB, angiotensin receptor blocker; WBC, white blood cell; LDH, lactate dehydrogenase; eGFR, estimated glomerular filtration rate; APOL1 G1/G2 refers to homozygous or compound heterozygous inheritance of the G1 and G2 risk variants
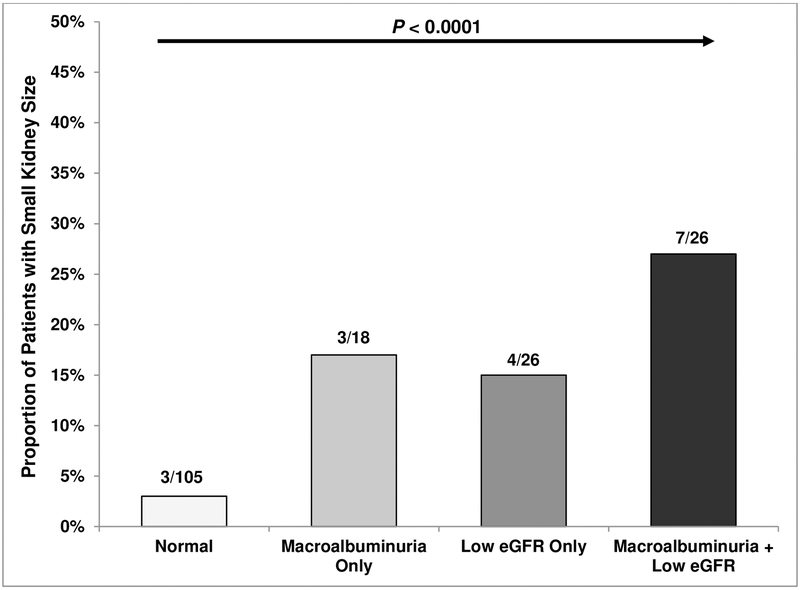
Kidneys were small in 19 (10%) and enlarged in 21 (11%) of the patients. The proportion with small kidneys was greater in those with macroalbuminuria-only (17%), low eGFR-only (15%), or the combination of both (27%) compared to those with normal kidney function (3%) (P < 0.0001)(Figure 1B). Individuals with small kidneys had higher albuminuria and lower eGFR while other clinical variables did not vary according to kidney size (Supplementary Table 2). We did not observe statistically significant differences in coinheritance patterns for α-thalassemia, the BCL11A rs1427407 T allele, or the APOL1 G1/G2 risk variants with enlarged or small kidney size.
Figure 1B:
Small kidney size by kidney function status.
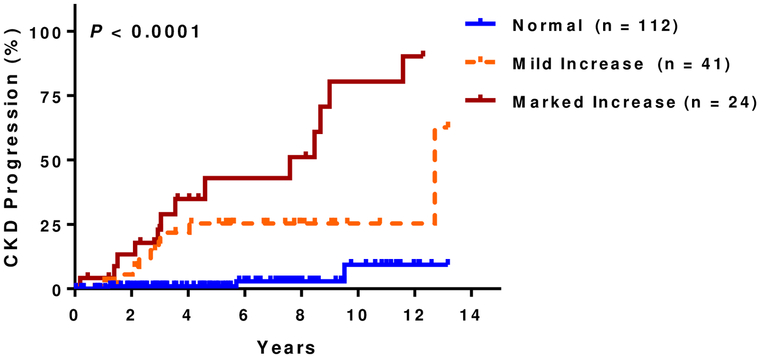
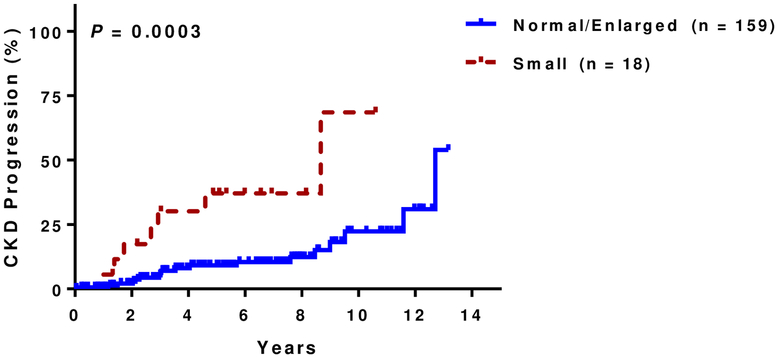
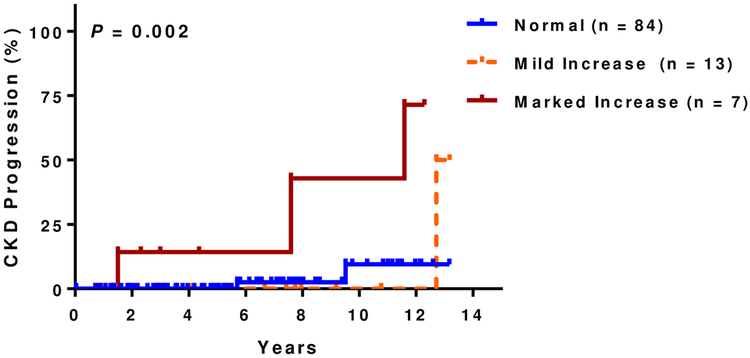
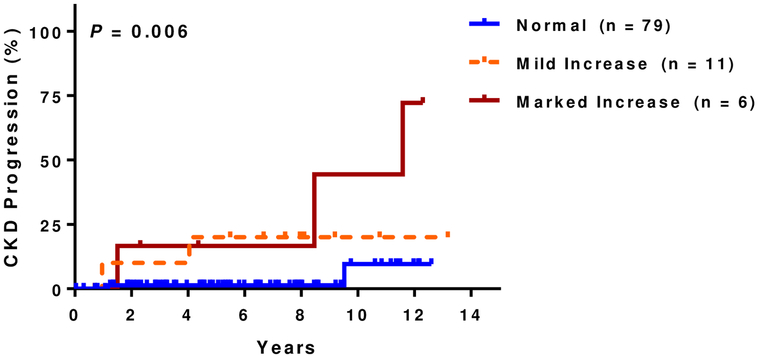
At a median follow up of 5.8 years (IQR, 3.2–8.5 years), 14% (25 of 177 evaluable patients) had CKD progression. Of those that progressed, 15 (60%) were due to a 50% eGFR decline and 10 (40%) were due to requirement for dialysis. Patients with increased kidney echogenicity had a higher rate of CKD progression in univariate analysis (Figure 1C) as did those with small kidney size (Figure 1D). Increasing degree of kidney echogenicity (HR 2.8, 95% CI: 1.5–5.4; P=0.002), but not small kidney size (HR 1.8, 95% CI: 0.6–4.8; P=0.3), was an independent risk factor for CKD progression after adjusting for age, sex, hydroxyurea therapy, and baseline eGFR. Increasing kidney echogenicity was also an independent risk factor for CKD progression in those without macroalbuminuria or eGFR <60 mL/min/1.73m2 (HR 3.9, 95% CI: 1.0–15.5; P=0.05)(Figure 1E) and in the subgroup of patients who had an ultrasound performed for non-renal indications (HR 10.1, 95% CI: 2.2–46.7; P=0.003) after similar adjustments (Figure 1F).
Figure 1C: CKD progression and kidney echogenicity.
Higher rates of CKD progression were observed with increasing kidney echogenicity (normal: 3%, 3/112; mild: 22%, 9/41; marked: 54%, 13/24)
Figure 1D: CKD progression and small kidney size.
Higher rates of CKD progression were observed with smaller kidney size (small: 39%, 7/18; normal or enlarged: 11%, 18/159).
Figure 1E: CKD progression and kidney echogenicity in SCA patients with normal kidney function.
Higher rates of CKD progression with increasing kidney echogenicity were observed in the subset of patients with albuminuria < 300mg/g creatinine and eGFR > 60 mL/min/1.73m2 (normal: 2%, 2/84; mild: 8%, 1/13; marked: 43%, 3/7).
Figure 1F: CKD progression and kidney echogenicity in SCA patients who had an ultrasound performed for non-renal indications.
Higher rates of CKD progression with increasing kidney echogenicity were observed in the subset of patients that had an ultrasound performed for non-renal indications (normal: 3%, 2/79; mild: 18%, 2/11; marked: 50%, 3/6).
Log-rank P values are provided. CKD, chronic kidney disease; SCA, sickle cell anemia; eGFR, estimated glomerular filtration rate
In adults with SCA, we demonstrate that increased kidney echogenicity and reduced kidney size are commonly observed by ultrasound, an imaging modality that is safe, simple, and low cost. Glomeruli and tubules are the primary components that contribute to kidney echogenicity and increased kidney echogenicity is the strongest kidney ultrasound parameter that correlates with glomerular and tubular histopathologic changes.[2] Consistent with the non-SCA literature, increased kidney echogenicity was associated with progressively worsening renal function and with risk for CKD progression on longitudinal follow up in our cohort of SCA patients. Our findings regarding small kidney size are also consistent with studies in non-SCA patients in which kidney length is an inconsistent marker for kidney histopathology and function.[3] In our cohort, small kidney size was associated with impaired renal function versus normal sized kidneys but was not an independent risk factor for CKD progression.
Our genetic associations also highlight the importance of hemolytic and kidney disease risk modifiers on kidney pathology.[1] In patients with SCA, kidney damage may be, in part, mediated by intravascular hemolysis leading to increased cell-free hemoglobin and heme exposure. Alpha thalassemia is associated with reduced intravascular hemolysis in SCA, and our observation that absence of α-thalassemia is an independent predictor for increased kidney ultrasound stage highlights this pathway in sickle cell nephropathy. The APOL1 G1 and G2 risk variants are the strongest genetic risk factor for CKD in African Americans and may enhance glomerular damage through enhanced podocyte necrosis. In our study, coinheritance of the APOL1 G1/G2 risk variants was also an independent predictor for increased kidney ultrasound stage.
There are a number of limitations to our study. Our study is limited by the small sample size, being from a single center and retrospective in nature, and the eGFR being calculated using creatinine based-values. We applied the CKD-EPI formula which has the closest approximation to measured GFR in SCA.[6] Many of the ultrasounds were performed for non-renal indications, although increased kidney echogenicity remained a predictor for CKD progression in this subset of patients. Future, prospective longitudinal studies assessing kidney ultrasound findings, including renal Doppler indices and contrast-enhanced techniques, in conjunction with renal function may provide a deeper understanding for the pathophysiologic changes occurring in the kidneys of SCA patients.
Supplementary Material
Acknowledgements:
The authors thank Rishabh Choudhari and Dallas De La Vara for their assistance. This work was supported by the National Heart, Lung, Blood Institute through grants K23-HL125984 (S.L.S) and NIDDK K24-DK092290 (J.P.L.).
Footnotes
Disclosure of Financial Interests:
There are no relevant conflicts of interest to disclose.
References:
- 1.Saraf SL, Shah BN, Zhang X, et al. APOL1, alpha-thalassemia, and BCL11A variants as a genetic risk profile for progression of chronic kidney disease in sickle cell anemia. Haematologica 2017;102:e1–e6. [DOI] [PMC free article] [PubMed] [Google Scholar]
- 2.Moghazi S, Jones E, Schroepple J, et al. Correlation of renal histopathology with sonographic findings. Kidney international 2005;67:1515–1520. [DOI] [PubMed] [Google Scholar]
- 3.Khati NJ, Hill MC, Kimmel PL. The role of ultrasound in renal insufficiency: the essentials. Ultrasound quarterly 2005;21:227–244. [DOI] [PubMed] [Google Scholar]
- 4.Balci A, Karazincir S, Sangun O, et al. Prevalence of abdominal ultrasonographic abnormalities in patients with sickle cell disease. Diagnostic and interventional radiology 2008;14:133–137. [PubMed] [Google Scholar]
- 5.Papadaki MG, Kattamis AC, Papadaki IG, et al. Abdominal ultrasonographic findings in patients with sickle-cell anaemia and thalassaemia intermedia. Pediatric radiology 2003;33:515–521. [DOI] [PubMed] [Google Scholar]
- 6.Asnani MR, Lynch O, Reid ME. Determining glomerular filtration rate in homozygous sickle cell disease: utility of serum creatinine based estimating equations. PloS one 2013;8:e69922. [DOI] [PMC free article] [PubMed] [Google Scholar]
Associated Data
This section collects any data citations, data availability statements, or supplementary materials included in this article.


