Abstract
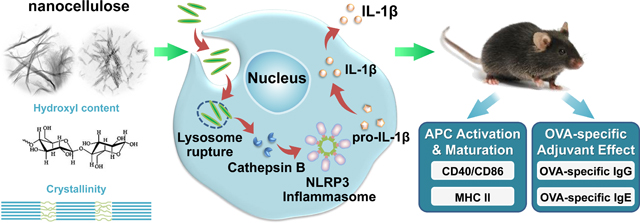
Nanocellulose is increasingly considered for applications, however, the fibrillar nature, crystalline phase and surface reactivity of these high aspect ratio nanomaterials need to be considered for safe biomedical use. We performed a comprehensive analysis of the impact of cellulose nanofibrils (CNF) and nanocrystals (CNC) using materials provided by the Nanomaterial Health Implications Research Consortium of the National Institute of Environmental Health Sciences. We also derived intermediary length nanocrystals by acid hydrolysis. While all CNFs and CNCs were devoid of cytotoxicity, 210 and 280 nm FITC-labeled CNCs showed higher cellular uptake than longer and shorter CNCs or CNFs. Moreover, CNCs in the 200–300 nm length scale were more likely to induce lysosomal damage, NLRP3 inflammasome activation, and IL-1β production than CNFs. The pro-inflammatory effects of CNCs are correlated with higher crystallinity index, surface hydroxyl density, and reactive oxygen species generation. In addition, CNFs and CNCs could induce maturation of bone marrow-derived dendritic cells and CNCs (and to a lesser extent CNFs) were found to exert adjuvant effects in ovalbumin (OVA)-injected mice, particularly for 210 nm and 280 nm CNCs. All considered, our data demonstrate the importance of length scale, crystallinity, and surface reactivity in shaping the innate immune response to nanocellulose.
Keywords: Cellulose nanofibril, Cellulose nanocrystal, Aspect Ratio, Crystallinity, Humoral immune effects
Graphical Abtract
1. Introduction
Commerce, industry and consumers increasingly prefer to use products produced from renewable and sustainable resources, such as cellulose. Not only does nanocellulose exhibit low environmental and health risks, but express unique physicochemical properties that can be exploited by commerce and industry.[1, 2] This is exemplified by increased interest in technology development of these materials in the paper and cardboard industry as fillers, adhesives, paints, and low-density foams, as well as for food applications, hygiene purposes, and cosmetics.[3–10] Cellulose, as a key structural component (polysaccharide) of the cell walls of plants and algae, is comprised of a linear chain of hundreds to thousands of β(1–4) linked glucose units.[11] The term nanocellulose refers to a form of cellulose that exists either as a nanocrystal or a cellulose nanofiber. Accordingly, nanocellulose can be divided into three material categories, namely: (i) cellulose nanocrystals (CNCs), also referred to as nanocrystalline cellulose or cellulose nanowhiskers, (ii) cellulose nanofibrils (CNFs), also referred to as nanofibrillated cellulose, and (iii) bacterial cellulose (BC).[2, 11]
Although cellulose is being used more frequently for healthcare purposes such as wound healing, dialysis membranes, or food additives, nanocellulose is currently in a developmental phase with no commercial applications. Little is known about its biomolecular interactions at the nano/bio interface and the characterization of the properties that determine material safety.[2, 4, 12] While nanocellulose is generally regarded as safe based on its biodegradability, we need to consider that this is a high aspect ratio (HAR) material that exhibits crystalline subunits and reactive surfaces, which could lead to the generation of adverse health effects.[2, 3] Moreover, a variety of preparation techniques (e.g., acid hydrolysis or homogenization) and post-processing modification can introduce additional physicochemical properties that could impact the nanocellulose safety profile.[11] Clift et al., have demonstrated that CNC exposures can lead to cytotoxicity and cytokine release in 3-D human airway epithelial cell cultures, while CNFs have been shown to exert cytotoxic effects in various tissue culture systems.[13–15] Endes et al., found that although CNC aerosol exposure of a human epithelial airway barrier model did not elicit significant cytotoxicity, pro-inflammatory or oxidative stress effects, longer CNCs (2244 ± 1687 nm) were cleared less effectively than shorter CNCs (168 ± 72 nm).[16, 17] Cullen et al. have observed dose-dependent recruitment of inflammatory cells to the peritoneal cavity of mice exposed to CNFs,[18] while Yanamala et al. have shown that oropharyngeal aspiration of CNCs in mice can generate oxidative stress, cytotoxicity and pro-inflammatory effects.[19] Moreover, while comparing CNFs to CNCs in transformed human lung epithelial cells, CNFs were shown to generate more cytotoxicity than CNCs, but the reverse was true for the pro-inflammatory effects of these materials.[20, 21]. However, other than comparative studies of the biological impact of cellulose nanocrystals vs. nanofibrils, comparatively few studies have attempted to explain the biological effects and hazard potential of nanocellulose in terms of aspect ratio, crystallinity and surface reactivity, physicochemical characteristics that have been shown to be of importance the adverse health effects of HAR material such as carbon nanotubes (CNTs), CeO2 nanorods, TiO2 nanobelts, and AlOOH nanorods, etc.[22–35]
While HAR nanomaterials impact a wide range of cell and tissue types, it is important to consider the influence on the cellular elements of the innate immune system, which are ubiquitously expressed as macrophages and dendritic cells in all organ systems.22–23 Moreover, phagocytic uptake in the cells has demonstrated access of HAR materials to the lysosomal compartment, where close contact with reactive material surfaces could damage the lysosomal membrane, leading to cathepsin B release and assembly of the NLRP3 inflammasome.[25, 26] This series of intracellular events can lead to pro-inflammatory and immunogenic effects in the innate immune system. While it has been shown that nanocellulose can exert TH1 immune polarizing effects in the lung, no detailed attempt has been made to elucidate the structure-activity relationships that underpin these immune effects.[36] In order to assess the effect of fiber length, crystallinity, and surface reactivity of CNFs and CNCs in the innate immune system, we acquired a panel of nine nanocellulose materials in which the characterization of these properties were used for understanding of their structure-activity relationships in macrophages and dendritic cells.
In this study, we evaluated the physicochemical properties of a panel of CNFs and CNCs, provided by the Nanomaterials Health Implications Research (NHIR) Consortium at the National Institute of Environmental Health Sciences (NIEHS), on pro-inflammatory and adjuvant effects in the immune system. This panel was supplemented by including intermediary length scales to elucidate the impact of CNC length, crystallinity and surface hydroxyl display on the NLRP3 inflammasome in macrophages and murine bone marrow-derived dendritic cells (BMDCs). These structure-activity relationships were used to assess the effects of these materials on boosting of the humoral immune response in mice, using a vaccination approach. Our integrated analysis demonstrates that the increased crystallinity and pro-oxidative effects of cellulose nanocrystals in the length scale 200 to 300 nm were associated with more robust NLRP3 inflammasome activation and pro-inflammatory effects in vitro, which could be related to immune boosting effects in vivo.
2. Results
2.1. Preparation, purification and characterization of cellulose nanomaterials of different aspect ratios
Safety assessment of CNFs and CNCs were performed on materials provided by the NHIR Consortium at the NIEHS. A schematic depicting the presence of crystalline and amorphous regions in cellulose fibers is shown in Figure 1A. The CNFs exhibited approximately the same primary length scales under transmission electron microscopy (TEM) (Table 1 and Figure 1A). In contrast, the nanocrystal received from the consortium (CNC 280 nm) had a length of 279.1 ± 116.3 nm. In order to expand the length scale of an intermediary group of nanocrystals in the size range 280 nm to 6 μm, a commercial cellulose paper product (Whatman filter paper) was hydrolyzed with sulfuric acid to generate five additional CNCs, i.e. CNC 3.6 μm, CNC 1.1 μm, CNC 210 nm, CNC 150 nm and CNC 110 nm (Figure 1A and 1B). We also obtained a CNC of 93.0 ± 45.0 nm from the University of Maine. Figure 1A shows TEM images of the CNFs and CNC obtained from the consortium, as well as a schematic to explain the use of acid hydrolysis for releasing nanocrystals from cellulose fibrils comprised of intermingled amorphous and crystalline regions. Figure 1B explains how acid hydrolysis could practically be implemented to generate a series of CNCs from a commercial cellulose paper product (Whatman filter paper), which was incubated with sulfuric acid for different lengths of time. The accompanying TEM images in the lower panel demonstrate the progressive shortening in fiber length and morphological changes of the released CNCs as a function of increased hydrolysis time. This provided a comprehensive panel of nanocellulose materials to assess the contribution of CNC length, crystallinity, and surface chemistry on biological outcome.
Figure 1. Characterization and TEM images of nanocellulose.
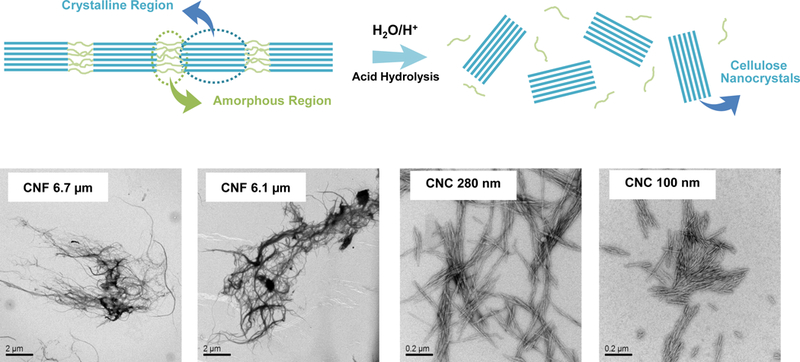
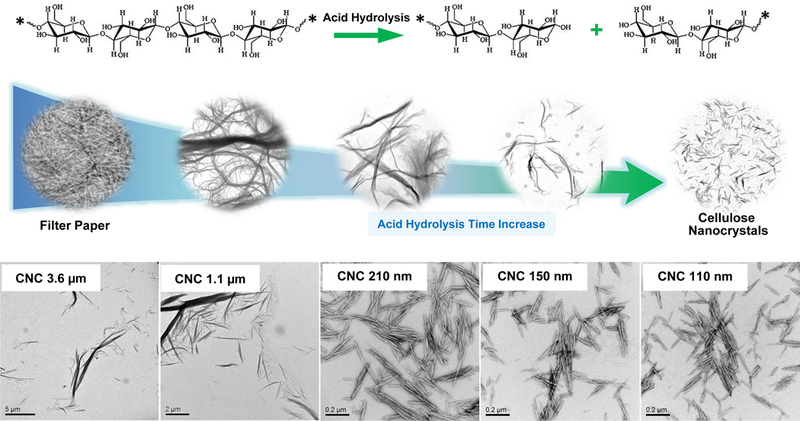
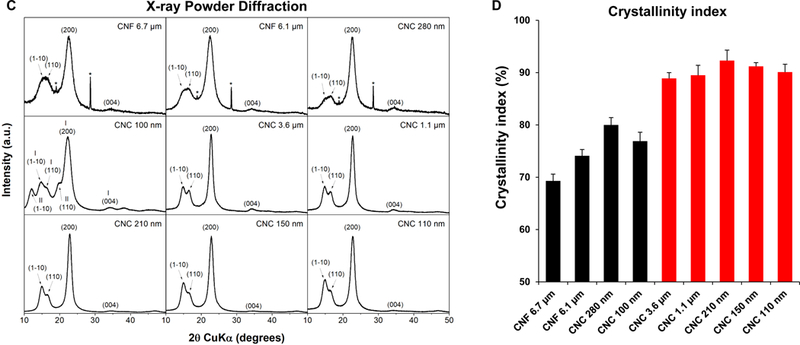
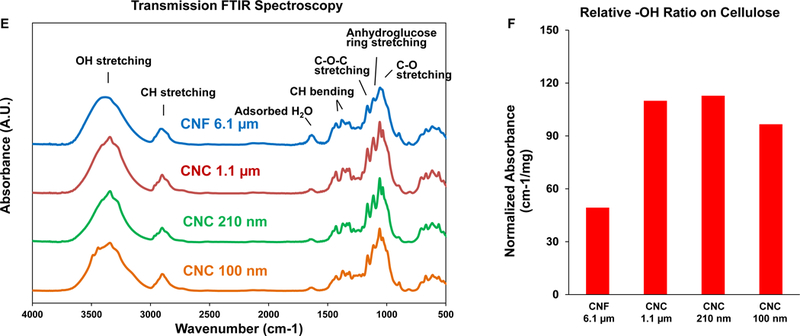
(A) Schematic to explain crystalline and amorphous nanocellulose domains, as well as enrichment of the crystalline phase by acid hydrolysis. We also show representative TEM images, obtained in a JEOL 1200 EX TEM, of consortium-provided CNF 6.1 μm, CNF 6.7 μm and CNC 280, as well as CNC 100 nm obtained from the University of Maine. (B) Schematic to show the preparation of intermediary length CNCs from Whatman #1 filter paper, using acid hydrolysis. The lower panel shows the representative TEM images, showing progressive decrease in nanocrystals length with increased hydrolysis time. (C) X-ray powder diffraction (XRD) patterns to show the changes in the crystallinity structure of nanocellulose materials with acid hydrolysis. (D) XRD-derived crystallinity indices of CNC and CNF samples from the Consortium (black) or in-house derived by acid hydrolysis (red). The crystallinity index was calculated according to the equation listed in the Experimental section. (E) Transmission FTIR spectra of CNF 6.1 μm, CNC 1.1 μm, CNC 210 nm and CNC 100 nm for quantitative assessment of surface –OH expression on nanocellulose. (F) –OH ratios on surface of selected nanocellulose materials calculated according to the equation listed in the Experimental section.
Table 1.
Primary diameter, length aspect ratio and source of cellulose nanofibrils and nanocrystals.
| Sample | Diameter (nm) | Length (nm) * | Aspect Ratio | Source |
|---|---|---|---|---|
| CNF 6.7 μm | 38.7 ± 33.4 | 6.7×10³ ± 3.2×10³ | 158.9 ± 95.8 | Consortium |
| CNF 6.1 μm | 72.6 ± 63.6 | 6.1×10³±2.7×10³ | 83.9 ± 37.6 | Consortium |
| CNC 280 nm | 22.4 ± 7.2 | 279.1 ± 116.3 | 12.5 ± 5.2 | Consortium |
| CNC 100 nm | 15.4 ± 4.3 | 93.1 ± 45.0 | 6.0 ± 2.9 | Maine |
| CNC 3.6 μm | 23.8 ± 29.2 | 3.6×10³±4.1×10³ | 151.8 ± 171.7 | Acid hydrolysis |
| CNC 1.1 μm | 23.3 ± 21.8 | 1.1×10³± 1.0×10³ | 49.4 ± 44.7 | Acid hydrolysis |
| CNC 210 nm | 18.6 ± 5.7 | 210.9 ± 164.5 | 11.4 ± 8.9 | Acid hydrolysis |
| CNC 150 nm | 18.2 ± 5.1 | 153.4 ± 59.5 | 8.4 ± 3.3 | Acid hydrolysis |
| CNC 110 nm | 17.8 ± 5.8 | 112.4 ± 53.2 | 6.3 ± 3.0 | Acid hydrolysis |
P<0.001 between groups analyzed by ANOVA.
Physicochemical characterization to assess primary particle size, hydrodynamic size and zeta potential in water as well as in tissue culture medium (RPMI 1640) was carried out prior to biological experimentation (Tables 1 and 2). Assessment of hydrodynamic size by dynamic light scattering (DLS) in DI H2O, confirmed the acquisition of a panel of materials with length scales ranging from 104.4 ± 2.5 to 36,188.5 ± 16,818.8 nm (Table 2). The hydrodynamic size range closely matches the primary material size range (Table 2). Table 1 also shows material aspect ratio (length vs. diameter). All the nanocellulose materials showed negative zeta potentials, varying from −28.4 to −58.5 mV. In accordance with acid hydrolysis being able to remove amorphous (non-crystalline) cellulose domains, the progressive shortening of CNC size was accompanied by an incremental increase in the crystallinity index, as determined by X-ray diffraction (XRD) (Figure 1C). This demonstrated a crystallinity index of 88.9–92.3 % for CNCs compared to 69.3% for CNFs or 80% for CNC 280 (Figure 1D). Since the change in crystallinity is also accompanied by differences in the display of hydroxyl groups on the glucose backbone in nanocellulose, FTIR was used to assess the hydroxyl density of CNF 6.1 μm, CNC 1.1 μm, CNC 210 nm and CNC 210 nm (Figure 1E). Please note that only 4 materials were chosen for this analysis because of the abundant material requirements required to execute the procedure. FTIR analysis demonstrated that the acid-hydrolyzed CNC 210 nm had the highest hydroxyl density on the particle surface, with CNF 6.1 μm exhibiting the lowest density display (Figure 1F). Inductively coupled plasma optical emission spectrometry (ICP-OES) was used to rule out the presence of metal impurities (e.g., Cu, Fe, Ni, Si, Ti, Zn etc.), alkaline minerals or salts (e.g., Na, Mg, K, Ca etc.) (Table S1). To ensure that the prepared materials are free of endotoxin contamination for biological experimentation, the entire panel was tested in an Amebocyte Lysate Assay, which demonstrated endotoxin levels < 1 EU/mL across the board (Figure S1, Supporting Information).
Table 2.
Hydrodynamic size and zeta potential of cellulose nanofibrils and nanocrystals.
| Sample | Hydrodynamic Size (nm) in DI H2O |
ζ-potential (mV) in DI H2O |
Hydrodynamic Size (nm) in RPMI |
ζ-potential (mV) in RPMI |
|---|---|---|---|---|
| CNF 6.7 μm | 36.2×10³ ± 16.8×10³ | −30.9 ±0.2 | 46.4×10³ ± 12.6×10³ | −13.4 ± 1.0 |
| CNF 6.1 μm | 24.1×10³ ± 4.2×10³ | −28.4 ± 0.7 | 21.2×10³ ± 10.9×10³ | −11.4 ±1.3 |
| CNC 280 nm | 1.5×10³ ± 446.7 | −31.5 ± 0.6 | 797.4 ± 413.5 | −15.9 ± 2.8 |
| CNC 100 nm | 104.4 ± 2.5 | −47.3 ± 2.2 | 309.2 ± 10.8 | −14.2 ± 1.8 |
| CNC 3.6 μm | 1.9×10³ ± 97.3 | −33.5 ± 1.8 | 5.0×10³ ± 1.8×10³ | −11.8 ± 3.6 |
| CNC 1.1 μm | 715.3 ± 72.7 | −42.5 ± 1.5 | 1.3×10³ ± 116.4 | −10.1 ± 2.5 |
| CNC 210 nm | 209.3 ± 3.3 | −50.5 ± 1.6 | 711.3 ± 80.5 | −14.7 ± 2.5 |
| CNC 150 nm | 175.4 ±2.2 | −58.5 ± 4.8 | 593.8 ± 76.5 | −11.5 ± 1.0 |
| CNC 110 nm | 108.6 ±0.5 | −50.1 ± 2.7 | 262.8 ± 53.7 | −14.3 ± 1.3 |
2.2. Nanocellulose length and aspect ratio impact the activity of the NLRP3 inflammasome
Prior to assessing cellular uptake and impact on the NLRP3 inflammasome, cell viability was assessed on the nanocellulose materials in the human myeloid cell line, THP-1 (Figure 2). THP-1 exposure to the phorbol ester, PMA, induces their differentiation into a macrophage-like phenotype, which provides a convenient in vitro test strategy to quantitatively assess the effect of HAR materials (e.g., carbon nanotubes, CeO2 nanorods and TiO2 nanobelts) on the NLRP3 inflammasome.[24–27, 29, 37] In contrast to the cytotoxic effects of ZnO nanoparticles (positive control), exposure to CNFs and CNCs failed to show any effect on cell viability, using MTS (Figure 2A) as well as ATP (Figure 2B) assays. We also conducted a test for cytotoxicity using the supernatants from the nanocellulose suspensions. No cytotoxic or immunogenic effects were observed for these supernatants (data not shown). In order to assess the cellular uptake and subcellular localization of the nanocellulose materials (not viewable by TEM), it was necessary to use CNC and CNF fluorescence labeling. This was accomplished by covalent attachment of fluorescein isothiocyanate (FITC) to the carbon backbone, using amination and conjugation chemistry, as explained in Figure 3A.[38] THP-1 cells were incubated with the FITC-labeled materials for 6 hr to follow cellular uptake. This demonstrated length-dependent cellular processing, with CNC 210 and CNC 280 nm showing demonstrable higher uptake than CNC 110 nm or CNF 6.1 μm (Figure 3B and Figure S2). Confocal microscopy was then used to determine the intracellular localization of the labeled materials in relation to the lysosomal compartment, identified by LAMP-1 staining (Figure 3C). The quantitative expression of the fluorescence overlap of FITC-labeled nanocellulose materials with the LAMP-1 liposomes, using ImageJ analysis, demonstrated that minimally 60% of the phagocytosed nanocellulose fibrils or crystals enter the lysosomal compartment (Figure 3D). Moreover, inter-material comparisons demonstrated a higher frequency of CNC 210 and CNC 280 nm co-localization with lysosomes compared to other length scales (Figure 3D).
Figure 2. Cellular viability assessment in THP-1 cells exposed to cellulose nanofibrils and nanocrystals.
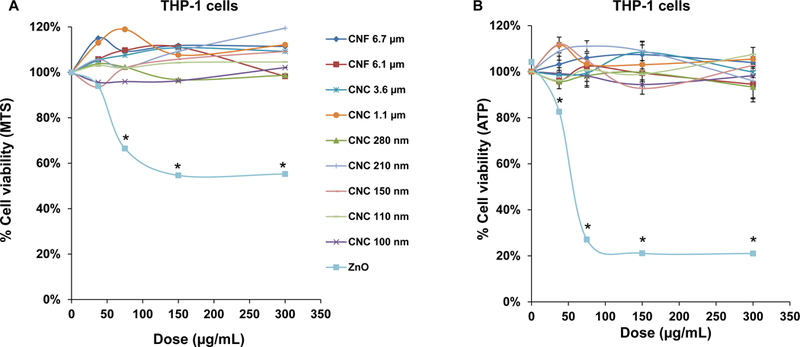
(A) Use of a MTS assay in THP-1 cells, grown in 96-well plates before exposure to 37.5, 75, 150, and 300 μg/mL of each of the nanocellulose materials. The culture medium was replaced after 24 h with 120 μL aliquots of the MTS working solution. After incubation for 0.5 h, the plates were centrifuged to collect supernatants that were used for assessment of absorbance at 490 nm in a SpectroMax M5e microplate reader. All the MTS values were normalized vs. non-treated controls representing 100% cell viability. (B) Use of an ATP assay to assess the cell viability of THP-1 cells, using the same protocol as in (A). *p < 0.05 compared to control.
Figure 3. Cellular uptake and subcellular localization of nanocellulose in THP-1 cells.

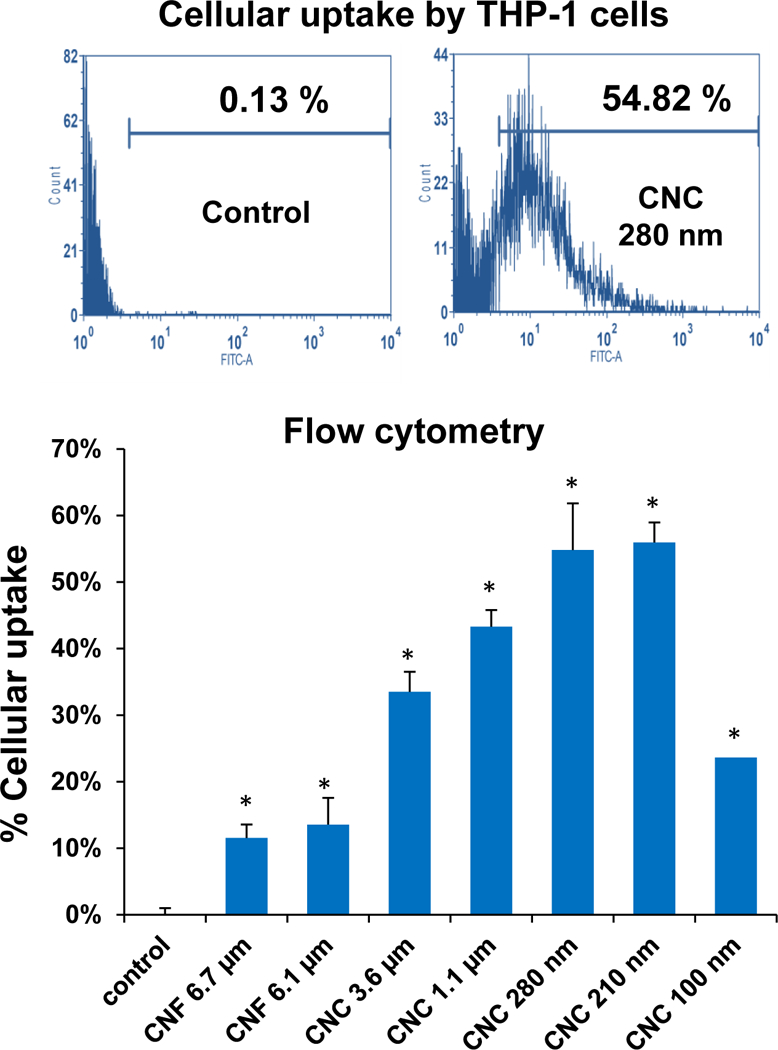
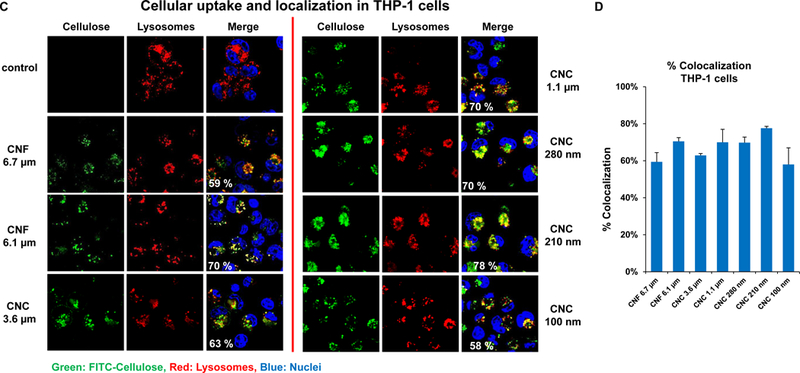
(A) Schematic representation of the synthetic chemistry used to obtain FITC-labeled nanocellulose. (B) Flow cytometry analysis (FACS Calibur, BD Biosciences) to determine CNF and CNC uptake in THP-1 cells, which were exposed to the FITC-labeled materials at 300 μg/mL for 6 h; * p <0.05 compared to control. (C) Confocal microscopy to follow the intracellular localization of FITC-labeled nanocelluloses at 300 μg/mL in relationship to LAMP-1 (lysosomal compartment) and Hoechst 33342 (nucleus). THP-1 cells were collected after 6 h, fixed, permeabilized, and stained with Alexa 488-labeled LAMP-1 antibody and Hoechst 33342. Following image acquisition with a Confocal SP8-SMD microscope, the percent particle co-localization with LAMP-1 was quantified by Image J software (D). Non-treated cells were used as a control.
The uptake of HAR materials with reactive surfaces (such as CNTs) in lysosomes is capable of damaging the organellar membrane.[26, 29, 30] Lysosomal damage can be followed by confocal microscopy, showing the release of cathepsin B from the organelle to the cytoplasm (Figure 4A). Cathepsin B can be detected by a fluorescent substrate, Magic Red, which yields a punctate red staining in intact lysosomes of non-treated cells (Figure 4B). However, exposure of THP-1 cells to a positive control HAR material, monosodium urate (MSU) crystals, could be shown to induce cathepsin B release from lysosomes, leading to diffuse Magic Red fluorescence in the cytoplasm (Figure 4B). Noteworthy, almost the entire panel of nanocellulose materials, with the exception of CNC 100 nm, could be shown to induce cathepsin B release from damaged lysosomes (Figure 4B).
Figure 4. NLRP3 inflammasome activation and IL-1β release as a result of lysosomal injury in THP-1 cells.
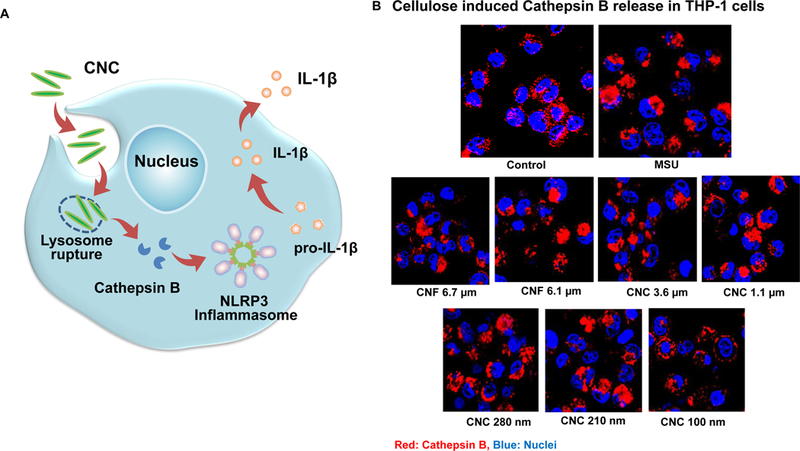
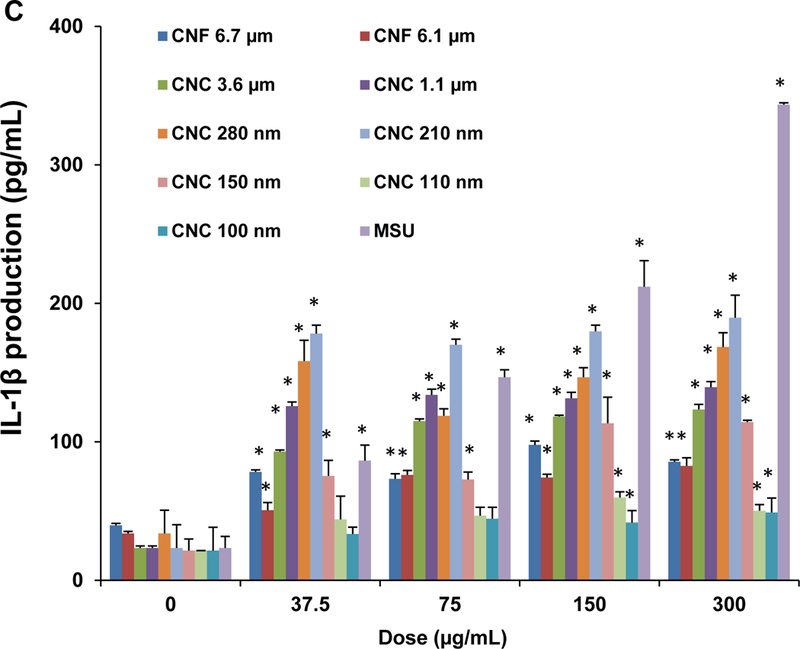
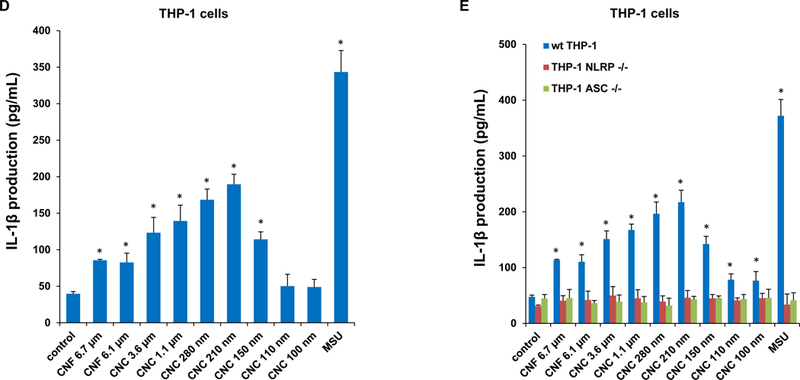
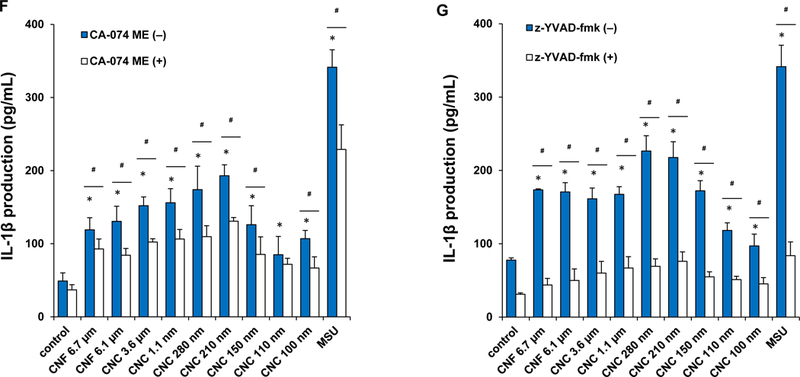
(A) Schematic representation to demonstrate how injury to the lysosomal membrane by nanocellulose materials could induce cathepsin B release, and NLRP3 inflammasome activation. (B) Confocal microscopy demonstrating the effects of nanocellulose on cathepsin B release in THP-1 cells. Cathepsin B release from damaged lysosomes was identified by Magic Red staining. THP-1 cells were incubated with 300 μg/mL nanocellulose for 24 h. After fixation and permeabilization, cells were stained with Magic Red (ImmunoChemistry Technologies) and Hoechst 33342 dye, followed by visualization under a confocal 1P/FCS inverted microscope. MSU crystals at 100 μg/mL were used as a positive HAR control material that induces lysosomal damage. This leads to diffuse intracellular release of the red fluorescent dye compared to the punctate staining pattern of intact lysosomes in control cells. (C) Dose-dependent IL-1β production in THP-1 cells exposed to nanocelluloses. THP-1 cells were exposed to 37.5, 75, 150, and 300 μg/mL of each of the cellulose suspensions for 24 h. IL-1β levels were determined in the supernatants collected by ELISA. *p < 0.05 compared to control. (D) Assessment of IL-1β production by nanocelluloses at 300 μg/mL using ELISA in the supernatants of the cells shown in Figure 4C. (E) The involvement of the NLRP3 inflammasome was confirmed by using NLRP3 deficient (NLRP3−/−) and ASC deficient (ASC−/−) THP-1 cells. (E) The cathepsin B inhibitor, CA-074 methyl ester, and (F) the caspase 1 inhibitor, z-YVAD-fmk, were used to confirm the involvement of cathepsin B and caspase-1 in nanocellulose-triggered inflammasome activation. *p<0.05 compared to the response in THP-1 cells in the absence of the inhibitors; # p < 0.05 for pairwise comparisons as shown.
Since cathepsin B release acts as a stimulus for the assembly of NLRP3 inflammasome subunits, we assessed the effect of one of a structural component, caspase 1, on IL-1β release from pro-IL-1β in THP-1 cells (Figure 4C). This requires the differentiated THP-1 cells to be primed with a low dose of LPS (10 ng/mL) to induce NF-κB activation and pro-IL-1β expression. An IL-1β ELISA was used to demonstrate that most of CNFs and CNCs (with the exception of CNC 100 nm) could induce cytokine release to the cellular supernatant in a dose-dependent manner (Figure 4C). MSU served as a positive control. Moreover, the response was dependent on the length of the materials, with the 210 and 280 nm CNCs capable of inducing significantly higher levels of IL-1β compared to longer CNFs or shorter CNCs (Figure 4D). As further confirmation for the involvement of the NLRP3 inflammasome, we demonstrated that IL-1β release is significantly suppressed in NLRP3-deficient (defNLRP3) or ASC-deficient (defASC) THP-1 cells, derived by gene knockdown (Figure 4E). We also confirmed the importance of cathepsin B release in activating the inflammasome by showing suppression of IL-1β production by a cathepsin B inhibitor, CA-074-methyl ester (Figure 4F). Likewise, we demonstrated that the caspase 1 inhibitor, z-YVAD-fmk, could decrease IL-1β production (Figure 4G). All considered, these results show excellent correlation between the cellular uptake, lysosomal processing, organellar damage, cathepsin B release, NLRP3 inflammasome activation and IL-1β release in response to the 210 and 280 nm CNCs, compared to less robust activity of other length scales.
2.3. Crystallinity plays an important role in nanocellulose-induced reactive oxygen species (ROS) generation and oxidative stress.
Nanomaterial crystallinity and the display of reactive surface groups (e.g., hydroxyls) are additional physicochemical parameters that should be considered for investigating damage to the lysosomal membrane.[23, 39–43] An abiotic assay was used to spectrophotometrically determine the change in the fluorescence activity of 2’, 7’-dichlorofluorescein (DCF), which reflects the intrinsic capability of nanomaterials to induce ROS generation. This demonstrated a significant increase in DCF fluorescence intensity by all CNFs and CNCs compared to control, with the highest response being ascribed to the 210 nm CNCs (Figure 5A). In order to assess the effect on cellular redox equilibrium, changes in THP-1 glutathione (GSH) levels was assessed in a GSH-Glo assay. This demonstrated that the 210 nm CNCs showed the most pronounced effects under biological conditions (Figure 5B and Figure S3). This is in good agreement with the results on NLRP3 inflammasome activation and IL-1β production in THP-1 cells. All considered, these results show that the variation of the surface hydroxyl content and surface reactivity as a function of the crystallinity of the material determines the lysosomal damage.
Figure 5. Abiotic ROS generation and cellular glutathione (GSH) depletion induced by nanocellulose.
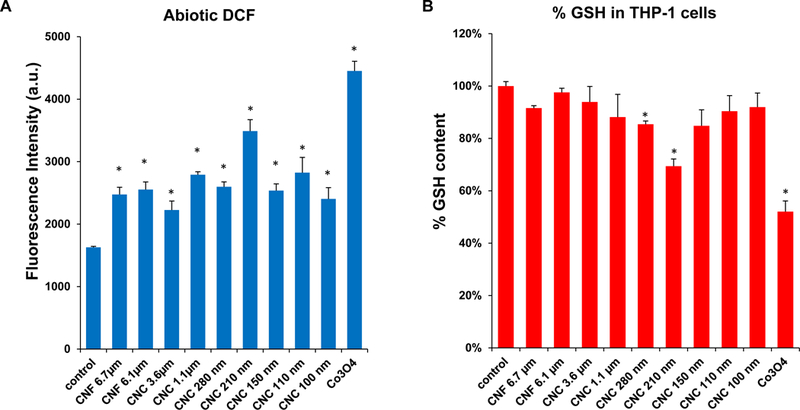
(A) Abiotic assessment of ROS generation, as determined in a DCF assay. 29 μmol/L DCF was incubated with each of the nanocellulose materials at 300 μg/mL for 6 h. Fluorescence emission was collected with excitation at 490 nm. A redox-active Co3O4 nanoparticle was used as a positive control. (B) Cellular GSH depletion in THP-1 cells was conducted by using luminescence-based GSH-Glo assay. THP-1 cells were exposed to 300 μg/mL of nanocellulose materials for 6 h. Co3O4 nanoparticle was used as a positive control. GSH levels were expressed as a percentage of the luminescence intensity compared to control cells. * p < 0.05, compared to control.
2.4. Nanocellulose materials impact IL-1β production and maturation in bone marrow derived dendritic cells (BMDCs)
To assess the relevance of the cellular effects in primary phagocytic cells, bone marrow-derived dendritic cells (BMDCs) were prepared from the femurs of C57BL/6 mice (Figure 6A). Dendritic cells (DCs) are professional antigen presenting cells (APCs) that are key to the induction of cognitive immune responses in vivo. First, we assessed the cytotoxic potential of the nanocellulose materials, demonstrating that neither the CNFs nor the CNCs exert significant toxic effects on BMDCs (Figure S4). In order to determine how that may relate to DC function, including their maturation status as APC, we assessed major histocompatibility complex class II (MHC-II) and costimulatory receptor (CD40 and CD86) expression on CD11c+ cells, using a flow cytometry approach (Figure 6B–D). While all the CNFs and CNCs were capable of inducing MHC-II expression, the effects of the 210 and 280 nm CNCs were significantly accentuated compared to most of materials except the 1.1 μm CNC (Figure 6B). The vaccine adjuvant, alum, was used as a positive control in these experiments. More pronounced effects on CD40 and CD86 expression were observed with 280 nm CNCs (Figure 6C and D). Similar to THP-1 cells, all the nanocellulose materials were capable of inducing IL-1β production in BMDCs (Figure 6E). However, in contrast to THP-1 cells, there were no statistical differences between CNFs and CNCs (Figure 6E). Taken together, these results demonstrate that CNFs and CNCs are capable of inducing BMDC maturation and IL-1β production.
Figure 6. Assessment of the maturation and IL-1β production in mouse bone marrow-derived dendritic cell (BMDC) in response to nanocellulose exposure.
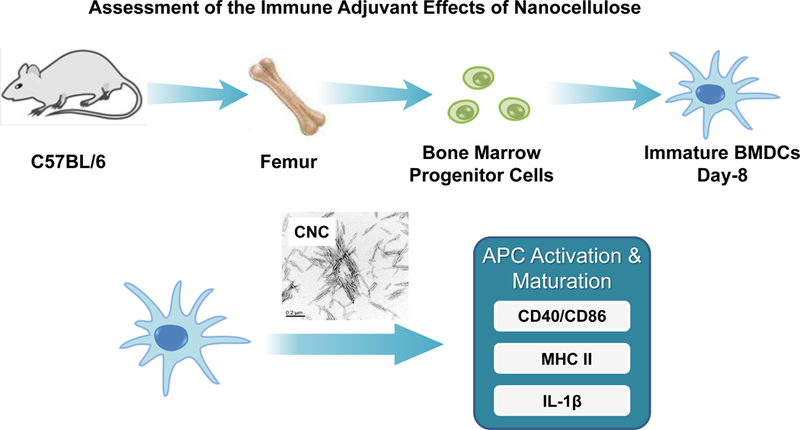
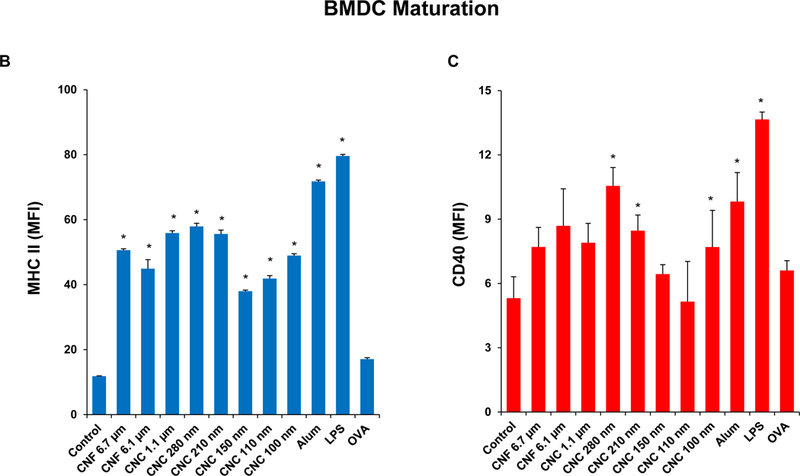
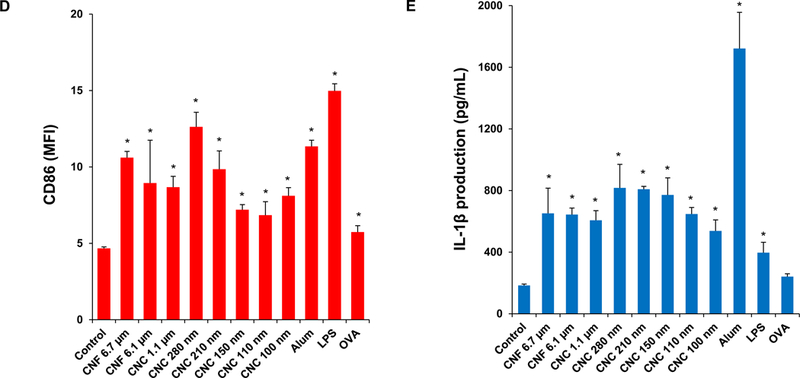
(A) Schematic to explain the assessment of the immunostimulatory effects of nanocellulose materials in BMDC, in vitro and in vivo. Flow cytometry was used to determine the surface membrane expression of (B) MHC-II, (C) CD40 and (D) CD86, on CD11c+ cells, following exposure to 300 μg/mL nanocellulose materials for 16 h. (E) IL-1β production (ELISA) in response to the exposure to 300 μg/mL of each of the nanocellulose materials for 16 h. *p < 0.05 compared to control.
2.5. Nanocellulose can be used as an adjuvant to boosting ovalbumin (OVA)-specific IgG production in mice
Based on the effects of CNCs and CNFs on cellular elements of the innate immune system, we asked whether these materials exert adjuvant effects that could be tested by a vaccination strategy in mice. Endotoxin-free OVA was injected into the peritoneum of C57BL/6 mice to assess the humoral immune response to this antigen in the absence or presence of the co-injected nanocellulose materials. Serum collection two weeks after intra-peritoneal injection, demonstrated that all the CNFs and CNCs were capable of boosting the anti-OVA IgG response to a significant degree (Figure 7A). The response to the 210 nm CNCs was the highest. In contrast, there was no significant effect on the IgE antibody response to OVA (Figure 7B).
Figure 7. Adjuvant effect of nanocelluloses on anti-OVA humoral immunity in mice.
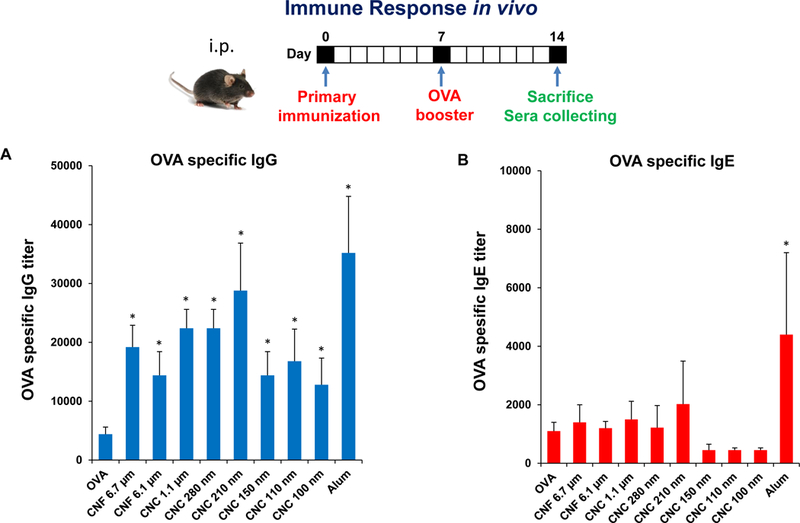
Balb/c mice were treated with OVA or OVA/cellulose by intraperitoneal injection on day 0, followed by an OVA boost on day 7 and animal sacrifice on day 14. Blood was collected for the determination of serum (A) IgG and (B) IgE titers to OVA, using an ELISA procedure.
3. Discussion
In this communication, a panel of cellulose nanofibrils (CNFs) and cellulose nanocrystals (CNCs) was used to determine the effect of material size, aspect ratio, crystallinity, and surface reactivity in THP-1 macrophages and bone marrow-derived dendritic cells (BMDCs). We also used acid hydrolysis to increase the number of CNC length scales to be compared. While all CNFs and CNCs were devoid of cytotoxic effects in THP-1 cells, confocal microscopy and flow cytometry demonstrated length-dependent uptake of FITC-labeled materials, showing more abundant uptake of the 210 and 280 nm CNCs into the lysosomal compartment, compared to longer and shorter CNF crystals. The subcellular association was associated with the increased propensity of CNCs in the 200–300 nm length scale to induce lysosomal damage, cathepsin B release, NLRP3 inflammasome activation and IL-1β production. Lesser effects were seen for CNFs. The higher crystallinity index, surface hydroxyl display, ROS generation and pro-oxidant potential of the 210 and 280 nm CNCs, provided by different preparation methods, correlate well with their propensity to enhance inflammatory responses. While there were less pronounced CNF and CNC differences in BMDCs, exposure to nanocellulose was associated with increased DC maturation. In addition, CNCs and to a lesser extent CNFs boosted the anti-OVA immune response in a murine immunization model. The more robust IgG responses were obtained with the 210 nm, 280 nm and 1.1 μm CNCs. In summary, these results show that the crystallinity and surface reactivity of nanocellulose could at least partially explain the strong pro-inflammatory and pro-immunogenic effects in vitro and in vivo of CNCs in the 200–300 nm length scale.
We used the acquisition and characterization of a panel of CNFs and CNCs to establish new structure–activity relationships for nanocellulose aspect ratio, crystallinity, and hydroxyl content in macrophages and dendritic cells. Our results demonstrate that aspect ratio and length play determinant roles in cellular uptake and lysosomal localization in THP-1 (Figure 3). This was accomplished by using FITC-labeled materials to show that 210 nm and 280 nm CNCs are taken up in lysosomes in higher abundance than longer or shorter CNCs and CNFs. This is in keeping with experimental studies and in silico modeling, demonstrating that phagocytic processing of HAR nanomaterials by macrophages is dependent on material shape, length, aspect ratio, and contact angle.[44–47] Interestingly, the phagocytic uptake and immune adjuvant effects of aluminum oxyhydroxide (AlOOH) nanorods were also more pronounced for materials in the 200–300 nm length scale, similar to the CNCs.[22, 23] Moreover, similar to ALOOH, the pro-inflammatory and immunogenic effects of nanocellulose were affected by the surface hydroxyl display on CNCs and CNFs.[22, 23] The surface properties are associated with ROS generation, as demonstrated by the abiotic DCF assay (Figure 5A). It is also possible that the ROS generation could result from lysosome damage, e.g., the release of free Fe2+ triggering a Fenton reaction and/or perturbation of mitochondrial electron transfer. The notion that oxidative stress plays a role in the biological outcome in macrophages was substantiated by GSH depletion (Figure 5B). These results are compatible with the findings of Shvedova et al., who demonstrated that the ROS generation and GSH depletion is involved in the oxidative damage, and pro-inflammatory effects of CNCs in A549 cells.[20]
The lysosome appears to be an important intracellular target for the pro-inflammatory effects of CNFs and CNCs, similar to what we have observed for HAR materials with reactive surfaces, such as carbon nanotubes and AlOOH.[22, 23, 28, 29] Lysosome damage leads to cathepsin B release, NLRP3 inflammasome activation and IL-1β production, which plays an important role in the pro-fibrogenic effects of carbon nanotubes in the lung as well as the adjuvant effects of AlOOH in the immune system.[22, 23, 28, 29, 48] In addition to confirming the involvement of the NLRP3 inflammasome in THP-1 cells, we demonstrated a robust effect of CNCs and CNFs on BMDC maturation and IL-1β production, allowing us to confirm in an animal vaccination experiment that nanocellulose materials can boost the IgG response to OVA in a mouse model (Figures 6 and 7). In fact, the response to the 210 nm CNC was as robust as the effect of alum. These results confirm the narrow divide between nanomaterial properties that can determine hazardous vs. advantageous use outcomes. The demonstration of the possible use of nanocellulose as a vaccine adjuvant is a novel discovery.[9, 10, 12]
How do these data contribute to our knowledge of nanocellulose safety? While currently there are no published data revealing a safety concern for nanocellulose in the workplace or in consumer products, experimental evidence has been collected for the potential hazardous effects of CNCs and CNFs.[3, 13–15, 18–21, 36, 49, 50] While most cellular studies have addressed cytotoxicity, inflammation and genotoxicity, which can be related to differences in the cellular uptake of CNCs vs. CNFs or their ability to generate oxidative stress[13–15, 20, 21], most in vivo studies have focused on the effects in the lung and the reproductive system.[18–20, 36, 49, 50] For instance, pulmonary exposure to CNCs is capable of generating dose-dependent pro-inflammatory effects and oxidative stress, while CNFs are capable of inducing TH1 polarizing effects in the lung.[20, 36] Moreover, pulmonary CNC exposure can exert systemic effects, e.g., influencing sperm counts, mobility, and DNA strand breaks in the male reproductive system.[49, 50] We significantly extend these observations by providing structure-activity relationships, demonstrating the importance of crystallinity, length, and surface hydroxyl density as important material characteristics that underpin pro-inflammatory and immunogenic effects in the innate immune system. Moreover, we demonstrate that this information can be used to develop new nanocellulose adjuvants for boosting the immune system.
4. Conclusion
In this paper, we demonstrate the use of a panel of CNFs and CNCs with defined size, crystallinity, and hydroxyl content for mechanistic discovery in macrophages and dendritic cells. This information was used to better understand nanocellulose interactions with innate immune system, where the ability to perturb macrophage and DC function could be used to boost the innate immune response in intact animals. Our data show that in the 200–300 nm length range, CNCs display the optimum crystalline and surface reactive properties for induction of oxidative stress, lysosomal damage, NLRP3 inflammasome activation, and IL-1β production. These structure-activity relationships are useful for implementing hazard screening of nanocellulose, as well as use of these materials to develop new vaccine adjuvants.
5. Experimental Section
Acquisition and Synthesis of Cellulose Samples:
Two CNFs and one CNC were obtained from The National Institute of Environmental Health Sciences (NIEHS) Nanomaterials Health Implications Research (NHIR) Consortium, while another CNF was purchased from the Process Development Center at University of Maine. Acid hydrolysis of Whatman No. 1 filter paper was used to expand the range of CNC length scales.[51] The Whatman filter paper was cut into 1 × 1 cm squares before use. The hydrolysis procedure was performed at 45 °C, using a fixed ratio of the filter paper to 64% (w/v) sulfuric acid at 1:8.75 (g/mL) for time periods ranging from 10 min to 16 hrs. Following hydrolysis, the pH of the final suspension was brought to pH 7.0, without further treatment.
Physicochemical Characterizations of Cellulose Library:
Stock suspensions of CNFs and CNCs were prepared at 5 mg/mL in deionized water by vortexing and bath sonication for 15 mins in a water bath sonicator (Branson 2510), using 100 W output power and 42 kHz frequency. These samples were further diluted to 50 μg/mL and sonicated in deionized water or RPMI cell culture medium, supplemented with 10% FBS.[52] These suspensions were used for the physicochemical characterization to determine primary diameter, length, and aspect ratio, using transmission electron microscopy (TEM, JEOL 1200 EX) at an accelerating voltage of 80 kV. The samples were negatively stained with 2 wt % uranyl acetate solution prior to TEM viewing. TEM analysis was performed by placing a drop of the suspension in DI water at 50 μg/mL on a 400 mesh Cu TEM grid, followed by evaporation at room temperature. The hydrodynamic size and surface charge of the CNFs and CNCs at 50 μg/mL were assessed in a ZetaPALS (Brookhaven Instruments) particle sizer and zeta potential analyzer in deionized water or RPMI medium. The zeta potential was derived using the Helmholtz-Smoluchowski equation based on the measurements of the electrophoretic mobility of nanocellulose. Fourier transform infrared (FTIR) spectra were obtained by FTIR spectrometer (JASCO FTIR-420) using a KBr (FTIR grade, Sigma) pelleting technique. The OH spectra on selected nanocellulose surfaces was calculated according to the following equation:[53]
where m is weight (mg) of cellulose and AOH is area (cm−1) under the curve of the OH stretch band ~3350 cm−1). For XRD analysis, the stock solution was vortexed for 15 secs, and then 0.5 mL of the suspension was placed on the zero background substrates. Measurement was performed on dry sample and XRD spectra were recorded using a Panalytical X’Pert Pro diffractometer (Cu Kα radiation) with a step size of 0.02° and a counting time of 0.5 s per step over a range of 10°−50° 2θ. The crystallinity index (CI) of cellulose was calculated by the equation:[54]
where I200 is the peak intensity from the (200) lattice plane (2θ=22.5°) and IAM is the peak intensity of the amorphous phase (2θ=19.0°).
Impurity Analysis:
Inductively coupled plasma optical emission spectrometry (ICP-OES, ICPE-9000, Shimadzu, Japan) analysis was performed to detect the trace amount of impurities in the nanocellulose samples. The freeze-dried cellulose was digested with 3 mL of a concentrated HNO3 (65–70%, Trace Metal Grade, Fisher Scientific) with supplement of 1 mL of H2O2 (30%, Certified ACS, Fisher Scientific) at 180 °C for 3 h in a Teflon-lined stainless steel autoclave. These extracts were diluted with 2 % (v/v) nitric acid to reach a final volume of 8 mL for analysis. There was no impurity present in the nanocellulose samples by ICP-OES analysis.
Cell Culture:
Human THP-1 cells were grown in RPMI-1640 media supplemented with 10% fetal bovine serum (FBS), 100 U/100 μg per mL of penicillin-streptomycin and 50 μM beta-mercaptoethanol. NLRP3-deficient (defNLRP3) and ASC deficient (defASC) THP-1 cells (InvivoGen, San Diego, CA) were grown in RPMI-1640 media, supplemented with 10% (v/v) FBS, 200 μg/mL HygroGold, and 100 μg/mL Normocin. BMDCs were prepared from the bone marrow of female C57BL/6 mice, using a protocol described by Williams et al.[55] Briefly, bone marrow precursor cells were collected from the femurs and tibiae of female C57BL/6 mice and cultured in RPMI-1640 containing 10% (v/v) FBS, 10 μg/mL of gentamicin, 250 ng/mL amphotericin B, 50 μM β-ME, 20 mM HEPES and 2 mM L-glutamine. Cells were grown in a volume of 4 mL in a 6-well plate at 5 × 10⁵ cells/well. The culture media was replenished with 25 ng/mL GM-CSF on day 1. Two days later, the cells were treated with a combination of 20 ng/mL of GM-CSF and 10 ng/mL of IL-4, and the medium was replenished every other day. The immature BMDCs were collected on day 8 and washed with PBS before use.
Dosimetry planning:
In the absence of realistic exposure data, the in vitro experimentation was carried out using a mass-dose range of materials ranging from 37.5 to 300 μg/mL to assess cytotoxicity and IL-1β production. Because none of the nanocellulose materials showed evidence of cytotoxicity, additional parameters were assessed at the higher non-cytotoxic dose range, making it easier to compare material categories for performance characteristics such as oxidative stress, etc.
Cytotoxicity Assessment:
The cellulose stock suspensions were first prepared in DI H2O at 5 mg/mL. THP-1 cells were obtained from ATCC (Manassas, VA). The cells were pretreated with 1 μg/mL phorbol 12-myristate acetate (PMA) overnight and primed with 10 ng/mL lipopolysaccharide (LPS). Aliquots of 3 × 10⁴ primed cells were cultured in 0.1 mL medium with cellulose nanoparticles in 96-well plates (Costar, Corning, NY, USA) at 37 °C for 24 h. In order to provide well-suspended nanoparticles in biological media, all the cellulose suspensions were freshly prepared by adding a desired amount of the stock suspensions to RPMI 1640 media at 37.5–300 μg/mL in the presence of 10 % fetal bovine serum (FBS). After 24 h of culture, the supernatants were collected for the measurement of IL-1β (BD Biosciences, San Diego, CA) using an ELISA kit according to manufacturer’s instructions. The cytokine concentration was expressed in pg/mL. The remaining cells were treated with 120 μL culture medium containing 16.7% MTS (CellTiter 96 Aqueous, Promega Corp) stock solution for 0.5 h at 37 °C in a humidified 5 % CO2 incubator. The plates were centrifuged at 2000 g for 10 min in a NI Eppendorf 5430 with a microplate rotor to pellet the cell debris. Eighty five μL aliquots of the supernatants were transferred to fresh 96 multiwell plates. Formazan absorbance was read at 490 nm on a SpectraMax M5 microplate reader (Molecular Devices Corp., Sunnyvale, CA, USA).
Use of flow cytometry to quantify nanoparticle cellular uptake:
Fluorescein isothiocyanate (FITC) labeled cellulose was synthesized using a published protocol.[38] First, 4.5 mL of the CNC suspension (containing 50 mg of material) was transferred into a glass flask, followed by the addition of 500 μL of a 10 M NaOH solution while stirring. Eighty μL of epichlorohydrin (AR, Sigma) was added to the mixture and the temperature was increased to 60 °C for 1.5 h. The mixture was cooled and centrifuged. The epoxy-activated CNC pellet was dispersed in 5 mL of DI water and the suspension transferred into a glass flask. Amination of the CNC was carried out by adding 250 μL of an ammonium hydroxide solution (NH4OH, 28–30 wt%, Sigma), while stirring at 60 °C for 3 h. The mixture was cooled down and centrifuged to obtain the aminated CNC (CNC-NH2) for conjugation to FITC. The labeling of CNC-NH2 was carried out in 0.08 M of sodium borate buffer (pH 8.3). 50 mg of CNC-NH2 was suspended in 5 mL buffer and transferred to a wrapped glass vial. While stirring, 16.8 mg FITC (90%, Acros) was added to the suspension and the reaction was carried out at RT overnight. The mixture was purified by centrifugation, and the FITC-labeled CNC was stored at 4 °C for further use. For the performance of flow cytometry, 2 mL of THP-1 cells was plated at a density of 4 × 10⁵ per well in a 12-well plate in the presence of 1 μg/mL PMA for 16 h. The medium was replenished, and the differentiated THP-1 cells exposed to cellulose nanoparticles in the presence of LPS (10 ng/mL) for 6 h. Cells were washed and resuspended in PBS for flow cytometry analysis, in a FACScan flow cytometer (Becton Dickinson). The data were analyzed by FlowJo software (Ashland, OR).
Confocal microscopy to assess lysosomal damage through cathepsin B release:
Differentiated THP-1 cells were exposed to cellulose nanoparticles (300 μg/mL) for 6 h in an 8-well chamber at 1 × 10⁶ cells/400 μL medium at 37 °C in a 5% CO2 atmosphere. The cells were washed twice with PBS and stained with 420 μL of a Magic Red (Immunochemistry Technologies, Bloomington, MN) solution for 1 h under similar incubation conditions. The cells were washed twice with PBS and fixed in 4% paraformaldehyde for 15 min. The cells were subsequently stained for 20 min with 10 μM Hoechst 33342 (Invitrogen, Carlsbad, CA) and 1 μg/mL of WGA-Oregon Green 488 conjugate (Invitrogen, Carlsbad, CA) at room temperature. The cells were washed twice with PBS and examined using a Leica Confocal SP2 1P-FCS microscope (Advanced Light Microscopy/Spectroscopy Shared Facility, UCLA). High-magnification images were obtained with a 63 × objective (Leica, N.A. = 1.4). The cell samples were scanned four times to obtain an average. Images were processed using Leica Confocal Software.
Abiotic quantification of ROS generation by 2’, 7’-dichlorofluorescein (H2DCF):
Abiotic ROS generation was assessed by preparing H2DCF working solution, dissolving 50 μg of the dye in 17.3 μL ethanol. To facilitate cleavage of the diacetate group, 692 μL of 0.01 M sodium hydroxide was introduced to the solution, and the mixture placed at room temperature for 30 min. After 3.5 mL of sodium phosphate buffer (pH= 7.1) was added to neutralize the reaction, 25 μg/mL of cellulose nanoparticles were incubated with 29 μmol/L H2DCF for 3 hr in a volume of 100 μL in a 96-well plate at room temperature. We took 60 μL of the stock suspension to prepare a nanocellulose suspension at 300 μg/mL in H2DCF solution. The suspension was diluted to 25 μg/mL to perform the measurement. The fluorescence intensity was measured at Ex492/Em527 nm in a SpectraMax M5 microplate reader (Molecular Devices, Sunnyvale, CA).
Determination of intracellular GSH content:
A GSH-Glo assay kit (Promega, Madison, WI) was used to determine the intracellular GSH levels during incubation of THP-1 cells with 37.5, 75, 150, 300 μg/mL cellulose nanoparticles in a 96-well plate at 37 °C and 5% CO2 for 6 h. The cellular supernatant was removed and 100 μL of GSH-Glo reaction buffer containing Luciferin-NT and glutathione S-transferase was added to each well in the plate and incubated at room temperature for 30 min. Following the addition 100 μL of Luciferin D to each well, the plate was incubated with constant shaking for another 15 min at room temperature. The luminescent signal was quantified using a SpectraMax M5 microplate reader (Molecular Devices; Sunnyvale, CA).
Analysis of BMDC maturation and cytokine production by cellulose nanoparticles:
BMDCs were exposed to cellulose nanoparticles at 300 μg/mL for 16 h before assessment of the expression of maturation markers (MHC-II, CD86, CD80, and CD40) on the cell surface. The expression of these markers was determined by flow cytometry using anti-CD11c PE plus one of the following FITC-labeled antibodies: anti-MHC-II, anti-CD86, anti-CD80, or anti-CD40.[23] Briefly, cells were exposed to blocking monoclonal antibodies (CD16/CD32) for 10 min on ice. After washing, cells were incubated with monoclonal antibodies for 30 min at 4 °C. The cells were analyzed using a FACScan flow cytometer (Becton Dickinson), and the data analyzed using FlowJo (Ashland, OR). For cytokine production, the BMDCs were treated with LPS (10 ng/mL) for 16 h before the addition of cellulose nanoparticles (300 μg/mL). The cells were treated for 8 h, and supernatants were collected for quantification of IL-1β by ELISA. IL-1β was measured by the mouse ELISA sets (BD Biosciences; San Diego, CA) according to the manufacturer’s protocols.
Animal vaccination using cellulose nanoparticles and OVA:
Eight-week old female C57BL/6 mice were purchased from Charles River Laboratories (Hollister, CA). All animals were housed under standard laboratory conditions established by UCLA guidelines for care and ethical treatment of laboratory animals, including the use of the NIH Guide for the Care and Use of Laboratory Animals in Research (DHEW78–23). Our protocols were approved by the Chancellor’s Animal Research Committee at UCLA and include standard operating procedures for animal housing (filter-topped cages; room temperature at 23 ± 2 °C 60% relative humidity; 12 h light, 12 h dark cycle) and hygiene status (autoclaved food and acidified water). The procedure and dosimetry of animal exposure to cellulose nanoparticles were referenced to previously studies.[22, 23, 56–58] Briefly, test animals were treated with endotoxin-free OVA (400 μg) or OVA/cellulose nanoparticles (400 μg/2 mg) via intraperitoneal (i.p.) injection on day 0. On day 7, the animals were i.p. treated with endotoxin-free OVA (200 μg). After animal sacrifice on day 14, blood samples were collected by cardiac puncture after pentobarbital anesthesia (0.1 mL of 50 mg/kg via i.p.). The mouse chest was opened and the blood was drawn by using a 21G needle and a 1 mL heparin-treated syringe. The serum was separated by centrifugation in a CAPIJECT blood collection tube (Terumo, Somerset, NJ) for 5 min (1500 rpm) and used for quantifying anti-OVA IgG and IgE titers by ELISA. Briefly, the blocked ELISA plate was coated with 50 μg/mL of OVA, followed by overlay of diluted serum samples and the addition of biotin-conjugated rat anti-mouse IgG or IgE antibodies (BD Biosciences, San Diego, CA).[23]
Statistical Analysis:
All the Statistical analysis represent mean±SD. Statistical significance was determined by two-tailed Student’s t test for two-group analysis or one-way ANOVA for multiple group comparisons.
Supplementary Material
Acknowledgements
Research reported in this publication was supported by the National Institute of Environmental Health Sciences of the National Institutes of Health under Award Number (U01ES027237) as part of the Nanotechnology Health Implications Research (NHIR) Consortium. The content is solely the responsibility of the authors and does not necessarily represent the official views of the National Institutes of Health. The engineered nanomaterials used in the research presented in this publication have been procured/developed, characterized, and provided by the Engineered Nanomaterials Resource and Coordination Core (U24ES026946) as part of the Nanotechnology Health Implications Research Consortium. The authors thank the CNSI Advanced Light Microscopy/Spectroscopy and Electron Imaging Center for NanoMachines Core Facilities, the Flow Cytometry Core Facility of Jonsson Comprehensive Cancer Center, the Microscopic Techniques and Electron Microscope Core Facility of Brain Research Institute, and the Integrated Molecular Technologies Core (CURE/P30 DK041301) at UCLA.
Footnotes
Supporting Information
Supporting Information is available from the Wiley Online Library or from the authors.
Conflict of Interest: Andre E. Nel is a co-founder and equity holder in Westwood Bioscience Inc and Nammi Therapeutics.
References
- [1].Mishra RK, Sabu A, Tiwari SK, J Saudi Chem Soc 2018, 22, 949–978. [Google Scholar]
- [2].Lin N, Dufresne A, Eur Polym J 2014, 59, 302–325. [Google Scholar]
- [3].Endes C, Camarero-Espinosa S, Mueller S, Foster EJ, Petri-Fink A, Rothen-Rutishauser B, Weder C, Clift MJD, J Nanobiotechnol 2016, 14. [DOI] [PMC free article] [PubMed] [Google Scholar]
- [4].Sunasee R, Hemraz UD, Ckless K, Expert Opin Drug Del 2016, 13, 1243–1256. [DOI] [PubMed] [Google Scholar]
- [5].Osong SH, Norgren S, Engstrand P, Cellulose 2016, 23, 93–123. [Google Scholar]
- [6].Kalia S, Dufresne A, Cherian BM, Kaith BS, Averous L, Njuguna J, Nassiopoulos E, Int J Polym Sci 2011. [Google Scholar]
- [7].Kalia S, Boufi S, Celli A, Kango S, Colloid Polym Sci 2014, 292, 5–31. [Google Scholar]
- [8].Peng BL, Dhar N, Liu HL, Tam KC, Can J Chem Eng 2011, 89, 1191–1206. [Google Scholar]
- [9].Dufresne A, Mater Today 2013, 16, 220–227. [Google Scholar]
- [10].Abitbol T, Rivkin A, Cao YF, Nevo Y, Abraham E, Ben-Shalom T, Lapidot S, Shoseyov O, Curr Opin Biotech 2016, 39, 76–88. [DOI] [PubMed] [Google Scholar]
- [11].Moon RJ, Martini A, Nairn J, Simonsen J, Youngblood J, Chem Soc Rev 2011, 40, 3941–3994. [DOI] [PubMed] [Google Scholar]
- [12].Guise C, Fangueiro R, Rilem Bookser 2016, 12, 155–169. [Google Scholar]
- [13].Clift MJD, Foster EJ, Vanhecke D, Studer D, Wick P, Gehr P, Rothen-Rutishauser B, Weder C, Biomacromolecules 2011, 12, 3666–3673. [DOI] [PubMed] [Google Scholar]
- [14].Catalan J, Ilves M, Jarventaus H, Hannukainen KS, Kontturi E, Vanhala E, Alenius H, Savolainen KM, Norppa H, Environ Mol Mutagen 2015, 56, 171–182. [DOI] [PubMed] [Google Scholar]
- [15].de Lima R, Feitosa LO, Maruyama CR, Barga MA, Yamawaki PC, Vieira IJ, Teixeira EM, Correa AC, Mattoso LHC, Fraceto LF, Int J Nanomed 2012, 7, 3555–3565. [DOI] [PMC free article] [PubMed] [Google Scholar]
- [16].Endes C, Mueller S, Kinnear C, Vanhecke D, Foster EJ, Petri-Fink A, Weder C, Clift MJD, Rothen-Rutishauser B, Biomacromolecules 2015, 16, 1267–1275. [DOI] [PubMed] [Google Scholar]
- [17].Endes C, Schmid O, Kinnear C, Mueller S, Camarero-Espinosa S, Vanhecke D, Foster EJ, Petri-Fink A, Rothen-Rutishauser B, Weder C, Clift MJD, Particle and fibre toxicology 2014, 11. [DOI] [PMC free article] [PubMed] [Google Scholar]
- [18].Cullen RT, Searl A, Miller BG, Davis JMG, Jones AD, J Appl Toxicol 2000, 20, 49–60. [DOI] [PubMed] [Google Scholar]
- [19].Yanamala N, Farcas MT, Hatfield MK, Kisin ER, Kagan VE, Geraci CL, Shvedova AA, Acs Sustain Chem Eng 2014, 2, 1691–1698. [DOI] [PMC free article] [PubMed] [Google Scholar]
- [20].Menas AL, Yanamala N, Farcas MT, Russo M, Friend S, Fournier PM, Star A, Iavicoli I, Shurin GV, Vogel UB, Fadeel B, Beezhold D, Kisin ER, Shvedova AA, Chemosphere 2017, 171, 671–680. [DOI] [PMC free article] [PubMed] [Google Scholar]
- [21].Yanamala N, Kisin ER, Menas AL, Farcas MT, Khaliullin TO, Vogel UB, Shurin GV, Schwegler-Berry D, Fournier PM, Star A, Shvedova AA, Biomacromolecules 2016, 17, 3464–3473. [DOI] [PubMed] [Google Scholar]
- [22].Sun BB, Ji ZX, Liao YP, Chang CH, Wang X, Ku J, Xue CY, Mirshafiee V, Xia T, Acs Appl Mater Inter 2017, 9, 21697–21705. [DOI] [PubMed] [Google Scholar]
- [23].Sun BB, Ji ZX, Liao YP, Wang MY, Wang X, Dong JY, Chang CH, Li RB, Zhang HY, Nel AE, Xia T, ACS nano 2013, 7, 10834–10849. [DOI] [PMC free article] [PubMed] [Google Scholar]
- [24].Xia T, Hamilton RF, Bonner JC, Crandall ED, Elder A, Fazlollahi F, Girtsman TA, Kim K, Mitra S, Ntim SA, Orr G, Tagmount M, Taylor AJ, Telesca D, Tolic A, Vulpe CD, Walker AJ, Wang X, Witzmann FA, Wu NQ, Xie YM, Zink JI, Nel A, Holian A, Environ Health Persp 2013, 121, 683–690. [DOI] [PMC free article] [PubMed] [Google Scholar]
- [25].Hamilton RF, Wu NQ, Porter D, Buford M, Wolfarth M, Holian A, Particle and fibre toxicology 2009, 6. [DOI] [PMC free article] [PubMed] [Google Scholar]
- [26].Ji Z, Wang X, Zhang H, Lin S, Meng H, Sun B, George S, Xia T, Nel AE, Zink JI, ACS nano 2012, 6, 5366–5380. [DOI] [PMC free article] [PubMed] [Google Scholar]
- [27].Lin SJ, Wang X, Ji ZX, Chang CH, Dong Y, Meng H, Liao YP, Wang MY, Song TB, Kohan S, Xia T, Zink JI, Lin S, Nel AE, Aspect Ratio Plays a Role in the Hazard Potential of CeO2 Nanoparticles in Mouse Lung and Zebrafish Gastrointestinal Tract. In ACS nano, 2014; Vol. 8, pp 4450–4464. [DOI] [PMC free article] [PubMed] [Google Scholar]
- [28].Wang X, Mansukhani ND, Guiney LM, Lee JH, Li RB, Sun BB, Liao YP, Chang CH, Ji ZX, Xia T, Hersam MC, Nel AE, ACS nano 2016, 10, 6008–6019. [DOI] [PMC free article] [PubMed] [Google Scholar]
- [29].Wang X, Lee JH, Li RB, Liao YP, Kang J, Chang CH, Guiney LM, Mirshofiee V, Li LJ, Lu JQ, Xia T, Hersam MC, Nel AE, Small 2018, 14. [DOI] [PMC free article] [PubMed] [Google Scholar]
- [30].Wang X, Duch MC, Mansukhani N, Ji ZX, Liao YP, Wang MY, Zhang HY, Sun BB, Chang CH, Li RB, Lin SJ, Meng H, Xia T, Hersam MC, Nel AE, ACS nano 2015, 9, 3032–3043. [DOI] [PMC free article] [PubMed] [Google Scholar]
- [31].Yang CN, Mamouni J, Tang YA, Yang LJ, Langmuir 2010, 26, 16013–16019. [DOI] [PubMed] [Google Scholar]
- [32].Murphy FA, Poland CA, Duffin R, Donaldson K, Nanotoxicology 2013, 7, 1157–1167. [DOI] [PubMed] [Google Scholar]
- [33].Murphy FA, Poland CA, Duffin R, Al-Jamal KT, Ali-Boucetta H, Nunes A, Byrne F, Prina-Mello A, Volkov Y, Li SP, Mather SJ, Bianco A, Prato M, MacNee W, Wallace WA, Kostarelos K, Donaldson K, Am J Pathol 2011, 178, 2587–2600. [DOI] [PMC free article] [PubMed] [Google Scholar]
- [34].Manke A, Luanpitpong S, Dong CB, Wang LY, He XQ, Battelli L, Derk R, Stueckle TA, Porter DW, Sager T, Gou HL, Dinu CZ, Wu NQ, Mercer RR, Rojanasakul Y, Int J Mol Sci 2014, 15, 7444–7461. [DOI] [PMC free article] [PubMed] [Google Scholar]
- [35].Ema M, Takehara H, Naya M, Kataura H, Fujita K, Honda K, J Toxicol Sci 2017, 42, 367–378. [DOI] [PubMed] [Google Scholar]
- [36].Park EJ, Khaliullin TO, Shurin MR, Kisin ER, Yanamala N, Fadeel B, Chang J, Shvedova AA, J Immunotoxicol 2017, 15, 12–23. [DOI] [PubMed] [Google Scholar]
- [37].Wang X, Xia T, Duch MC, Ji ZX, Zhang HY, Li RB, Sun BB, Lin SJ, Meng H, Liao YP, Wang MY, Song TB, Yang Y, Hersam MC, Nel AE, Nano Lett 2012, 12, 3050–3061. [DOI] [PMC free article] [PubMed] [Google Scholar]
- [38].Dong SP, Roman M, J Am Chem Soc 2007, 129, 13810-+. [DOI] [PubMed] [Google Scholar]
- [39].Zhang HY, Dunphy DR, Jiang XM, Meng H, Sun BB, Tarn D, Xue M, Wang X, Lin SJ, Ji ZX, Li RB, Garcia FL, Yang J, Kirk ML, Xia T, Zink JI, Nel A, Brinker CJ, J Am Chem Soc 2012, 134, 15790–15804. [DOI] [PMC free article] [PubMed] [Google Scholar]
- [40].Li RB, Guiney LM, Chang CH, Mansukhani ND, Ji ZX, Wang X, Liao YP, Jiang W, Sun BB, Hersam MC, Nel AE, Xia T, ACS nano 2018, 12, 1390–1402. [DOI] [PMC free article] [PubMed] [Google Scholar]
- [41].Zhang H, Wang X, Wang M, Li L, Chang CH, Ji Z, Xia T, Nel AE, Small 2015. [DOI] [PMC free article] [PubMed] [Google Scholar]
- [42].Wang X, Ji ZX, Chang CH, Zhang HY, Wang MY, Liao YP, Lin SJ, Meng H, Li RB, Sun BB, Winkle LV, Pinkerton KE, Zink JI, Xia T, Nel AE, Small 2014, 10, 385–398. [DOI] [PMC free article] [PubMed] [Google Scholar]
- [43].Sun BB, Wang X, Ji ZX, Wang MY, Liao YP, Chang CH, Li RB, Zhang HY, Nel AE, Xia T, Small 2015, 11, 2087–2097. [DOI] [PMC free article] [PubMed] [Google Scholar]
- [44].Shang L, Nienhaus K, Nienhaus GU, J Nanobiotechnol 2014, 12. [DOI] [PMC free article] [PubMed] [Google Scholar]
- [45].Champion JA, Mitragotri S, P Natl Acad Sci USA 2006, 103, 4930–4934. [DOI] [PMC free article] [PubMed] [Google Scholar]
- [46].Richards DM, Endres RG, P Natl Acad Sci USA 2016, 113, 6113–6118. [DOI] [PMC free article] [PubMed] [Google Scholar]
- [47].Zheng M, Yu J, Drug Deliv Transl Re 2016, 6, 67–72. [DOI] [PubMed] [Google Scholar]
- [48].Wang X, Duch MC, Mansukhani N, Ji Z, Liao YP, Wang MY, Zhang HY, Sun BB, Chang CH, Li RB, Lin SJ, Meng H, Xia T, Hersam MC, Nel AE, ACS nano 2015. [DOI] [PMC free article] [PubMed] [Google Scholar]
- [49].Shvedova AA, Kisin ER, Yanamala N, Farcas MT, Menas AL, Williams A, Fournier PM, Reynolds JS, Gutkin DW, Star A, Reiner RS, Halappanavar S, Kagan VE, Particle and fibre toxicology 2016, 13. [DOI] [PMC free article] [PubMed] [Google Scholar]
- [50].Farcas MT, Kisin ER, Menas AL, Gutkin DW, Star A, Reiner RS, Yanamala N, Savolainen K, Shvedova AA, J Toxicol Env Heal A 2016, 79, 984–997. [DOI] [PMC free article] [PubMed] [Google Scholar]
- [51].Dong XM, Revol JF, Gray DG, Cellulose 1998, 5, 19–32. [Google Scholar]
- [52].Ji ZX, Jin X, George S, Xia TA, Meng HA, Wang X, Suarez E, Zhang HY, Hoek EMV, Godwin H, Nel AE, Zink JI, Environ Sci Technol 2010, 44, 7309–7314. [DOI] [PMC free article] [PubMed] [Google Scholar]
- [53].Hilton CL, Anal Chem 1959, 31, 1610–1612. [Google Scholar]
- [54].Novo LP, Bras J, Garcia A, Belgacem N, Curvelo AAS, Acs Sustain Chem Eng 2015, 3, 2839–2846. [Google Scholar]
- [55].Williams MA, Rangasamy T, Bauer SM, Killedar S, Karp M, Kensler TW, Yamamoto M, Breysse P, Biswal S, Georas SN, J Immunol 2008, 181, 4545–4559. [DOI] [PMC free article] [PubMed] [Google Scholar]
- [56].Whitekus MJ, Li N, Zhang M, Wang MY, Horwitz MA, Nelson SK, Horwitz LD, Brechun N, Diaz-Sanchez D, Nel AE, J Immunol 2002, 168, 2560–2567. [DOI] [PubMed] [Google Scholar]
- [57].Li N, Wang MY, Barajas B, Sioutas C, Williams MA, Nel AE, J Innate Immun 2013, 5, 543–554. [DOI] [PMC free article] [PubMed] [Google Scholar]
- [58].Li N, Wang MY, Bramble LA, Schmitz DA, Schauer JJ, Sioutas C, Harkema JR, Nel AE, Environ Health Persp 2009, 117, 1116–1123. [DOI] [PMC free article] [PubMed] [Google Scholar]
Associated Data
This section collects any data citations, data availability statements, or supplementary materials included in this article.


