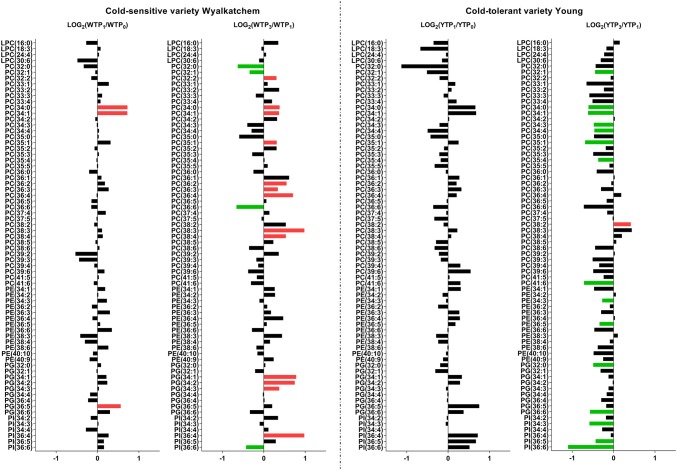
Fig. 2.
Log2-fold changes of phospholipids in the flag leaves of the cold-sensitive Wyalkatchem (W) and cold-tolerant Young (Y) after one night (TP1 vs. TP0) and prolonged (TP3 vs. TP1) of cold treatment. Fold changes were calculated by dividing the normalized response of the variety at a time point (e.g., TP1) to the normalized response of that variety at the previous time point (e.g., TP0), then Log2-transformed. Statistical method and cut-offs are as stated in Fig. 1. Green significant decrease, Red significant increase. There were four biological replicates (n = 4) for all the measured lipids

