

Abstract
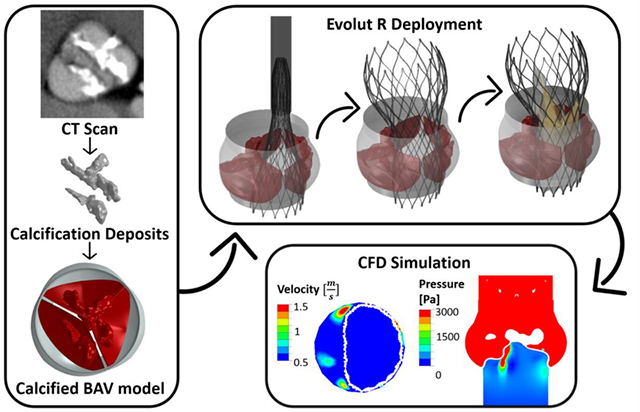
Calcific aortic valve disease (CAVD) is characterized by stiffened aortic valve leaflets. Bicuspid Aortic Valve (BAV) is the most common congenital heart disease. Transcatheter aortic valve replacement (TAVR) is a treatment approach for CAVD where a stent with mounted bioprosthetic valve is deployed on the stenotic valve. Performing TAVR in calcified BAV patients may be associated with post-procedural complications due to the BAV asymmetrical structure. This study aims to develop refined computational models simulating the deployments of Evolut R and PRO TAVR devices in a representative calcified BAV. The paravalvular leakage (PVL) was also calculated by computational fluid dynamics simulations. Computed tomography scan of severely stenotic BAV patient was acquired. The 3D calcium deposits were generated and embedded inside a parametric model of the BAV. Deployments of the Evolut R and PRO inside the calcified BAV were simulated in five bioprosthesis leaflets orientations. The hypothesis of asymmetric and elliptic stent deployment was confirmed. Positioning the bioprosthesis commissures aligned with the native commissures yielded the lowest PVL (15.7 vs. 29.5 mL/beat). The Evolut PRO reduced the PVL in half compared with the Evolut R (15.7 vs. 28.7 mL/beat). The proposed biomechanical computational model could optimize future TAVR treatment in BAV patients.
Keywords: Bicuspid aortic valve, Transcatheter aortic valve replacement, Paravalvular leakage, Finite element, Computational fluid dynamics
Graphical Abstract
1. Introduction
Bicuspid aortic valve (BAV) is the most common type of congenital heart disease, occurring in 0.5–2% of the population [1, 2], where the aortic valve has only two rather than the normal three leaflets. In most cases, the valve includes one fused cusp formed by two segments connected by a raphe, named BAV type 1 [2–4]. Calcific aortic valve disease (CAVD) is characterized by stiffened valve leaflets, which lead to aortic stenosis. CAVD is a common complication in BAV patients; over 50% of the patients diagnosed with aortic stenosis have a BAV [5] and their progress rate is accelerated compared with tricuspid aortic valve (TAV) patients [6, 7]. Transcatheter aortic valve replacement (TAVR) is a minimally invasive cardiovascular technology that provides an alternative to surgical valve replacement [8]. In this procedure, a stent with a mounted bioprosthetic valve is delivered through the arterial tree and deployed through the stenotic native valve. In most clinical trials of TAVR, BAV patients were excluded [9]. The concern of implantation in those patients stems from the BAV asymmetrical structure, large annulus, and heavily calcification, which can cause partial anchoring, paravalvular leakage (PVL), central regurgitation, and uneven radial forces, which may lead to annular rupture [10–13]. In recent years, more international centers started to perform TAVR in BAV patients [10, 14]. Most of the clinical studies strongly recommend TAVR in BAVs because it has comparable outcomes with TAV patients [10, 15–18]. However, few studies remain cautious regarding this recommendation; Costopoulos et al. [19] mentioned that TAVR in BAVs was associated with less favorable 30-days outcome compared with TAV. Mylotte et al. [14] and Bauer et al. [15] reported on higher incidence of post-implantation aortic regurgitation in BAVs compared to TAVs. The implantation of the self-expandable CoreValve device in BAVs is characterized by an elliptic anchoring shape, with higher occurrence of post-implantation central regurgitation than the balloon expandable Edwards Sapien valve [14, 17].
Finite element (FE) simulations of TAVR deployment inside calcified aortic valves are emerging and gaining momentum in recent years [20–29]. Some studies [20–23] simulated the calcium deposits as a separate part attached to the healthy tissue, or without tissue, while other studies [24–26] did not include the calcified cusps at all. Some studies aimed to utilize the FE method to simulate and explore the factors causing complications as a result of TAVR procedure, such as aortic rupture [27] and TAVR migration [28].
In addition to the structural FE simulations, few studies also involved flow simulations to evaluate the performance of TAVR deployment from flow and PVL aspects. Kandail et al. [26] performed fluid-structure interaction simulations to compare between two deployment locations of the CoreValve stent and examined the flow through the coronary arteries. In Mao et al. [23] simulations, the calcified leaflets were modeled with separate tissue and calcium deposits, where the deployment of CoreValve in different heights and orientations was simulated. They performed computational fluid dynamics (CFD) simulations for all cases, and received higher PVL values for positioning the stent commissures in alignment with the native commissures. Bianchi et al. [29] and De Jaegere et al. [30, 31] also performed CFD simulations on the resulted geometries of TAVR deployment inside patient specific calcified models. Bianchi et al. [29] simulated deployment of CoreValve and Sapien for different implantation depths, with and without balloon over-inflation. De Jaegere et al. [30, 31] simulated deployment of CoreValve for different calcified cases. However, the applied diastolic pressure in their simulations was constant of 32 mmHg, which is relatively low for representation of the diastolic phase. Both studies compared and related their PVL values to the regurgitation classification obtained from post TAVR echocardiography data of the same patients.
Since performing TAVR in BAV patients is gaining momentum only in recent years, numerical simulations of the procedure in calcified BAVs are not yet available. The aim of this study is to evaluate how the asymmetric geometry of a representative calcified BAV influences the feasibility of deploying self-expandable TAVR, the Medtronic Evolut R and PRO devices, in those patients by employing numerical FE methods. In addition, our goal is to utilize the resulted structural geometries for CFD simulations to calculate the PVL severity, one of the most common complications resulted from TAVR. With these numerical tools, the influence of the deployment orientation will be examined, and comparison between the Evolut R and Evolut PRO devices will be performed, to better understand the added value of the outer cuff.
2. Methods
2.1. Finite Element Model of Calcified Bicuspid Aortic Valve (BAV)
2.1.1. Computed Tomography (CT) Acquisition
The calcification anatomy was obtained from computed tomography (CT) scan of a pre-TAVR 77 year-old female patient, diagnosed with severely calcified BAV type 1. The scan was taken at Sheba Medical Center. The CT was performed using a 256-slice system (Brilliance iCT, Philips Healthcare, Cleveland, OH, USA). Data were acquired with a collimation of 96 × 0.625 mm and a gantry rotation time of 330 ms. The tube current was 485 mA at 100 kV, pitch value was 0.2, and the scan direction was cranio-caudal. Intravenous injection of 60 to 80 ml of nonionic contrast agent (Iopromide 370; Bayer Schering, Berlin, Germany) at a flow rate of 5 ml/s was followed by a 30-ml saline chase bolus (3 ml/s). Automated peak enhancement detection in the descending aorta was used to time the scan. Data acquisition was automatically initiated at a threshold level of 180 Hounsfield units. Acquisition was performed during inspiratory breath hold, and the electrocardiogram was recorded simultaneously to allow for retrospective gating of the data. All images were reconstructed with a slice thickness of 0.67 mm and a slice increment of 0.34 mm. The chosen scan was acquired during the systolic phase (40% phase of the cardiac cycle).
2.1.2. Reconstruction of the Calcification Deposits
The selected patient had a heavily calcified raphe region, which allowed us to represent and predict one of the major challenges of performing TAVR in BAVs, contributing to the assumed elliptical and asymmetrical deployment of the TAVR. The calcium deposits were reconstructed based on the Hounsfield unit (HU) histogram of the scan, using ScanIP software (Synopsys, Mountain View, CA), as can be seen in Fig. 1A and 1B.
Fig. 1:

(A) Selected CT image of pre-TAVR calcified BAV patient (B) Extracted 3D calcium deposit volumes processed from the CT images with the proposed protocol (C) Previous calcium deposit volumes embedded inside the 3D-FE parametric BAV model with NFC angle of 140° (model 1) (D) Boundary mesh area between the leaflet and the calcium, with shared nodes assuming full interface displacement continuity
2.1.3. Generation of the Calcified Bicuspid Aortic Valve (BAV) Finite Element Model
The geometry of the BAV was constructed based on a previously developed 3D parametric representation of an asymmetric BAV type 1 [32]. The parametric model, originally developed [33] and validated [34] by our group for TAVs, was constructed from mathematically formulated 3D surfaces and curves. After several modifications of the mathematical curves, which include fusion of two identical leaflets with a raphe into a fused cusp, and angular sizing of the cusps and the root, an asymmetric BAV geometry with non-fused and fused cusps was generated [32]. A parametric model of BAV type 1, with non-fused cusp (NFC) angle of 140°, and annulus and sinotubular junction diameters of 24 and 26.4 mm, respectively, was chosen to best represent the measured geometry of the selected calcified patient. TrueGrid (XYZ Scientific Applications Inc., Livermore, CA, USA) was used to generate the FE mesh.
The calcification deposits were downscaled by a factor of 30%, relative to their center of mass, to account for the blooming effect in the scans that leads to an overestimation of their volumes [28]. The 30% value was determined mainly to match the calcium deposit in the raphe with the length of the raphe in the fused cusp in the model. The measured geometrical parameters of the patient do match the parametric model; however, during the processing of the calcification deposits, they were overestimated, in part, due to the relative HU range that can also contribute to increased volume. The calcium deposits were embedded inside the leaflets which have variable thickness (0.3 mm in the attachment line and 0.15 mm in the free edge), by using SpaceClaim software (ANSYS, Canonsburg, PA), as can be seen in Fig. 1C (model 1). This process resulted in calcification deposits located in confined ‘pockets’ within the soft tissue, where both tissue and calcium were meshed with 3D tetrahedral elements, approximately 350k and 240k elements with average edge length of 0.18 mm, for the fused and non-fused cusps, respectively. The tissue and the calcium were sharing nodes in the boundary mesh between them, assuming full interface displacement continuity (Fig. 1D). The resulting mesh was exported to Abaqus 6.16 (Dassault Systèmes, SIMULIA Corp., Johnston, RI), where different material properties were assumed for the calcium and the soft tissue regions. The calcifications were modeled as linear elastic material with Young’s modulus of 12.6 MPa [35]. Hyperelastic material properties were used for the soft tissue, specifically third order Ogden model (Table 1), fitted on the results of equibiaxial test data taken on human leaflets [36, 37].
Table 1:
The hyperelastic material constants employed for modeling the soft tissue with third order Ogden model, fitted to the results of equibiaxial test data taken from Martin et al. [36, 37]
| μ1 [MPa] | α1 | μ2 [MPa] | α2 | μ3 [MPa] | α3 | |
|---|---|---|---|---|---|---|
| Fused Cusp | −47.9 | 1.99 | 33.4 | 3.99 | 14.6 | −2 |
| Non- Fused Cusp | −26.3 | 1.99 | 18.1 | 3.99 | 8.3 | −2 |
2.2. Finite Element Model of TAVR
The geometric model of the latest versions of the FDA approved devices, Medtronic Evolut R and Evolut PRO with stent size of 29 mm, were utilized [29]. Both models have identical geometries for the stent, bioprosthetic leaflets and inner cuff, while the Evolut PRO, the newer device, also includes an outer cuff, as can be seen in Fig. 2 (models 2a and 2b). The stent was generated in Matlab based on Bézier curves and resulted in a structured hexahedral mesh (≈70k elements with average dimensions of 0.06mm × 0.13mm × 0.32mm), with rectangular cross section dimensions of 0.4 mm × 0.2 mm for the struts. The stent was modeled with NiTi alloy material properties, by implementing a built-in Abaqus VUMAT, assuming purely superelastic behavior. The parameters that were used in the subroutine to represent the NiTi alloy behavior were based on the study by Auricchio et al. [38, 39], and presented in Table 2. The leaflets and the cuff were meshed with shell (≈22k) and membrane (≈40k) elements, respectively, and assumed to have linear elastic material properties and thickness of 0.1 mm. The leaflets were modeled as bio-prosthesis porcine leaflets, with density of 1,120 kg/m3, Young’s modulus of 7.5 MPa and Poisson’s ratio of 0.45 [40, 41]. The cuff was modeled with density of 1,280 kg/m3, Young’s modulus of 500 MPa and Poisson’s ratio of 0.3 [42].
Fig. 2:

The Evolut R (left - model 2a) and Evolut PRO (right - model 2b) models. Both models are identical except for an additional outer cuff in the Evolut PRO
Table 2:
The Niti Alloy parameters that were used in the Super-elasticity Abaqus VUMAT, for modeling the stent. The parameters were based on the study by Auricchio et al. [39].
| Ea | Va | EM | VM | εL | (δσ/δT)L | σLS |
|---|---|---|---|---|---|---|
| 51,700 MPa | 0.3 | 47,800 MPa | 0.3 | 0.063 | 6.527 | 600 MPa |
| σLE | To | (δσ/δT)U | σUS | σUE | σCLS | εVL |
| 670 MPa | 37°C | 6.527 | 288 MPa | 254 MPa | 900 MPa | 0.063 |
2.3. Structural Finite Element model of TAVR deployment inside the calcified BAV
The goal of this study is to simulate deployment of Evolut R and PRO into a calcified BAV, and eventually to utilize and import those structural models into CFD simulations in different deployment orientations in order to calculate the PVL, which occurs during diastole. In order to create the structural FE model for each deployed TAVR orientation, aiming to represent it during diastole, several sequential simulations were performed, where the final configuration of each FE simulation was imported into the following FE simulation.
For all the structural FE simulations mentioned in this section below, the solver was Abaqus 6.16 (Dassault Systemes, Simulia Corp., Providence, RI), where explicit dynamic analyses were performed with minimal time step of 10−7 sec. A semi-automatic mass scaling was applied for the entire models. An automatic general contact algorithm was applied where the friction coefficient was assumed to be 0.15 [43].
2.3.1. Crimping the Evolut Stent
At first, only the stent of the Evolut R was crimped by using an outer cylindrical crimper. The crimper had a 36 mm diameter, and was meshed with surface elements, with density of 1000 kg/m3. The crimping was performed by dictating the radial displacements of the crimper to reach final crimped configuration of 6 mm diameter for both stent and crimper, as can be seen in Fig. 3A (model 3).
Fig. 3:

(A) Simulated FE Evolut stent crimping by applying a radial displacement on an outer cylindrical surface (Model 3) (B-D) Progressive deployment of the crimped stent (from model 3) inside the calcified BAV (model 1), by pulling the sleeve and tracking the stiffened and compliant BAV interactions with the stent (model 4)
2.3.2. Deploying the Evolut Stent Inside the Calcified BAV Model
In a second and separate simulation, deployment of the stent into the calcified BAV was simulated. By applying pressure on the calcified BAV leaflets, they were slightly opened to achieve a minimal gap of 8 mm between them, allowing for insertion of the crimped stent. The crimped stent was imported with its residual stresses from the last step of the previous simulation (model 3), together with the geometry of the sleeve (the crimped crimper). Both stent and sleeve were positioned in the middle of the gap between the calcified leaflets, where the lower end of the stent was located 6 mm from the annulus, as recommended by Medtronic [23]. By pulling the sleeve towards the aorta and releasing the stent, as a result of its residual stresses, the stent was gradually expanded inside the calcified leaflets, as can be seen in Fig. 3B–D (Fig. 3D is model 4). The pull out of the sleeve was simulated for 0.13 sec, while the afterwards relaxation time of the fully deployed stent took 0.075 sec, in order to stabilize the stent and leaflets. A video of the stent deployment is provided in the supplementary material.
2.3.3. Adding the Bioprosthetic Leaflets and Cuff to the Deformed Evolut Stent
The next stage was to add the cuff and bioprosthetic leaflets to the deployed stent model in order to represent the full deployed TAVR model during the diastolic phase. The leaflets and cuff geometry were generated in their initial position, based on the original Evolut R and PRO models (before crimping), as seen in Fig. 4A for Evolut PRO. The displacement field of the deployed stent (from model 4) was applied as boundary conditions to deform the stent nodes of the full Evolut R and PRO models, including the cuff and leaflets, as can be seen in Fig. 4B. Since our goal is to represent the TAVR during the diastolic phase, the bioprosthetic leaflets were closed by applying transvalvular diastolic pressure on them (75 mmHg) as presented in Fig. 4C. The full geometry, including the deployed stent, cuff, bioprosthetic leaflets, deformed native leaflets and root in diastolic phase, is presented in Fig. 5A for the Evolut R (model 6). A summary of the consequential course in creating models 1–6, which were used to create the full structural geometry to be imported into the CFD simulation, is described in Fig. 6.
Fig. 4:

(A) Stand-alone initial Evolut PRO geometry (model-2b) with cuff and bio-prosthetic leaflets (left column) (B) The deformed Evolut PRO model created by imposing the final deployed stent configuration from model-4 (BAV and stent) (middle column) (C) Deformed bio-prosthetic leaflets as a result of diastolic transvalvular pressure used to obtain the diastolic state, assuming fully compliant leaflets (right column- model 5)
Fig. 5:

Model 6: (A) The complete structural geometry, including the root, deformed native leaflets, deployed stent, cuff and closed bioprosthetic leaflets. The anchoring gaps between the device and the calcified leaflets are also presented (A3). (B) The CFD paravalvular leakage simulation model through the full TAVR-BAV structural assembly; also demonstrating the refined meshing by using the subgrid geometry resolution method. The pressure boundary conditions were employed in the aortic (inlet) and left ventricle (outlet) extensions
Fig. 6:

A summary of the consequential creation of models 1–6, which eventually resulted in a structural geometry of the deployed Evolut device inside the calcified BAV, at the diastolic phase. This geometry was imported into the CFD simulation.
2.3.4. Creating Five Models with Different Bioprosthetic Leaflet Orientations
Five Evolut PRO models with rotation of the cuff and bioprosthetic leaflets in a 24° were generated. The models were named by the cuff and bioprosthetic leaflets commissures orientation relative to the native commissures: −48°,−24°,0°,24° and 48°, while 0° represent the alignment that fits the two commissures. The 24° and 48° models represent clockwise rotation relatively to the 0° model, while the −24° and −48° models depict counterclockwise rotation. Intervals of 24° were chosen since it represents the angle of the maximum spacing between two struts, and since the cuff and bioprosthetic leaflets are periodically identical every 120°, five orientations were chosen. For all models, the same procedure described in section 2.3.3 of deforming the stent with the rotated cuff and leaflets, and afterwards applying transvalvular diastolic pressure to close the bioprosthetic leaflets, was performed. It is important to note that the stent remained in the same position, while only the cuff and leaflets were rotated and their nodes were re-merged with the stent.
2.4. CFD Simulations to Calculate the Paravalvular Leakage (PVL)
The full geometries (model 6) of the Evolut PRO in all five orientations for the cuff and bioprosthetic leaflets (after extrusion into 3D smoothed geometry, representing their physical volumes) were imported to FlowVision HPC 3.09 (Capvidia, Leuven, Belgium) for CFD simulations. An example for the full CFD model, including the computational domain and the structural geometry, is seen in Fig. 5B for −48° orientation. The orientation which yielded the lowest PVL values was chosen to be simulated also for Evolut R, for comparison between the two devices.
To minimize the effect of the boundary conditions on the cusps, two straight circular and rigid tubes (2 and 4 cm in length) were added upstream and downstream, respectively. These lengths were chosen to be physiologically relevant [44]. Constant pressure of 90 and 0 mmHg was employed in the aortic and left ventricle boundary extensions, respectively, representing average diastolic pressure gradient. The flow was assumed to be laminar [45] and the blood to be Newtonian and isothermal at a temperature of 37 °C [46–50]. The blood was assumed to be slightly compressible, with a realistic and physiological compressibility of 3.75·10−10 m2/N [48, 51]. Navier-Stokes equations were solved to model the flow. The flow equations were solved with a finite volume method. The mesh was refined near the boundaries of the wall, cusps and TAVR device, using the subgrid geometry resolution method [52] with a Cartesian mesh, as presented in Fig. 5B. The initial spacing of the Cartesian mesh was 1 mm in the x and y directions and 1.2 mm in the z direction. A spatial-temporal second-order upwind discretization technique was employed by the implicit flow solver, using a time step of 0.001 sec. The duration of the simulation took 0.02 sec in order to reach a steady state.
The PVL for each case was determined by calculating the volume flow in plane BB’, located below the annulus (Fig. 5B). When the simulation reached a steady state, the difference between the positive and negative volume flows was calculated for a representative one time step (at 0.017 sec), and the calculated value was multiplied by 500 msec to receive PVL value which represents the entire diastolic phase.
3. Results
3.1. Structural Anchoring Forces
The results of the Evolut stent deployment into the calcified BAV demonstrates an asymmetric and elliptic deployment, adapted from the elliptical shape of the BAV opening, restricted in the fused cusp side (Fig. 2D). By measuring the displacements in the center of the belly of each cusp (relative to an almost closed position), the fused cusp displacements were approximately half of the NFC (4.11 vs. 9.18 mm).
The contact area and average pressure between the stent and each native cusp were calculated. First, the ventricular surface of each cusp was saved as a triangular mesh (instead of 3D tetrahedral elements). The area around each node was calculated as the sum of 1/3 area-contributions from all the neighboring “elements” of the specific node. Summation of the area of all the nodes in contact with the stent yielded the contact area. The average pressure for each cusp was calculated as weighted average; as the sum of the nodal contact force value of each node multiplied by its area and divided by the total contact area. By comparing the contact area between the stent and the cusps, the fused cusp experienced a much larger contact area compared with the NFC (14.46 vs. 2.45 mm2), which resulted in lower average pressure in this cusp (0.23 vs. 0.54 MPa), as can be seen in Fig. 7. The maximal pressures on each cusp were 25MPa for the NFC and 9.6 MPa for the fused cusp.
Fig. 7:

The contact area between the deployed Evolut stent to the native cusps, including pressure values and total contact area with each cusp
3.2. Paravalvular Leakage of Different Cuff and Bio-Prosthesis Commissure Orientations
Fig. 8 presents the results of the CFD simulations for the five deployed Evolut PRO models, with cuff and bio-prosthesis commissure orientations which differ in a clockwise rotation of 24°. In the first row of Fig. 8, the five simulated structural models are presented, where the commissure orientation of the cuff and bio-prosthesis relative to the native commissures can be clearly seen. As a result of simulating in different inner cuff orientations and circumstances related to the heavily calcified raphe, for some of the models, a gap between the cuff and the fused cusp was observed, which can eventually lead to leakage into this gap, as presented in Fig. 5A(3) for the 48° model.
Fig. 8:

Results of the CFD pressure and velocity contours indicating paravalvular leakage in the Evolut PRO for five deployment angles measured by clockwise and counterclockwise rotation in 24° relative to the 0° orientation, which represents alignment of the native and bioprosthetic commissures. The rotation is for both the cuff and the bio-prosthetic leaflets (first row). Second and third row illustrate pressure and velocity contours in planes BB’ and CC’, respectively. Last row indicates the PVL values for each case
Plane CC’ is located 7 mm from the center of the model, and since this plane captures the structural gap between the cuff and fused cusp, it was chosen to demonstrate the pressure contours in steady state (time step of 0.017 sec), as can be seen in the second row of Fig. 8. The results of the pressure contours are indicative of a strong jet flow through the gap for −48° and −24° orientations. In the 24° and 48° models, there is also a presence of pressure gradients below the annulus, which implies on a leakage, yet, not as severe as in −48° and −24° orientations. For the 0° orientation model, the pressure below the annulus is nearly 0 Pa, which indicates that the native cusps and Evolut PRO are hermetically sealed.
The third row in Fig. 8 illustrates the velocity contours for the same time step in plane BB’, which is located below the annulus. This plane was chosen to demonstrate the paravalvular leakage around the stent. For the −48° orientation, the jet through the gap which was mentioned above, can be also seen in plane BB’. Even though the stent is clinging to the annulus in the NFC side, for all models, a minor leakage was found in this area between the stent and the annulus with maximum velocity of 2 m/sec for the 0° orientation, which gradually decreased with the rotation of the cuff, reaching minimum velocity magnitudes of 1.4 and 1.65 m/sec for the 48° and −48° models, respectively. For all the orientations, an additional leakage around the stent, in the gap between the commissures of the native fused cusp and the stent, was also found (Fig. 5A(3)). The velocity magnitude of this leakage also varied gradually among the models, with maximum and minimum values of 1.9 and 1 m/sec for the −24° and 24° models, respectively, and a velocity magnitude of 1.5 m/sec for the rest of the orientations.
The last row of Fig. 8 presents the calculated PVL values for each case. The lowest PVL value of 15.7 mL/beat was received for the 0° model, with a similar value of 17.3 mL/beat for the 24° orientation. As the cuff commisures rotated futher from the native commisures, the PVL values were significantly increased, reaching a maximal value of 29.5 mL/beat for the −48° model.
Fig. 9 presents the velocity streamlines for the 0° and 48° orientations in plane AA’ which captures the gap between the device and fused cusp. Those cases were chosen to represents two extream cases of the leakage pattern. For the 48° orientation, the leakage throught the gap is demonstrated, where for the 0° case, this gap is sealed.
Fig. 9:

Results of the velocity streamlines for the 0° and 48° orientations, in plane AA’. The leakage through the gap between the inner cuff and fused cusp is shown for the 48° case, while for the 0° orientation this gap is sealed.
3.3. Paravalvular Leakage of the Evolut R vs. Evolut PRO
One of the aims of this study was to compare the PVL values between the Evolut PRO and the Evolut R. The difference between the two relates to the additional outer cuff added to the Evolut PRO. In order to examine the impact of adding or removing the outer cuff on the device performance and to best depict the difference between the two, the orientation which yielded the lowest PVL value for the Evolut PRO (0°) was chosen to be simulated for both devices. Selecting the 0° orientation gives us an added value, since the gap between the stent and inner cuff to the calcified fused cusp (Fig. 5A(3), Fig. 9) does not occur for this orientation, therefore, any resulted PVL difference between the two simulated devices will stem from the differences in the devices only.
Fig. 10 presents the results of the pressure (in plane AA’) and velocity (in plane BB’) contours for the simulated Evolut PRO (left) and Evolut R (right), with 0° orientation for the cuff and bioprosthetic leaflets in steady state (0.017 sec). As can be seen from planes AA’ and BB’, the difference between the two models lies mostly in the paravalvular leakage between the stent and annulus in the NFC side, where the influence of the outer cuff is expressed. The Evolut R experienced higher velocity for the leakage in this area (2.8 m/sec) compared with the Evolut PRO (2 m/sec). On the contrary, the leakage in the gap between the native commisures to the stent was not influenced by the device type, since this kind of leakage depends mainly on the orientation of the inner cuff. However, the overall PVL values per beat are significantly affected by the device type; the Evoult R resulted with almost twice regurgitant flow volume compared to the Evolut PRO (28.7 vs. 15.7 mL/beat).
Fig. 10:

Results of the pressure (first row) and velocity (second row) contours comparing the Evolut PRO (left) and Evolut R (right), for cuff orientation case of 0°, in the cross sectional planes AA’ (presented in Fig. 5B.1) and BB’. Last row indicates the PVL values for each device
4. Discussion
The motivation behind this study was to investigate the feasibility of performing TAVR in BAV patients, a procedure which gained momentum only in the recent years for this type of patients. Another goal was to determine the significance and influence of the inner cuff orientation and the presence of the outer cuff in the device. For this purpose, numerical FE simulations of TAVR deployment, the self-expandable Evolut R and PRO devices, inside representative heavily calcified BAV geometry, were performed. The resulted structural geometries, including the deployed stent with five different cuff and bio-prosthesis orientations and native calcified cusps, were utilized for CFD simulations. The PVL, one of the most common complications associated with TAVR, was calculated for the different cases.
The predicted hypothesis of asymmetric and elliptic stent deployment was revealed as correct. The inherent fusion of the fused cusp, which already reduces the valve’s orifice area compared with TAV [32, 53], together with the heavily calcified raphe, resulted in restricted stent deployment, which inevitably led to reduced fused cusp displacements, compared with those of the NFC (4.11 vs. 9.18 mm). As mentioned before, this type of heavily calcified raphe was intentionally chosen to demonstrate an extreme case of heavily calcified BAV. The anchoring forces between the stent and cusps are unequal; the contact area with the fused cusp is significantly higher compared to the NFC (14.46 vs. 2.45 mm2), which is reasonable due to its larger width and surface area, as seen in Fig. 7. This led to higher average pressure on the NFC (0.54 vs. 0.23 MPa). Moreover, it is interesting to see that the lower extension of the stent did not cling to the annulus wall in the fused cusp side. To avoid unnecessary radiation exposure to the patient, post-TAVR CT scan of the same patient was not acquired, thus preventing us from validating the results. Despite this fact, studies in the literature demonstrating CT scans of post CoreValve deployment inside calcified BAVs support the received outcomes, presenting an elliptical deployment which does not fully cling to the annulus wall [14, 17]. Previous simulations of stent deployment were also performed for healthy (non-calcified) BAV model, which also yielded an elliptical opening shape (yet, with a larger opening in the fused cusp side). Therefore, one can assume that due to the inherent asymmetrical geometry of BAV type 1, deploying the Evolut stent inside any calcified configuration of BAV type 1 will result in elliptical and asymmetrical deployment.
Clinical post-TAVR studies of BAV patients demonstrated that self-expandable TAVR devices are characterized by a more elliptical and oval stent opening compared with the balloon-expandable devices [14, 17]. The hemodynamics through the bioprosthetic leaflets in the self-expandable Evolut R and PRO are not supposed to be affected by this elliptical anchorage due to the supra-annular design of those devices [54]. However, simulations showed that for several cuff orientations, the elliptical deployment left gaps between the inner cuff and stent of the device to the fused cusp, which eventually led to higher PVL. The inner cuff is composed of three periodically identical cuffs; arc shaped in their upper edge, following the curvature of the bio-prosthetic leaflets, having their highest length in the commissures of the bio-prosthetic leaflets. Therefore, the orientation and position of the inner cuff influence directly on the size of gap between the device and the calcified cusps (Fig. 5A(3)), and as a result, on the amount of leakage through this gap, as example can be seen in Fig. 9 for the 0° and 48° orientations. For the 0° orientation, where the bio-prosthesis commissures were aligned with the gap between the device and the fused cusp (and with the native commissures), there is no leakage through the gap. By rotating the cuff both clockwise and counterclockwise, the size of the gap increases, leading to gradual increase of the leakage, resulting in double leakage for the −48° compared with the 0° orientations (29.5 vs. 15.7 mL/beat), as presented in Fig. 8. In addition, as for the leakage between the cuff and the native commissures, the positioning of the 0° orientation provided the best sealing compared with the other orientations, resulting in minimum leakage velocity. Therefore, we can conclude that for the examined calcified BAV configuration, aligning the native and bio-prosthesis commissures (0° orientation) yields the best outcome from the PVL aspect.
We also performed simulations of stent deployment in several heights (for the lower end of the crimped stent positioned in 4, 6 and 8 mm below the annulus), which led to the conclusion that 6 mm height best depicts the differences between the five inner cuff orientations from the PVL aspect. Positioning the stent higher will eliminate the difference between the orientations, and lower positioning will result in higher PVL for all of them. It is important to mention that in reality, during TAVR implantation, the cardiologist cannot control the device orientation, and those results have impact mainly in the case of lower stent deployment.
The calculated PVL values (≈15–30 mL/beat) are consistent with the PVL values received by Mao et al. [23] (≈19–33 mL/beat) and Bianchi et al. [29] (≈20–35 mL/beat), which performed a similar work for TAVs. However, by positioning the stent very low (≈10 mm below the annulus), Mao et al. [23] came to the opposite conclusion of ours, reporting higher PVL values (32.9 vs. 21.9 mL/beat) for aligning the commissures of the cuff with the native cusps (for higher implantation heights of 5 and 0 mm below the annulus, their results were comparable). This difference may lay in the fact that Mao et al. [23] simulations and ours were performed on different types of native valves, TAV and BAV, where the functionality of the device may differ for each case.
The outer cuff of the Evolut PRO was designed for a better paravalvular sealing, and as seen from the PVL results presented in Fig. 10, it managed to reduce the leakage by a factor of two compared with the Evolut R (15.7 vs. 28.7 mL/beat). Those results are derivative from device differences, since both of them were simulated in the 0° orientation configuration, eliminating leakage from the fused cusp and stent gap (Fig. 9). The presence and effectiveness of the outer cuff is clearly demonstrated in plane BB’ in Fig. 10, by observing the area where the stent clings the NFC side, the increased thickness of the Evolut PRO led to improved sealing which resulted in a reduced leakage, and lower leakage velocity (2 vs. 2.8 m/sec).
5. Limitations
Given the proprietary nature of the information, the assumed NiTi alloy properties were taken from the literature and may not reflect the accurate CoreValve properties. A limitation of the CFD model lies in the assumption of constant diastolic pressure (90 mmHg). However, this pressure value was chosen since it represents the average pressure gradient during the diastolic phase. Another limitation lies in the calculation of the PVL based on the leakage in a representative time step, which was generalized to account for the entire cardiac cycle, also neglecting any accompanied dynamic effects. A denser fluid mesh is needed to generate refined PVL flow results and jets. Moreover, in order to represent the diastolic phase, the bioprosthetic leaflets were forced to close by applying on them transvalvular pressure. In reality, due to the elliptical and asymmetrical stent deployment, which affects the bioprosthetic leaflets, an additional central leakage may appear. One of the major limitations of the current study is the inability to validate the results against a post-TAVR CT scan of the same calcified BAV patient (due to unwanted radiation exposure to the patient). However, the results were compared to other numerical models and clinical data of post-TAVR CT scans of BAV patients, and the conclusions were based on trend comparisons. The simulations in this study were conducted on a single calcified BAV geometry; however, further simulations need to be performed on different types of BAV configurations and calcifications in order to achieve more comprehensive and clinical conclusions.
6. Conclusions
In this study, biomechanical numerical FE analyses of deployment of the self-expandable Evolut R and PRO TAVR devices inside representative calcified BAV were performed. The influences of the orientation of the inner cuff and presence of the outer cuff were examined by conducting CFD simulations to calculate the PVL during diastole. The stent deployment resulted in an asymmetric and oval shape inside the native calcified BAV. Positioning the cuff and prosthetic commissures in alignment with the native commissures was found to minimize the PVL. The outer cuff of the Evolut PRO was shown to be more efficient in reducing the leakage compared to the Evolut R, mainly in the region of anchorage with the annulus. The presented computational methods can be used to optimize future TAVR treatment in BAV patients.
Supplementary Material
7. Acknowledgements
This study is partially supported by NIH-NIBIB BRP U01EB026414 grant. This work was also partially supported by the Zimin Institute for Engineering Solution for Advancing Better Lives at Tel Aviv University. The last author gratefully acknowledges the support of the Nathan Cummings Chair of Mechanics.
Footnotes
Publisher's Disclaimer: This Author Accepted Manuscript is a PDF file of a an unedited peer-reviewed manuscript that has been accepted for publication but has not been copyedited or corrected. The official version of record that is published in the journal is kept up to date and so may therefore differ from this version.
Conflict of Interest: The authors declare that they have no conflict of interest.
8 References
- 1.Thubrikar M (1989) The Aortic Valve. CRC Press [Google Scholar]
- 2.Braverman AC, Güven H, Beardslee MA, et al. (2005) The bicuspid aortic valve. Curr Probl Cardiol 30:470–522. 10.1016/j.cpcardiol.2005.06.002 [DOI] [PubMed] [Google Scholar]
- 3.Sievers H-H, Schmidtke C (2007) A classification system for the bicuspid aortic valve from 304 surgical specimens. J Thorac Cardiovasc Surg 133:1226–33. 10.1016/j.jtcvs.2007.01.039 [DOI] [PubMed] [Google Scholar]
- 4.Sabet HY, Edwards WD, Tazelaar HD, Daly RC (1999) Congenitally bicuspid aortic valves: a surgical pathology study of 542 cases (1991 through 1996) and a literature review of 2,715 additional cases. Mayo Clin Proc 74:14–26. 10.4065/74.1.14 [DOI] [PubMed] [Google Scholar]
- 5.Roberts WC, Ko JM (2005) Frequency by decades of unicuspid, bicuspid, and tricuspid aortic valves in adults having isolated aortic valve replacement for aortic stenosis, with or without associated aortic regurgitation. Circulation 111:920–5. 10.1161/01.CIR.0000155623.48408.C5 [DOI] [PubMed] [Google Scholar]
- 6.Beppu S, Suzuki S, Matsuda H, et al. (1993) Rapidity of progression of aortic stenosis in patients with congenital bicuspid aortic valves. Am J Cardiol 71:322–327. 10.1016/0002-9149(93)90799-I [DOI] [PubMed] [Google Scholar]
- 7.Siu SC, Silversides CK (2010) Bicuspid aortic valve disease. J Am Coll Cardiol 55:2789–800. 10.1016/j.jacc.2009.12.068 [DOI] [PubMed] [Google Scholar]
- 8.Cribier A, Eltchaninoff H, Bash A, et al. (2002) Percutaneous transcatheter implantation of an aortic valve prosthesis for calcific aortic stenosis. Circulation 106:3006–8. 10.1161/01.CIR.0000047200.36165.B8 [DOI] [PubMed] [Google Scholar]
- 9.Svensson LG, Ph D, Tuzcu EM, et al. (2011) Transcatheter versus Surgical Aortic-Valve Replacement in High-Risk Patients. N Engl J Med 364:2187–2198 [DOI] [PubMed] [Google Scholar]
- 10.Phan K, Wong S, Phan S, et al. (2015) Transcatheter Aortic Valve Implantation (TAVI) in Patients With Bicuspid Aortic Valve Stenosis – Systematic Review and Meta-Analysis. Hear Lung Circ 24:649–659. 10.1016/j.hlc.2014.12.163 [DOI] [PubMed] [Google Scholar]
- 11.Chiam PTL, Chao VTT, Tan S-Y, et al. (2010) Percutaneous transcatheter heart valve implantation in a bicuspid aortic valve. J Am Coll Cardiol Cardiovasc Interv 3:559–61. 10.1016/j.jcin.2009.11.024 [DOI] [PubMed] [Google Scholar]
- 12.Delgado V, Tops LF, Schuijf JD, et al. (2009) Successful deployment of a transcatheter aortic valve in bicuspid aortic stenosis: role of imaging with multislice computed tomography. Circ Cardiovasc Imaging 2:e12–3. 10.1161/CIRCIMAGING.108.809434 [DOI] [PubMed] [Google Scholar]
- 13.Zegdi R, Lecuyer L, Achouh P, et al. (2010) Increased Radial Force Improves Stent Deployment in Tricuspid but Not in Bicuspid Stenotic Native Aortic Valves. Ann Thorac Surg 89:768–772. 10.1016/j.athoracsur.2009.12.022 [DOI] [PubMed] [Google Scholar]
- 14.Mylotte D, Lefevre T, Søndergaard L, et al. (2014) Transcatheter aortic valve replacement in bicuspid aortic valve disease. J Am Coll Cardiol 64:2330–9. 10.1016/j.jacc.2014.09.039 [DOI] [PubMed] [Google Scholar]
- 15.Bauer T, Linke A, Sievert H, et al. (2014) Comparison of the effectiveness of transcatheter aortic valve implantation in patients with stenotic bicuspid versus tricuspid aortic valves (from the German TAVI Registry). Am J Cardiol 113:518–521. 10.1016/j.amjcard.2013.10.023 [DOI] [PubMed] [Google Scholar]
- 16.Sannino A, Cedars A, Stoler RC, et al. (2017) Comparison of Efficacy and Safety of Transcatheter Aortic Valve Implantation in Patients with Bicuspid vs Tricuspid Aortic Valves. Am J Cardiol 120:1601–1606. 10.1016/j.amjcard.2017.07.053 [DOI] [PubMed] [Google Scholar]
- 17.Hayashida K, Bouvier E, Lefèvre T, et al. (2013) Transcatheter aortic valve implantation for patients with severe bicuspid aortic valve stenosis. Circ Cardiovasc Interv 6:284–91. 10.1161/CIRCINTERVENTIONS.112.000084 [DOI] [PubMed] [Google Scholar]
- 18.Aalaei-Andabili SH, Beaver TM, Petersen JW, et al. (2018) Early and midterm outcomes of transcatheter aortic valve replacement in patients with bicuspid aortic valves. J Card Surg 33:489–496. 10.1111/jocs.13775 [DOI] [PubMed] [Google Scholar]
- 19.Costopoulos C, Latib A, Maisano F, et al. (2014) Comparison of results of transcatheter aortic valve implantation in patients with severely stenotic bicuspid versus tricuspid or nonbicuspid valves. Am J Cardiol 113:1390–3. 10.1016/j.amjcard.2014.01.412 [DOI] [PubMed] [Google Scholar]
- 20.Bosmans B, Famaey N, Verhoelst E, et al. (2016) A validated methodology for patient specific computational modeling of self-expandable transcatheter aortic valve implantation. J Biomech 49:2824–2830. 10.1016/j.jbiomech.2016.06.024 [DOI] [PubMed] [Google Scholar]
- 21.Schultz C, Rodriguez-Olivares R, Bosmans J, et al. (2016) Patient-specific image-based computer simulation for the prediction of valve morphology and calcium displacement after TAVI with the Medtronic CoreValve and the Edwards SAPIEN valve. EuroIntervention 11:1044–1052. 10.4244/EIJV11I9A212 [DOI] [PubMed] [Google Scholar]
- 22.Morganti S, Conti M, Aiello M, et al. (2014) Simulation of transcatheter aortic valve implantation through patient-specific finite element analysis: Two clinical cases. J Biomech 47:2547–2555. 10.1016/j.jbiomech.2014.06.007 [DOI] [PubMed] [Google Scholar]
- 23.Mao W, Wang Q, Kodali S, Sun W (2018) Numerical Parametric Study of Paravalvular Leak Following a Transcatheter Aortic Valve Deployment Into a Patient-Specific Aortic Root. J Biomech Eng 140:101007–101011 [DOI] [PMC free article] [PubMed] [Google Scholar]
- 24.Auricchio F, Conti M, Morganti S, Reali A (2014) Simulation of transcatheter aortic valve implantation: a patient-specific finite element approach. Comput. Methods Biomech. Biomed. Engin 17:1347–57 [DOI] [PubMed] [Google Scholar]
- 25.Gunning PS, Vaughan TJ, McNamara LM (2014) Simulation of self expanding transcatheter aortic valve in a realistic aortic root: Implications of deployment geometry on leaflet deformation. Ann Biomed Eng 42:1989–2001. 10.1007/s10439-014-1051-3 [DOI] [PubMed] [Google Scholar]
- 26.Kandail HS, Trivedi SD, Shaikh AC, et al. (2018) Impact of annular and supra-annular CoreValve deployment locations on aortic and coronary artery hemodynamics. J Mech Behav Biomed Mater 86:131–142. 10.1016/j.jmbbm.2018.06.032 [DOI] [PubMed] [Google Scholar]
- 27.Wang Q, Kodali S, Primiano C, Sun W (2015) Simulations of Transcatheter Aortic Valve Implantation – Implications for Aortic Root Rupture. Biomech Model Mechanobiol 14:29–38. 10.1007/s11103-011-9767-z.Plastid [DOI] [PMC free article] [PubMed] [Google Scholar]
- 28.Bianchi M, Marom G, Ghosh RP, et al. (2016) Effect of Balloon-Expandable Transcatheter Aortic Valve Replacement Positioning : A Patient-Specific Numerical Model. Artif Organs 40:E292–E304. 10.1111/aor.12806 [DOI] [PMC free article] [PubMed] [Google Scholar]
- 29.Bianchi M, Marom G, Ghosh RP, et al. (2019) Patient-specific simulation of transcatheter aortic valve replacement: impact of deployment options on paravalvular leakage. Biomech Model Mechanobiol 18:435–451. 10.1007/s10237-018-1094-8 [DOI] [PMC free article] [PubMed] [Google Scholar]
- 30.El Faquir N, Ren B, van Mieghem NM, et al. (2017) Patient-specific computer modelling – Its role in the planning of transcatheter aortic valve implantation. Netherlands Hear J 25:100–105. 10.1007/s12471-016-0923-6 [DOI] [PMC free article] [PubMed] [Google Scholar]
- 31.De Jaegere P, De Santis G, Rodriguez-Olivares R, et al. (2016) Patient-Specific Computer Modeling to Predict Aortic Regurgitation after Transcatheter Aortic Valve Replacement. JACC Cardiovasc Interv 9:508–512. 10.1016/j.jcin.2016.01.003 [DOI] [PubMed] [Google Scholar]
- 32.Lavon K, Halevi R, Marom G, et al. (2018) Fluid-Structure Interaction Models of Bicuspid Aortic Valves: The Effects of Non-Fused Cusp Angles. J Biomech Eng 140:31010–31010–7. 10.1115/1.4038329 [DOI] [PubMed] [Google Scholar]
- 33.Haj-Ali R, Marom G, Ben Zekry S, et al. (2012) A general three-dimensional parametric geometry of the native aortic valve and root for biomechanical modeling. J Biomech 45:2392–7. 10.1016/j.jbiomech.2012.07.017 [DOI] [PubMed] [Google Scholar]
- 34.Haj-Ali R, Dasi LP, Kim HS, et al. (2008) Structural simulations of prosthetic tri-leaflet aortic heart valves. J Biomech 41:1510–1519. 10.1016/j.jbiomech.2008.02.026 [DOI] [PubMed] [Google Scholar]
- 35.Holzapfel GA, Sommer G, Regitnig P (2004) Anisotropic Mechanical Properties of Tissue Components in Human Atherosclerotic Plaques. J Biomech Eng 126:657–665. 10.1115/1.1800557 [DOI] [PubMed] [Google Scholar]
- 36.Martin C, Sun W (2012) Biomechanical characterization of aortic valve tissue in humans and common animal models. J Biomed Mater Res - Part A 100 A:1591–1599. 10.1002/jbm.a.34099 [DOI] [PMC free article] [PubMed] [Google Scholar]
- 37.Auricchio F, Ferrara A, Morganti S (2012) Comparison and critical analysis of invariant-based models with respect to their ability in fitting human aortic valve data. Ann Solid Struct Mech 4:1–14. 10.1007/s12356-012-0028-x [DOI] [Google Scholar]
- 38.Auricchio F, Taylor RL (1997) Shape-memory alloys: modelling and numerical simulations of the superelastic behavior. Comput Methods Appl Mech Eng 143:175–194. 10.1016/S0045-7825(96)01147-4 [DOI] [Google Scholar]
- 39.Finotello A, Morganti S, Auricchio F (2017) Finite element analysis of TAVI: Impact of native aortic root computational modeling strategies on simulation outcomes. Med Eng Phys 47:2–12. 10.1016/j.medengphy.2017.06.045 [DOI] [PubMed] [Google Scholar]
- 40.Lee JM, Boughner DR, Courtman DW (1984) The glutaraldehyde- stabilized porcine aortic valve xenograft. II. Effect of fixation with or without pressure on the tensile viscoelastic properties of the leaflet material. J Biomed Mater Res 18:79–98. 10.1002/jbm.820180109 [DOI] [PubMed] [Google Scholar]
- 41.Capelli C, Bosi GM, Cerri E, et al. (2012) Patient-specific simulations of transcatheter aortic valve stent implantation. Med Biol Eng Comput 50:183–192. 10.1007/s11517-012-0864-1 [DOI] [PubMed] [Google Scholar]
- 42.Bailey J, Curzen N, Bressloff NW (2016) Assessing the impact of including leaflets in the simulation of TAVI deployment into a patient-specific aortic root. Comput Methods Biomech Biomed Engin 19:733–44. 10.1080/10255842.2015.1058928 [DOI] [PubMed] [Google Scholar]
- 43.Vad S, Eskinazi A, Corbett T, et al. (2010) Determination of Coefficient of Friction for Self-Expanding Stent-Grafts. J Biomech Eng 132:121007–1. 10.1115/1.4002798 [DOI] [PubMed] [Google Scholar]
- 44.Marom G, Haj-Ali R, Raanani E, et al. (2012) A fluid-structure interaction model of the aortic valve with coaptation and compliant aortic root. Med Biol Eng Comput 50:173–82. 10.1007/s11517-011-0849-5 [DOI] [PubMed] [Google Scholar]
- 45.Yoganathan AP, Chandran KB, Sotiropoulos F (2005) Flow in prosthetic heart valves: state-of-the-art and future directions. Ann Biomed Eng 33:1689–94. 10.1007/s10439-005-8759-z [DOI] [PubMed] [Google Scholar]
- 46.De Hart J, Baaijens FPT, Peters GWM, Schreurs PJG (2003) A computational fluid-structure interaction analysis of a fiber-reinforced stentless aortic valve. J Biomech 36:699–712. 10.1016/S0021-9290(02)00448-7 [DOI] [PubMed] [Google Scholar]
- 47.ZHALANW Ei, Onntag SIJOS, Oma MIT, Ryzbon SHSI (2018) Computational Fluid Dynamics Assessment Associated with Transcatheter Heart Valve Prostheses : A Position Paper of the ISO Working Group. 10.1007/s13239-018-0349-y [DOI] [PMC free article] [PubMed] [Google Scholar]
- 48.Marom G (2015) Numerical Methods for Fluid--Structure Interaction Models of Aortic Valves. Arch Comput Methods Eng 22:595–620. 10.1007/s11831-014-9133-9 [DOI] [Google Scholar]
- 49.Vergara C, Viscardi F, Antiga L, Luciani GB (2012) Influence of bicuspid valve geometry on ascending aortic fluid dynamics: a parametric study. Artif Organs 36:368–78. 10.1111/j.1525-1594.2011.01356.x [DOI] [PubMed] [Google Scholar]
- 50.City I (2010) Role of Computational Simulations in Heart Valve Dynamics and Design of Valvular Prostheses. 1:18–38. 10.1007/s13239-010-0002-x [DOI] [PMC free article] [PubMed] [Google Scholar]
- 51.Wang SH, Lee LP, Lee JS (2001) A linear relation between the compressibility and density of blood. J Acoust Soc Am 109:390–6 [DOI] [PubMed] [Google Scholar]
- 52.Aksenov A, Dyadkin A, Pokhilko V (1998) Overcoming of Barrier between CAD and CFD by Modified Finite Volume Method. Asme-Publications-Pvp 377:79–83 [Google Scholar]
- 53.Marom G, Kim H-S, Rosenfeld M, et al. (2012) Effect of asymmetry on hemodynamics in fluid-structure interaction model of congenital bicuspid aortic valves. Conf Proc IEEE Eng Med Biol Soc 2012:637–40. 10.1109/EMBC.2012.6346012 [DOI] [PubMed] [Google Scholar]
- 54.Hamdan A, Kornowski R (2015) Transcatheter aortic valve implantation for bicuspid aortic valve stenosis. Catheter Cardiovasc Interv 86:331–333. 10.1002/ccd.26092 [DOI] [PubMed] [Google Scholar]
Associated Data
This section collects any data citations, data availability statements, or supplementary materials included in this article.