

SUMMARY
Cellular diversity in tumors is key factor for therapeutic failures and lethal outcomes of solid malignancies. Here, we determined the single-cell transcriptomic landscape of liver cancer biospecimens from 19 patients. We found varying degrees of heterogeneity in malignant cells within and between tumors and diverse landscapes of tumor microenvironment (TME). Strikingly, tumors with higher transcriptomic diversity were associated with patient’s worse overall survival. We found a link between hypoxia-dependent VEGF expression in tumor diversity and TME polarization. Moreover, T cells from higher heterogenous tumors showed lower cytolytic activities. Consistent results were found using bulk genomic and transcriptomic profiles of 765 liver tumors. Our results offer insight into the diverse ecosystem of liver cancer and its impact on patient prognosis.
Keywords: Liver cancer, Hepatocellular carcinoma, Cholangiocarcinoma, Single-cell, Tumor heterogeneity, Tumor microenvironments, VEGF, Microenvironmental reprogramming, Biodiversity, Tumor ecosystem
Graphical Abstract
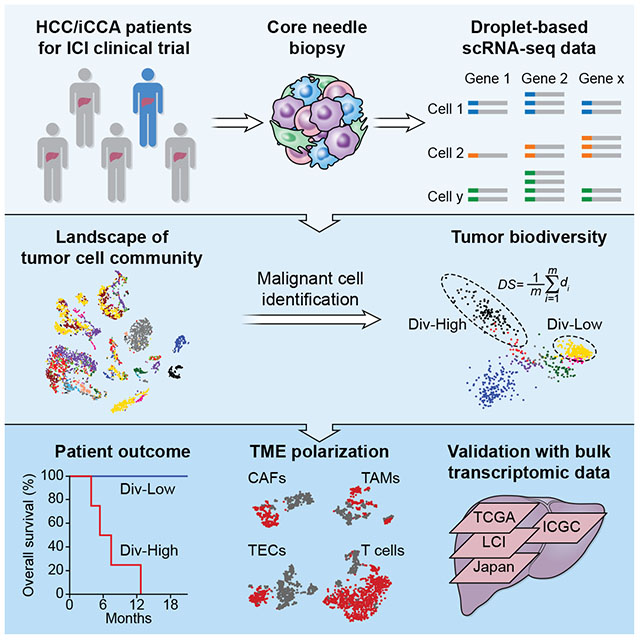
Ma et al. perform single-cell RNA sequencing of primary liver cancers and find heterogeneity in malignant cells and in the tumor microenvironment, the degree of which negatively associates with a patient’s prognosis. They demonstrate that VEGF expression is linked to tumor diversity and T-cell dysfunction.
INTRODUCTION
Cancer is the result of an evolutionary process in which deterministic tumor features are preferentially selected for their survival fitness through external pressures such as adverse tumor microenvironments (TME), while stochastic features are also inadvertently introduced (Maley et al., 2017; McGranahan and Swanton, 2017). Accordingly, complex cancer genomics and TME among each histological type or within single tumors are recognized as common phenomena of solid malignancies. These features create a molecular conundrum where defining effective molecularly-targeted therapeutics is extremely difficult. It also creates a dilemma to effectively discriminate a handful of drivers from thousands of passengers, which further limits the predictability of biomarker-based strategies in precision oncology. Consequently, cancer genomic diversity, especially intratumor heterogeneity (ITH), contributes to therapeutic failure, drug resistance and ultimately lethal outcomes (McGranahan and Swanton, 2015; McGranahan and Swanton, 2017). Molecular characterization of tumor cell communities at the single-cell level (Baslan and Hicks, 2017) may help shed light on the temporal order of cancer drivers, constraints and contingencies to cancer’s evolutionary trajectories. This approach may also offer insight into the collective behaviors and interplays among tumor cells and stromal cells. However, transforming observational studies from single cell analysis into mechanical understanding of cancer evolution poses many challenges (Tanay and Regev, 2017). The ability to define a commonly shared feature reflecting the processes of tumor evolution may result in better characterization of tumor biology and consequently better approaches for cancer intervention.
Primary liver cancer, the second most lethal malignancy worldwide, is etiologically and biologically heterogeneous, comprising many molecularly unique subtypes (Boyault et al., 2007; Jusakul et al., 2017; Lee et al., 2004; TheCancerGenomeAtlasResearchNetwork, 2017; Ye et al., 2003). Hepatocellular carcinoma (HCC) and intrahepatic cholangiocarcinoma (iCCA) are the two most common histologically subtypes, and while clinically they are treated as separate entities, there is evidence that some molecular subtypes of HCC and iCCA share similar tumor biology and key drivers (Chaisaingmongkol et al., 2017; TheCancerGenomeAtlasResearchNetwork, 2017). Accordingly, the hepatic microenvironment could direct lineage commitment in the presence of the same oncogenic drivers to either HCC or iCCA (Seehawer et al., 2018). Therefore, an intimate interaction among tumor cells and the hepatic microenvironment influenced by diverse liver-damaging risk factors exists to drive tumorigenesis. While most of HCC and iCCA are refractory to molecularly-targeted systemic therapeutics, some HCC patients show remarkably durable responses to immune checkpoint inhibitors with a significantly improved overall survival unlike any known molecularly-targeted therapies (Duffy et al., 2017). These promising results suggest that reprogramming of the immune cell milieu to eliminate tumor cells in some patients is an achievable goal. However, it is unclear mechanistically why some patients respond to immunotherapy favorably whereas others do not. What are the collective behaviors and regulations of a tumor cell community with respect to its survival fitness that consequently impact a patient’s prognosis? In this study, we aimed to determine the transcriptomic landscape of tumor cell communities in HCC and in iCCA, and to dissect the impact of tumor transcriptomic diversity on patient outcome.
RESULTS
Single-cell transcriptomic profiling of patient-derived primary liver tumors
To examine biodiversity of the tumor cell community, we generated droplet-based single-cell RNA sequencing (scRNA-seq) profiles of freshly-isolated primary HCC and iCCA from patients who were enrolled at the NIH Clinical Center under the liver moonshot program for immune checkpoint inhibition clinical trials (Figure 1A; Tables 1 and S1). We first analyzed twelve patients as a discovery set (Set 1) and validated the results with an additional sequentially enrolled seven patients (Set 2). We obtained single-cell transcriptomes for 5,115 cells in Set 1 after initial quality controls defined by more than 500 genes detected in each single-cell. We also performed additional quality control steps that include choosing the minimum unique molecular identifiers (UMI) counts, removing doublets, and filtering cells with mitochondrial genes. We found that additional filtering steps did not change an overall cellular composition among these samples (Figure S1A). We conducted normalization and then applied principle component analysis (PCA) on the most variable genes (k = 2,244) across all cells to implement dimensionality reduction by projecting the original transcriptomic profiles to the eigenvector space. With the linearly uncorrelated principal components (PCs, k = 20), we performed t-distributed stochastic neighbor embedding (t-SNE) analysis (Figure 1B), which is a technique well-suited for visualization of high-dimensional data in a two-dimensional space. These analyses revealed that some cases form distinct clusters while others overlap with each other. We found some cells with high expression levels of epithelial marker genes, suggesting a potential tumoral origin (Figure 1C). We further confidently discriminated 702 malignant cells and 4,380 non-malignant cells by inferring large scale chromosomal copy-number variations (CNVs) based on transcriptomes (Figures 1D, S1B, and S1C). The inferred CNV profiles are consistent with the CNV profiles in HCC and iCCA from previously published studies (Chaisaingmongkol et al., 2017; Katoh et al., 2007; Roessler et al., 2012). We further confirmed the successful enrichment of malignant and non-malignant cells based on the epithelial marker genes and liver marker genes, which differ in their expression between malignant cells and stromal cells (Kim et al., 2017; Puram et al., 2017). The expression of these marker genes is highly concordant with the karyotypes of malignant cells and non-malignant ones (Figure 1E).
Figure 1. Dissection of Primary Liver Cancer with scRNA-seq.

(A) Workflow of primary liver tumor collection, processing, sequencing, and data analysis.
(B) t-SNE plot of all the 5,115 single-cells from 12 primary liver cancer patients (indicated by colors). Case ID was named according to histological subtypes of liver cancer, with H and C representing HCC and iCCA respectively.
(C) t-SNE plot of all the single-cells colored by epithelial score. Epithelial score was determined by the average expression of epithelial marker genes.
(D) Large-scale CNVs of single-cells (rows) of a representative tumor (H37). CNVs were inferred from transcriptomes. Red, amplifications; blue, deletions.
(E) Epithelial score (left) and liver marker score (right) of malignant and non-malignant cells. In the boxplots, the central rectangles span the first quartile to the third quartile, with the segments inside the rectangle corresponding to the median. Whiskers extend 1.5 times the interquartile range.
Table 1.
Clinical Information of 19 Primary Liver Cancer Patients Involved in This Study.
| No.a | ID | Sex | Age (year)b | Race | Diagnosis | Stage | Etiology | Biopsy Timingc | Treatmentd | Mode of Actione |
|---|---|---|---|---|---|---|---|---|---|---|
| 1 | H18 | Male | 61 | White | HCC | IV | HCV | 32 weeks | Durvalumab/Tremelimumab | PD-L1/CTLA-4 |
| 2 | H21 | Male | 77 | White | HCC | III | None | Baseline | Resection | N/A |
| 3 | H23 | Female | 41 | White | HCC | III | Fatty Liver | Baseline | Durvalumab/Tremelimumab | PD-L1/CTLA-4 |
| 4 | C25 | Female | 47 | White | iCCA | IV | None | Baseline | Durvalumab/Tremelimumab | PD-L1/CTLA-4 |
| 5 | C26 | Male | 63 | White | iCCA | IV | None | 5 weeks | Durvalumab/Tremelimumab | PD-L1/CTLA-4 |
| 6 | H28 | Female | 63 | Black | HCC | III | HCV | Baseline | Durvalumab/Tremelimumab | PD-L1/CTLA-4 |
| 7 | C29 | Male | 61 | White | iCCA | IV | None | 1 week | Durvalumab/Tremelimumab | PD-L1/CTLA-4 |
| 8 | H30 | Male | 63 | Black | HCC | IV | HCV | Baseline | Durvalumab/Tremelimumab | PD-L1/CTLA-4 |
| 9 | C35 | Female | 64 | White | iCCA | IV | None | 6 weeks | Pembrolizumab | PD-1 |
| 10 | H37 | Male | 65 | Black | HCC | IV | HCV | 6 weeks | Durvalumab/Tremelimumab | PD-L1/CTLA-4 |
| 11 | H38 | Male | 74 | Asian | HCC | I | None | Baseline | Resection | N/A |
| 12 | C39 | Male | 61 | White | iCCA | IV | None | Baseline | Pembrolizumab | PD-1 |
| 13 | H34 | Male | 63 | White | HCC | IV | HCV | Baseline | Durvalumab/Tremelimumab | PD-L1/CTLA-4 |
| 14 | C42 | Male | 67 | Asian | iCCA | IV | None | 6 weeks | Pembrolizumab | PD-1 |
| 15 | C46 | Male | 69 | White | iCCA | IV | None | 6 weeks | Pembrolizumab | PD-1 |
| 16 | C56 | Female | 52 | White | iCCA | IV | None | Baseline | Durvalumab/Tremelimumab | PD-L1/CTLA-4 |
| 17 | C60 | Female | 80 | White | iCCA | III | None | Baseline | Resection | N/A |
| 18 | H65 | Female | 62 | White | HCC | IV | HCV | Baseline | Durvalumab/Tremelimumab | PD-L1/CTLA-4 |
| 19 | C66 | Female | 71 | White | iCCA | IV | None | Baseline | Pembrolizumab | PD-1 |
Patients 1–12 represent the discovery cohort (Set 1), and patients 13–19 stand for the validation cohort (Set 2).
Age at time of tissue collection used for this study.
The interval of treatment and biopsy collection.
Sixteen patients received immunotherapy and tumors were collected by needle biopsy. Other patients underwent resection.
PD-L1: programmed death-ligand 1; CTLA-4: cytotoxic T-lymphocyte-associated protein 4; PD-1: programmed cell death protein 1; N/A: not applicable
Landscape of liver tumor heterogeneity
We performed t-SNE analysis of malignant and non-malignant cells. While malignant cells formed patient-specific clusters, we also observed that tumor cells within a tumor differ, showing evidence of both intertumoral and intratumoral transcriptomic heterogeneity (Figure 2A). In contrast, non-malignant cells were grouped mainly according to their cell types as annotated based on known cell lineage-specific marker genes unique to T cells, B cells, cancer-associated fibroblasts (CAFs), tumor-associated macrophages (TAMs), tumor-associated endothelial cells (TECs) and cells with an unknown entity but express hepatic progenitor cell markers (HPC-like) (Figures 2B and S1D). These results are consistent with previous findings in other tumor types (Patel et al., 2014; Puram et al., 2017). We observed variations of the proportions of malignant cells and non-malignant cells among tumor samples (Figure 2C), which may reflect how tumor biopsies were collected and processed. Considering the number of malignant cells in a tumor, we selected eight samples with ≥ 20 malignant cells for further analysis. The composition of stromal cells was similarly highly heterogeneous among these eight cases, highlighting the complex TME in biopsy samples (Figure 2D). Among them, H23, H30, H37 and H38 are HCC while C25, C26, C29 and C39 are iCCA, as confirmed by histopathology analysis (Figure 2E). Morphological heterogeneity is clearly evident, e.g., giant cell formation in H23 and solid growth of tumor in H30 (Figure 2E). All the evidence supports a heterogeneous landscape of primary liver tumor biopsies commonly observed in the pathology laboratory.
Figure 2. The Nature of Liver Tumor Heterogeneity.

(A) t-SNE plot of 702 malignant cells from eight tumors (indicated by colors) with ≥ 20 malignant cells in each tumor.
(B) t-SNE plot of 4,380 non-malignant cells from 12 tumors (indicated by colors). Cells were annotated based on known lineage-specific marker genes as T cells, B cells, CAFs, TAMs, TECs and HPC-like.
(C) The number of malignant cells (left y-axis) and the proportions of malignant and stromal cells of each tumor (right y-axis). We selected the eight tumors with ≥ 20 malignant cells (above dashed line) for further analysis.
(D) Stromal cell composition of the eight tumors with ≥ 20 malignant cells.
(E) Histopathology of the eight tumors with ≥ 20 malignant cells. Scale bars, 50 μm.
See also Figure S1.
ITH is associated with patient outcome
ITH may reflect the dynamics of cancer cell evolution (Burrell et al., 2013; Gerlinger et al., 2012). To determine a biological impact of ITH, we first examined cell trajectory of malignant cells for each tumor by using reversed graph embedding method (Trapnell et al., 2014). We determined the relationship between neighboring similarities among tumor cells and cell stemness based on the average expression of 10 liver cancer-related stemness genes, i.e., EPCAM, KRT19, PROM1, ALDH1A1, CD24, ANPEP, CD44, ICAM1, CD47, and SOX9 (Figure 3A). We found that neighboring tumor cell similarities vary from tumor to tumor, with some, e.g., C25 and C26, showing cellular trajectories between stem-like and differentiated tumor cells. These results are consistent with our recent study (Zheng et al., 2018). Intratumor transcriptomic biodiversity among tumors could be further revealed by correlation analysis of all malignant cells (Figure 3B). For instance, H38 had a relatively homogenous tumor cell population while C25 had a more diverse transcriptomic profile.
Figure 3. Intratumoral Heterogeneity in Liver Cancer.

(A) Trajectory of malignant cells of each tumor constructed using reversed graph embedding method. Cells were colored by the average expression of 10 stemness related genes (i.e., EPCAM, KRT19, PROM1, ALDH1A1, CD24, ANPEP, CD44, ICAM1, CD47, and SOX9).
(B) Pairwise correlation of all the malignant cells from eight tumors. Each pixel in the heatmap represents the correlation of two cells (the corresponding row and column). Red, positive correlation; blue, negative correlation.
(C) PCA of malignant cells from eight tumors.
(D) Eigenvalue corresponding to each PC from (C).
(E) Diversity score of tumor samples according to the median value of diversity: Div-Low, below median value; Div-High, above median value. Data are represented as mean ± SEM.
(F and G) Overall survival of Div-Low and Div-High groups of patients of Set 1 (F) and Set 2 (G). Log-rank test was preformed to show the statistical difference of the two groups.
(H) Diversity score of HCC and iCCA tumors. Div-High group includes iCCA tumors with larger diversity score than any HCC tumors. Div-Low group includes those HCC tumors with lower diversity score than any iCCA tumors. Div-Median are the remained cases with intermediate diversity score. The analysis includes patients from both Set 1 and Set 2. Data are represented as mean ± SEM.
(I) Overall survival of Div-Low, Div-Median, and Div-High groups of patients. Log-rank test for trend was preformed to show the statistical significance of the survival trend.
See also Figures S2–S4.
To further determine the level of ITH, we developed a method to compute tumor cell-specific transcriptomic diversity scores, an approach to avoid sampling variability on tumor biopsy described above. We used PCs instead of original gene expression profiles of the malignant cells to measure diversity (i.e., ITH) of each tumor, in order to capture major information and reduce noise (Figure 3C). We selected the first 30 PCs based on the eigenvalues as well as a permutation test of significant PCs (Figures 3D and S2A). We also determined the robustness of the diversity score calculation by using different number of PCs (Figure S2B). Moreover, we evaluated the impact of the number of malignant cells on the consistency of diversity scores. While the total number of malignant cells within a tumor has little influence on the degree of the tumor’s transcriptomic diversity, it affects the dispersion of diversity scores (Figures S2C and S2D). We then divided eight tumor samples based on their diversity scores into diversity-high (Div-High) and diversity-low (Div-Low) groups (Figure 3E). Both overall survival and progression-free survival of the patients in the Div-High group is significantly poorer than those in the Div-Low group (Figures 3F and S2E). It implies that high level of transcriptomic diversity tends to gain aggressive tumor characteristics.
To further validate the link between transcriptomic diversity and patient’s prognosis observed in eight patients of the Set 1 cohort, we analyzed an additional two HCC and five iCCA patients sequentially enrolled (Set 2). We retained single-cell transcriptomes with a good data quality for 4,831 cells in Set 2 (Figures S3A–S3C) that include 1,290 malignant cells and 3,541 non-malignant cells with a similarly variable cellular composition as Set 1 (Figures S3D–S3G). We then applied the diversity score calculation method to Set 2. Consistently, both overall survival and progression-free survival of the patients in the Div-High group is significantly worse than those in the Div-Low group (Figures 3G, S3H, and S3I). Noticeably, all Div-High cases were iCCA while Div-Low cases were HCC from the Set 1 cohort. To avoid an ambiguity about a potential batch effect and to further show the robustness of a link between transcriptomic diversity and patient’s prognosis independent of histological types, we also performed a combined analysis of Set 1 and Set 2. Consistently, Div-Low patients had a significantly better survival than Div-High patients (Figure S3J). Interestingly, the transcriptomic diversity-related prognosis is clearly evident in HCC patients (Figure S3K) but not in iCCA patients (Figure S3L). A combined analysis revealed that some iCCA tumors had a significantly higher diversity score than HCC tumors (Figure 3H). We found that five iCCA patients had Div-High tumors with a poor prognosis and two HCC patients had Div-Low tumors with a good prognosis, while the remaining eight patients (four HCC and four iCCA) had similar intermediate diversity scores and an intermediate prognosis (Figure 3I). There was a significant trend for transcriptomic diversity and its association with patient outcome among Div-High, Div-Median and Div-Low groups (Figure 3I). We also determined if transcriptomic diversity is associated with genomic diversity in tumor cells. We found that genomic diversity scores as calculated from CNV data inferred by transcriptome are associated with transcriptomic diversity and patient prognosis (Figures S3M–S3Q).
To further validate if transcriptomic diversity is associated with a patient’s prognosis independently of histological subtypes, we separately validated the above findings using bulk transcriptome data of two iCCA cohorts of 277 patients (i.e., International Cancer Genomics Consortium, ICGC, cohort and Japan cohort) and two HCC cohorts of 488 patients (i.e., Liver Cancer Institute, LCI, cohort and TCGA HCC cohort) that have >100 cases in each cohort with mixed ethnicity and etiology, as bulk tissue transcriptome data may faithfully retain core molecular features of cellular identity that can complement single-cell transcriptome data to provide important molecular insights (Kelley et al., 2018). To accomplish this, we first obtained 15 sets of differentially expressed genes among different clusters derived from density peak clustering in the t-SNE space of malignant cells within each tumor as surrogates of tumor cell biodiversity. We then performed survival prediction of iCCA or HCC cohort using 10-fold cross validation and 1,000 random permutations based on 15 surrogate gene signatures (Figures S4A and S4B), an approach used successfully in previous studies (Dang et al., 2017; Roessler et al., 2010). Hazard ratio was used to measure the strength of diversity-related surrogate signatures among these cohorts. We found that surrogate gene signatures from the Div-High group gave rise to a significantly higher hazard ratios than those of the Div-Low group, irrespective of histological types (Figures S4C–S4F). Since the LCI cohort also has transcriptome data from paired non-tumor tissues, we used them as a control. We found that the above relationship was not observed in paired non-tumor tissues (Figure S4G), suggesting that the link between tumor cell transcriptomic biodiversity and patient’s survival is tumor cell-specific. Thus, our results indicate that intratumoral transcriptomic diversity is associated with patient prognosis in HCC and iCCA.
VEGF expression in malignant cells is associated with TME reprogramming
Non-malignant cells derived from Div-High and Div-Low tumors differ in their transcriptomic profiles in Set 1 (Figure 4A). The difference is further evident when individual cell types were analyzed (Figure 4B), suggesting a possible reprogramming of TME linked to tumor cell biodiversity. B cells were not included for further analysis since most of them were from Div-Low tumors and only very few tumors had a sufficient number of B cells. We sought to determine if Div-High tumor cells may produce cellular factors that could induce TME reprogramming using a strategy depicted in Figure 4C. We focused on cellular factors that were found upstream of at least three of the four cell types evaluated. We further selected cellular factors that were also found in genes differentially expressed between Div-High and Div-Low malignant cells. These analyses revealed a top candidate factor upstream of biodiversity-related genes in TME as vascular endothelial growth factor A (VEGFA) (Table S2), which is specific to CAFs, TAMs and TECs, but not T cells. Consistently, VEGFA was mainly expressed in malignant cells rather than non-malignant cells (Figure 4D). Moreover, VEGFA expression was significantly higher in Div-High tumor cells than in Div-Low tumor cells (Figure 4E). We validated the VEGFA expression patterns in tumor cells using immunohistochemistry analysis (Figure 4F).
Figure 4. Reprogramming of Stromal Cells.

(A) t-SNE plot of non-malignant cells from Div-Low (grey dots) and Div-High (red dots) tumors. Cells from other samples (diversity was not measured for tumor samples with < 20 malignant cells) were removed.
(B) t-SNE plots of CAFs, TAMs, TECs and T cells derived from eight tumors with ≥ 20 malignant cells.
(C) Schematic overview of searching for upstream regulators of stromal cells. Ingenuity Pathway Analysis (IPA) was applied to search for cytokines/growth factors that act as upstream regulators of each non-malignant cell type.
(D) VEGFA expression in malignant and non-malignant cells.
(E) Violin plot of VEGFA expression in malignant cells from Div-Low and Div-High tumors. Student’s t-test was used to show the statistical difference of the two groups.
(F) Immunohistochemistry of H23 (Div-Low, top) and C29 (Div-High, bottom) stained for VEGFA. Scale bar, 20 μm.
(G) Heatmap of hypoxia-related genes. Pearson correlation coefficient of HIF1A and a specific hypoxia-related gene was provided if more than 10% of all the malignant cells expressing both HIF1A and the hypoxia-related gene.
(H) Violin plots of HIF1A and the average expression of hypoxia-related genes in malignant cells from Div-Low and Div-High tumors. Student’s t-test was used to show the statistical difference of the two groups.
(I) PCA of TECs, TAMs, CAFs and T cells based on genes from VEGFA downstream signaling pathway. Hotelling’s T-squared test was used to test the difference of multivariate means of Div-High and Div-Low groups. *** indicates p value < 0.001.
In all violin plots, white boxes span the first quartile to the third quartile; red lines in the white boxes indicate the median; dots represent outliers beyond 1.5 times the interquartile range; the width of a violin plot indicates the kernel density of the expression values.
Since VEGFA is a direct target of hypoxia-inducible factor 1-alpha (HIF1A), a key factor sensing hypoxia, we determined if Div-High tumors are more hypoxic than Div-Low tumors in Set 1. We found that expression levels of hypoxia-related genes (Buffa et al., 2010) are much higher in tumor cells from the Div-High group than that of the Div-Low group (Figure 4G). VEGFA was the top ranking gene for its correlation with HIF1A. Consistently, the levels of HIF1A and hypoxic signaling were much higher in Div-High than Div-Low tumors (Figure 4H). This is consistent with the literature that hypoxia may directly induce both mRNA and protein levels of HIF1A, consequently activating its downstream hypoxia signaling (Semenza, 2012; Wiener et al., 1996). We also determined the levels of hepatocyte growth factor (HGF) in various cell types since VEGFA may affect tumor-stromal-cell interaction via HGF (Horwitz et al., 2014; LeCouter et al., 2003). Consistently, high levels of VEGFA were positively associated with increased HGF in Div-High samples (Figures S5A and S5B). To further link biological/molecular features of VEGFA to TME reprogramming, we investigated VEGFA downstream signaling as its functional surrogate (www.bio-rad.com/en-us/prime-pcr-assays/pathway/development-vegf-signaling-via-vegfr2-generic-cascades) in non-malignant cells. We first performed correlation analysis between VEGFA and its downstream genes in nontumors using bulk transcriptomic data in the LCI cohort, which has the largest non-tumor liver transcriptome data from HCC patients available, and selected positively-correlated genes for further analysis (Table S3). We then performed PCA analysis based on the refined genes for each non-malignant cell type. Consistently, we found that the VEGFA functional surrogate genes could discriminate Div-High and Div-Low TECs, TAMs and CAFs but not T cells (Figure 4I). Similar results were found in the Set 2 samples (Figures S5C–S5G).
To further determine the robustness of an association between VEGFA as well as its downstream signaling and TME reprogramming, and its association with patient’s prognosis, we modeled VEGFA signaling in bulk transcriptome data. Diversity score of bulk tumor samples was determined using a recently established method (Kwon et al., 2019). A positive correlation of tumor diversity and VEGFA expression was observed in HCC, but not non-tumor samples, of both TCGA and LCI cohorts (Figure S5H). Moreover, the VEGFA functional surrogate genes, as well as the differentially-expressed gene signatures of TECs, TAMs and CAFs, could significantly discriminate Div-High and Div-Low tumors in TCGA cohort, regardless of the number of principle components used, further implicating the role of VEGFA in affecting the surrounding TME (Figure S5I). Noticeably, these gene signatures cannot significantly discriminate Div-High and Div-Low tumors in LCI cohort, which may be due to low number of tumor samples (diversity score was only available for 64 HCC samples of LCI cohort, see Methods). In addition, increased VEGFA expression in tumors was associated with a significant reduction in overall survival in iCCA and HCC patients from ICGC iCCA cohort and LCI HCC cohort, and of borderline significance in TCGA HCC cohort (Figure S5J). In contrast, an inverse association was found in non-tumor transcriptome of the LCI cohort. Taken together, our results are consistent with the hypothesis that High-Div malignant cells may produce VEGFA, which in turn may reprogram surrounding TME to affect a patient’s prognosis.
T cells derived from Div-Low tumors manifest cytolytic activities
Because T cells derived from Div-Low and Div-High tumors showed completely different transcriptomic profiles (Figures 4B and S5C), we further analyzed the T-cell transcriptome in Set 1. We identified six subtypes of T cells by using a shared nearest neighbor (SNN) modularity optimization-based clustering algorithm (Figure 5A), which determines clusters by optimizing the modularity function of SNN graph constructed based on k-nearest neighbors (Waltman and Van Eck, 2013). Some of these subtypes could be identified as CD4+, CD8+ and Treg cells based on known lineage-specific marker genes (Figures 5A and S6A). We also determined trajectory of T cells based on the reversed graph embedding method. We found CD8+ and CD4+ T cell branches from the trajectory tree where Div-High T cells tend to be aggregated at the trunk of the tree while Div-Low T cells were accumulated at the branches of the tree (Figures 5B and S6B). Given the differences between T cells in Div-Low and Div-High tumors, we performed gene set enrichment analysis based on the hallmark pathway gene signatures. The enriched pathways are mostly consistent between CD8+ and CD4+ T cells (Figure 6A). The upregulated pathways in T cells derived from Div-High tumors include epithelial-mesenchymal transition (EMT) and myogenesis. Further analysis of the enriched pathways revealed that the top ranking gene is TIMP1 for EMT and IGFBP7 for myogenesis predominantly elevated in CD8+ T cells from Div-High tumors compared to Div-Low tumors (Figure S6C; Tables S4 and S5). In contrast, T cells derived from Div-Low tumors were enriched in allograft rejection, oxidative phosphorylation and fatty acid oxidation, indicating possible reaction to tumor-encoded neo-epitopes (Lambrechts et al., 2018). In addition, this groups of T cells were enriched in IFNα/IFNγ response and MYC activity, as well as cell proliferation (G2/M checkpoint and E2F targets), suggesting possible cytolytic activities of T cells derived from Div-Low tumors (Huber and David Farrar, 2011; Kolumam et al., 2005).
Figure 5. Analysis of T cells Derived from Div-Low and Div-High Tumors.

(A) t-SNE projection of T cells from eight tumors with ≥ 20 malignant cells.
(B) Single-cell trajectory analysis of T cells. CD4+ and CD8+ T-cell branches were revealed from the cell trajectory.
See also Figure S6.
Figure 6. Cytolytic Activities of T cells from Div-Low Tumors.

(A) Gene set enrichment analysis of CD8+ and CD4+ T cells. For each type of T cells, normalized enrichment score (NES) was used to indicate the enrichment of the related pathways. Pathways that were significantly enriched in either CD8+ or CD4+ T cells were listed.
(B) Violin plots of T-cell cytotoxicity related genes and immune checkpoint related genes of CD8+ and CD4+ T cells from Div-Low and Div-High tumors. The width of a violin plot indicates the kernel density of the expression values.
(C) Volcano plots of differential expression genes of CD8+ and CD4+ T cells derived from Div-Low and Div-High tumors. Genes from (B) were labeled if p value < 0.05.
Consistent with the literature that activated T cells expressed high level of granzyme and immune checkpoint molecules (Lambrechts et al., 2018), we found that T-cell cytotoxicity related genes (e.g., GZMA, GZMB, GZMH and PRF1) were highly expressed in both CD8+ and CD4+ T cells derived from Div-Low tumors in comparison with those from Div-High tumors (Figures 6B and 6C). Noticeably, immune checkpoint molecules (e.g., PDCD1, IFNG, and NKG7) also showed higher expression in T cells in Div-Low tumors than in Div-High tumors, implying that tumors with such a feature may be candidates for immune checkpoint inhibition therapies.
Intratumoral immune cell infiltrate has been associated with HCC prognosis in previous studies (Chew et al., 2012; Unitt et al., 2006). More detailed analyses of infiltrating T cells in HCC and non-small-cell lung cancer were recently carried out by the scRNA-seq approach (Guo et al., 2018; Zheng et al., 2017). To further explore the landscape of infiltrating T cells, we performed differential gene expression analysis among different clusters of T cells in HCC and iCCA. We found several potentially unique T-cell subsets, i.e., CD4+CD69+, CD4+ANXA1+, CD4+CTLA4+, CD4+GZMA+, CD8+GZMK+ and CD8+GZMA+, to be associated with Div-high tumors in Set 1 (Figure S6D; Table S6). Consistent data were found in Set 2 (Figures S6D and S6E; Table S6), as well as a recent study of the landscape of infiltrating T cells in HCC (Zheng et al., 2017). Interestingly, Treg cells were much higher in Div-High tumors than Div-Low tumors in both Set 1 and Set 2 (Figures S6F and S6G). However, exhausted T cells (Texhau) had a mixed result among two different sets.
To further validate the above results, we investigated the association of T-cell cytolytic activities and patient outcomes using bulk transcriptome data. We selected T-cell activation related genes from CD8+ or CD4+ T cells based on differential gene expression analysis and determined their association with a patient’s prognosis (Table S7). Consistently, both CD8+ and CD4+ T-cell activity related genes are associated with patient outcomes in ICGC, LCI, and TCGA cohorts (Figures S6H and S6I). Collectively, our results indicate that the T cell landscape is complex in HCC and iCCA and that certain T-cell subsets are tightly associated with patient’s prognosis. Our results also suggest a different role of T cells in Div-High and Div-Low tumors, which may serve as an indicator of tumor immune surveillance status.
DISCUSSION
Chronic inflammation due to diverse etiological factors and genomic heterogeneity are hallmarks of HCC and iCCA (Wang and Thorrgeirsson, 2014). ITH may be key factor contributing to poor outcomes of patients with HCC and iCCA refractory to molecularly-targeted chemotherapeutics. Single-cell analysis provides a viable strategy to understand the dynamics of ITH at the single cell level, which may help to understand collective behavior and regulatory mechanisms within a tumor ecosystem. scRNA-seq has been used in characterizing tumor ecosystems of leukemia, lung cancer, glioma, colon cancer, head and neck cancer, breast cancer as well as tumor immune cell landscape (Azizi et al., 2018; Giustacchini et al., 2017; Li et al., 2017; Puram et al., 2017; Tirosh et al., 2016b; Venteicher et al., 2017; Zheng et al., 2017). Limited single cell transcriptome studies are available for liver cancer. In this study, we generated scRNA-seq profiles of 19 primary HCC and iCCA patients, and developed a method to measure the degree of ITH that can be linked to prognosis. We found evidence of VEGF signaling in reprogramming TME to promote an immune suppressive milieu that may favor tumor progression. Our study suggests that measuring tumor cell biodiversity could be a viable approach to determine shared features of tumor evolution in predicting liver tumor aggressiveness. Our findings may provide a mechanistic explanation as why some patients respond while other do not and provide a rationale for a combination therapy of immune checkpoint inhibitors and anti-VEGF to improve therapeutic efficacies.
ITH is a widespread feature for a majority of solid tumors. While no data is currently available for iCCA, intratumoral genomic heterogeneity is evident in HCC (Hou et al., 2016; Ling et al., 2015; Xue et al., 2016; Zheng et al., 2018). Pan-Cancer analysis has revealed that somatic clone number and copy number variation burden are universal prognostic markers and established the concept for ITH as a source for natural selection to drive carcinogenesis and acquired therapeutic resistance (Andor et al., 2016). As tumor evolution is inevitable, it is expected that molecularly-targeted therapy specific to tumor cells may facilitate this process by selecting resistant clones (Maley et al., 2017). Consistently, genetic drift has been shown to be responsible for clinical acquired resistance to FGFR inhibition in patients with FGFR2 fusion–positive iCCA (Goyal et al., 2017). This phenomenon is not unique to iCCA but a universal feature for most, if not all, solid tumors that have a complex molecular composition (Blakely et al., 2017; Chong and Janne, 2013). This may explain why currently available molecularly targeted therapeutics to cancer cells in some aggressive tumor types such as HCC and iCCA only provide transient response, offering patients very little in regard to extended survival. This is in a sharp contrast to liquid cancers such as pediatric acute lymphoblastic leukemia (ALL) in which oncological advances due to successful uses of multi-agent chemotherapy and targeted therapy regimens have increased the 10-year survival rate from less than 10% in the 1960s to over 90% today (Hunger and Mullighan, 2015). A key difference between some solid tumors and pediatric ALL is that ALL has a more simplified genetic composition than solid tumors and that tumor evolution is not subject to population-based selection pressure (Alexandrov et al., 2013; Hunger and Mullighan, 2015). It seems that the greater a genomic complexity a tumor has, the higher likelihood it will develop resistance to targeted therapy, resulting in a more aggressive clinical phenotype. Thus, targeting a common mechanism that is least likely to be influenced by tumor genomic heterogeneity may be a viable strategy.
It should be noted that the conclusion of the current study is mainly is related to transcriptomic heterogeneity, while ITH is often discussed in the context of cancer genomic diversity linked to tumor evolution (Burrell et al., 2013; Gerlinger et al., 2012; McGranahan and Swanton, 2017). However, current technologies for single-cell whole genome or whole exome sequencing are not optimal because of a high false positivity rate. While single-cell CNV profiling has been successfully used to measure somatic copy number alterations in malignant cells, how well its resolution is linked to ITH needs to be further explored. Instead, CNV profiling inferred by transcriptome has been used successfully to differentiate malignant cells from non-malignant cells and is a reliable method to estimate genomic alteration (Neftel et al., 2019; Patel et al., 2014; Puram et al., 2017; Tirosh et al., 2016a). In this study, we found that transcriptomic diversity correlate with genomic diversity and with patient’s prognosis. We suggest that single-cell-based transcriptomic diversity may be closely related to intratumor genomic diversity and may serve as an alternative to determine intratumor genomic heterogeneity.
Could heterogeneous tumor cell population produce common factors that could reprogram TME to create an environment to support tumor cell survival? Our study revealed that VEGF may be a key player that is associated with reprogramming of CAFs, TAMs and TECs. It is known that hypoxia may directly induce HIF1A transcription as well as its protein level, consequently activating its downstream hypoxia signaling (Semenza, 2012; Wiener et al., 1996). Mechanistically, PI3K/AKT and NF-κB pathways have been demonstrated to be responsible for induction of hypoxia-induced HIF1A mRNA expression (Belaiba et al., 2007; Rius et al., 2008). Our results are consistent with the hypothesis that hypoxia-induced VEGF in Div-High tumors may induce polarization of CAFs, TAMs and TECs, and drive tumor progression (Goel and Mercurio, 2013; Kalluri, 2016; Pollard, 2004). The function of VEGF has been shown not to be limited to angiogenesis and vascular permeability (Goel and Mercurio, 2013). Because of its potential effect on the function of immune cells and other stroma cells such as fibroblasts, it has been recommended to improve immunotherapy outcomes with anti-angiogenic treatments such as by drugs targeting VEGF-dependent signaling (Khan and Kerbel, 2018). Although speculative, normalization of vasculature induced by anti-vascular agents might augment immune cell trafficking or antigen presentation. Promising results in renal cell carcinoma have been obtained for clinical activity and molecular correlates of response to atezolizumab in combination with bevacizumab (McDermott et al., 2018). In addition, clinical studies for combination therapy with immune checkpoint inhibitors and vascular targeting agents for all-comers have shown promising effects for patients with HCC in a phase Ib study (), which leads to two open phase III trials in HCC ( and ). Our results provide a mechanistic rationale for a combination therapy of immune checkpoint inhibitors and anti-VEGF and suggest that measuring tumor ecosystem may be a viable approach to guide immune-based therapy. It should be noted that while we found a diversity-associated T-cell type, upstream analysis did not disclose any tumor factor directly linked to its polarization. It is plausible that tumor factors may influence TME to induce stromal-associated TGFβ signaling to restrict T-cell infiltration thereby attenuate tumor response to immune checkpoint blockade (Mariathasan et al., 2018).
STAR METHODS
CONTACT FOR REAGENT AND RESOURCE SHARING
Further information and requests for resources and reagents should be directed to and will be fulfilled by the Lead Contact, Xin Wei Wang (xw3u@nih.gov).
EXPERIMENTAL MODEL AND SUBJECT DETAILS
Fresh HCC and iCCA biopsies and resected tumors were collected with informed consent from patients who were enrolled at NIH Clinical Center for immune checkpoint inhibition studies (). Among the 19 specimens, 16 were collected by needle biopsy while the rest were from surgical resection. This study was approved by the ethics committee of the National Institutes of Health.
METHOD DETAILS
Preparation of single-cell suspensions
Core needle or resected tumor biopsies were collected in RPMI 1640 media supplemented with penicillin/streptomycin and immediately transferred for dissociation within minimum ischemic time. On arrival, each sample was placed in a sterile Petri dish on ice. Fat, fibrous and necrotic areas were removed, and the tissue was subsequently minced to smaller pieces of less than 3 mm. Sample pieces were transferred to a gentleMACS C Tube (Miltenyi #130-093-237) containing 5 ml digestion enzyme mix previously prepared according to the kit user guide (Tumor dissociation Kit from Miltenyi Biotech # 130-095-929). The C tube was then placed on a gentleMACS™ Octo Dissociator for mechanical dissociation using program h_tumor_01. Upon run completion, the sample was incubated for 30 min at 37 °C under continuous low shaking. Subsequently, the sample was filtered using a 70-gm nylon mesh (Miltenyi # 130-095-823). 10 μl of this cell suspension was counted by Trypan Blue to determine the concentration of live cells. The sample was then centrifuged at 300×g and 4 °C for 5 min, and the supernatant was discarded. The cell pellet was resuspended in 1 ml freezing media (Gibco) for long term cryopreservation in liquid nitrogen. Throughout the dissociation procedure, cells were maintained on ice whenever possible, and the entire procedure was completed in less than 1 hr.
Single-cell capture and cDNA library preparation
Cryopreserved single-cell suspensions were promptly thawed and prepared as outlined by the 10x Genomics Single Cell 3′ v2 Reagent Kit user guide. Briefly, the samples were washed and re-suspended in PBS + 0.04% BSA. Sample viability was assessed and a final concentration of 1,200 cells/ql of sample was adjusted. The estimated number of cells of each sample used for sequencing was listed in Table S1. The cDNAs was obtained after the GEM generation and barcoding, followed by GEM RT reaction and cleanup steps. Purified cDNA was amplified for 14 cycles before being cleaned up using SPRIselect beads (Beckman). Samples were then run on a Bioanalyzer (Agilent Technologies) to determine cDNA concentration. cDNA libraries were prepared as recommended by 10x Genomics v2 user guide with appropriate modifications to the PCR cycles based on the calculated cDNA concentration. For samples preparation on the 10x Genomics platform, the Chromium Single Cell 3′ Library and Gel Bead Kit v2 (PN-120237), Chromium Single Cell 3′ Chip kit v2 (PN-120236) and Chromium i7 Multiplex Kit (PN-120262) were used.
Droplet-based scRNA-seq
The molarity of each library was calculated based on library size measured using a Bioanalyzer (Agilent Technologies). Libraries were pooled in 2 or 3 samples per run and normalized to a final loading concentration. Each run was sequenced on 7 NextSeq runs with v2 chemistry. The sequencing run was setup as 26 cycles + 8 cycles + 57cycles non-symmetric run. Demultiplex was done allowing 1 mismatch in the barcodes. A median sequencing depth of 50,000 reads/cell was targeted for each sample. Libraries were sequenced on an Illumina NextSeq 500 at Frederick National Laboratory for Cancer Research Sequencing Facility in Frederick, MD. The analyses of alignment, tagging, gene and transcript counting, were performed using 10x genomics CellRanger pipeline (version 1.0.1). All samples had excellent sequencing yield. The raw yield was ranging from 121–255 million passes filtered reads with above 73% Q30 bases for both index and cDNA reads. Based on the QC statistics, samples were marked as ‘good’ qualities with the total number genes per cell above 18,000, UMI counts per cell greater than 5,000, and gene counts per cell above 1,000. All scRNA-seq data were submitted to the Gene Expression Omnibus (GEO) public database at NCBI (GEO Series GSE125449).
scRNA-seq data processing
Sequencing depth of tumor samples were normalized by using CellRanger (version 2.0.2). Genes were retained with detected expression in more than 0.1% of all the cells. Cells with less than 500 detected genes were excluded. A total of 5,115 cells passed the initial quality control. We also performed additional quality control steps including choosing the minimum UMI counts (> 700), removing doublets (0.4%, according to the multiplet rate provided by 10x Genomics based on the number of cells loaded and recovered), filtering cells with the percentage of mitochondrial genes (> 20%) (Vento-Tormo et al., 2018). We found that additional filtering steps did not change an overall cellular composition among these samples. The total number of transcripts in each single-cell was normalized to 10,000, followed by log transformation, i.e., NormalizedExp = log (RawExp/TotalExp * 10000+1), where RawExp, NormalizedExp and TotalExp represent the raw gene expression value, normalized gene expression as well as the total expression of all genes in a single-cell, respectively. Highly variable genes (k = 2,244) were detected according to average expression (between 0.05 to 3) and dispersion (above 0.5) of the genes, followed by data scaling (subtracting the average expression) and centering (divided by standard deviation). Those variable genes were considered accounting for cell-to-cell differences, and were further used for PCA. The first 20 PCs were applied for t-SNE analysis according to the eigenvalues (data not shown). We used Seurat package (version 2.3.0) (Butler et al., 2018) in R (version 3.4.3) to perform data filtering (both gene and cell), normalization, PCA and t-SNE.
CNV estimation
We inferred CNVs of each single cell by using transcriptomic profiles. CNVs were estimated based on two major steps, initial CNVs (CNVi) calculation and final CNVs (CNVf) estimation. CNVi was used for putative non-malignant cell selection, which would be considered as reference cells in the final estimation of CNVs. As described in (Patel et al., 2014; Puram et al., 2017; Tirosh et al., 2016a), genes were first sorted according to their genomic location at each chromosome, and then a sliding window of 100 genes was applied to calculate the average relative expression values within each chromosome to derive the CNV In this way, gene-specific patterns could be eliminated and the derived profiles (i.e., moving average) mainly reflect CNVs. We also restricted the relative expression values to [−3, 3] (values beyond the bounds were replaced with bound values), in order to avoid possible influence of any genes with extreme expression on the moving average. We defined CNV score of each single-cell as the sum of squared CNVi across all windows. Additionally, we determined CNV correlation score by computing the correlation of the CNVi of a single-cell and the average CNVi of the single-cells with top 2% CNV scores from the same tumor. Putative non-malignant cells were then defined as those with CNV score and CNV correlation score less than 40th percentile of CNV scores and CNV correlation scores of all the single-cells. Those putative non-malignant cells were used as a baseline to recalculate the CNV, i.e., CNVf. We also recalculated CNV score and CNV correlation score of each single-cell. Malignant cells were defined as those with CNV score above 80th percentile of all CNV scores and CNV correlation score above 0.4. Confidently defined non-malignant cells were those below the two cutoffs. The rest of the cells were also considered as non-malignant cells in this study.
Epithelial score and liver marker score
We used the expression of epithelial marker genes as well as liver marker genes to further confirm the discrimination of malignant and non-malignant cells. Epithelial score was calculated as the average expression of 13 epithelial marker genes (13 of the14 epithelial marker genes from (Puram et al., 2017) were detected in more than 0.1% of all the cells in our study) obtained from (Puram et al., 2017). Likewise, liver maker score was defined based on 24 known liver markers in (Kim et al., 2017).
Identification of non-malignant cell types
We extracted transcriptomic data of non-malignant cells (n = 4,380) from the normalized expression profiles of all the single-cells (n = 5,115). Similar to the analysis of all the cells, we first selected variable genes (k = 2,122) across non-malignant cells, based on criteria of average expression (between 0.05 to 3) and dispersion (above 0.5) of the genes. Then we performed data scaling followed by dimension reduction with PCA. The first 10 PCs were selected for t-SNE analysis. Different subclusters of single-cells were revealed from the t-SNE plot. We annotated the cells based on known cell lineage-specific marker genes as T cells (CD2, CD3E, CD3D, CD3G), B cells (CD79A, SLAMF7, BLNK, FCRL5), TECs (PECAM1, VWF, ENG, CDH5), CAFs (COL1A2, FAP, PDPN, DCN, COL3A1, COL6A1), TAMs (CD14, CD163, CD68, CSF1R) as well as HPCs (EPCAM, KRT19, PROM1, ALDH1A1, CD24).
Constructing single-cell trajectories
We constructed single-cell trajectory of each tumor by using reversed graph embedding method implemented in R Monocle package (version 2.6.3) (Trapnell et al., 2014). Monocle learns the transcriptional changes of single-cells and constructs a trajectory that mainly reflects the progress of cells moving from the starting state (i.e., the start of the trajectory). Monocle uses CellDataSet object to store single-cell gene expression data as well as analysis results. Thus, we created a CellDataSet object for single-cells of each tumor with the parameter expressionFamily as negbinomial. Two major steps were then performed for single-cell trajectory construction. The first step was to detect genes that could provide important information in shaping the trajectory. To this end, we conducted PCA and t-SNE (the first 10 PCs was used) based on the genes expressed in at least 10% of all the cells of each tumor, and further applied density peak clustering method to identify clusters in the t-SNE space (Rodriguez and Laio, 2014). Differential gene expression analysis was performed among clusters. The derived top 1,000 genes were considered crucial for defining the progress of cells. The second step was dimensionality reduction and trajectory construction with the obtained genes. Reversed graph embedding technique was applied in this process, by projecting cells to a low dimensional space while simultaneously learning smooth tree-like manifold as well as assigning cells onto the manifold (Mao et al., 2017; Qiu et al., 2017). We also constructed single-cell trajectory of T cells (Set 1, n = 998), based on the same process with the same Monocle parameters as tumors. Additionally, we detected genes that followed similar kinetic trends along the CD8+ T-cell trajectory as well as CD4+ T-cell trajectory from the starting state, with the utilization of differentialGeneTest function in Monocle. The top 50 genes (selected based on q value) of CD8+ and CD4+ T cells were used for drawing heatmap (Figure S6B). Hierarchical clustering was applied to cluster genes into four subgroups according to the expression patterns.
Correlation analysis of malignant cells
We used the pairwise correlation of malignant cells (n = 702) to further evaluate tumor biodiversity. Pearson’s correlation coefficients were applied to measure the similarity of single-cells. The correlation coefficients were calculated based on variables genes (k = 355) across all malignant cells, selected by using the average expression (between 0.5 to 3) and dispersion (above 0.5) of the genes. The Heatmap function in R ComplexHeatmap package (version 1.17.1) (Gu et al., 2016) was used to show the correlation.
Diversity score
We defined diversity score to measure the degree of intratumoral heterogeneity. Diversity score of a tumor was calculated based on the gene expression profiles of malignant cells within the tumor. We employed PCA to project the original expression profiles of all malignant cells to the eigenvector space to derive PCs, which could capture major information and reduce noise. Suppose we are given a tumor sample of m malignant cells, with each malignant cell having n features (i.e., PCs). Then the ith malignant cell can be represented with (xi1, xi2, …, xin), and the centroid (arithmetic mean of PCs of all malignant cells within the corresponding tumor) of the malignant cells within the tumor is represented with (u1, u2, …, un). We defined the diversity score of the tumor as the average distance of all malignant cells within the tumor to the centroid, which could be calculated as
| (1) |
To reduce the impact of extreme values on diversity score calculation, we used mean ± 3*standard deviation to detect extreme values, if there was any. Cells with all the first three features (i.e., PCs) beyond the range of [μj−3σj, μj+3σj], where μj and σj represent the mean and standard deviation of the jth feature of a tumor, were considered extreme value-related cells and were excluded for diversity calculation. For all the samples involved in this study, two single-cells were detected with extreme values. Diversity score based on inferred CNV profiles were measured in the same way as diversity measured from transcriptome above.
Validation dataset (Set 2)
To validate the association of tumor diversity and patient prognosis, we analyzed single-cell transcriptomic profiles obtained from additional seven primary liver cancer patients (two HCC and five iCCA). Single-cell suspensions and cDNA library preparation were the same as described above. Samples were sequenced in one run with Illumina HiSeq 4000. The sequencing was setup as 26 cycles + 98 cycles non-symmetric run. A total of 4,831 cells passed quality control criteria as described above. We performed the same analyses as Set 1, including PCA, tSNE, separation of malignant and non-malignant cells, as well as non-malignant cell annotation. To make the diversity score comparable with Set 1, we used the same set of variable genes as Set 1 to perform PCA of single-cells from Set 2, followed by diversity score calculation. We divided the seven samples according to the median value of diversity score into two groups, i.e. Div-Low (below median value) and Div-High (above or equal to median value).
Overall survival prediction
BRB-ArrayTools (version 4.6.0) (Simon et al., 2007) developed by Biometric Research Branch of National Cancer Institute was applied for overall survival analysis of two CCA cohorts (i.e., Japan cohort and ICGC cohort) and two HCC cohorts (i.e., TCGA cohort and LCI cohort). The survival information was available for 162 patients of Japan cohort, 115 patients of ICGC cohort, 249 patients of TCGA cohort, and 239 patients of LCI cohort (including survival information for 231 patients with paired non-tumor tissues). We performed survival risk prediction based on tumor biodiversity related genes (p value < 0.001, expressed in > 10% cells in a tumor), which were derived from differential gene expression analysis among subclusters within each tumor. Overall, we obtained 15 surrogate gene sets, because we analyzed 15 tumors (with malignant cells ≥ 20, 8 cases from Set 1 and 7 cases from Set 2) in this study. For each cohort, we built cox proportional hazards model upon the PCs of each surrogate gene signature. Ten PCs was applied for all surrogate gene signatures, except the H23 derived signature (two PCs were adopted as three genes were derived). Kaplan-Meier curves were provided with two risk groups (high versus low) obtained based on 10-fold cross-validation. A total of 100 times of permutations were performed for log-rank test. Statistical significance was indicated by log-rank p value and permutation p value. We also carried out overall survival analysis by using CD8+ and CD4+ T-cell activity related genes. The same procedure with same parameters were used for BRB-ArrayTools.
Upstream analysis of stromal cells
IPA (Krämer et al., 2013) was used to search for upstream regulators of stromal cells based on the variable genes of CAFs (k = 204 genes), TAMs (k = 204 genes), TECs (k = 180 genes), and T cells (k = 77 genes), which were derived based on the average expression (between 0.1 and 3) and dispersion (above 2) of the genes. With the upstream regulators obtained from IPA, we selected the upstream cytokines/growth factors (p value < 0.05) of each non-malignant cell type. Then we focused on the cytokines/growth factors found in at least three of the four cell types evaluated, and further filtered them by using the differential expression genes (adjusted p value < 0.05) of Div-High and Div-Low malignant cells. The finally derived factors may represent the common regulations of stromal cells by malignant cells.
VEGFA and its downstream signaling in bulk transcriptomic data
To validate the association of VEGFA expression and tumor biodiversity in bulk transcriptomic data, a prerequisite was the evaluation of the degree of tumor diversity. We used an algorithm developed by our group to determine the diversity score (Kwon et al., 2019), which was estimated as the correlation of gene expression and CNVs of each tumor sample. Because CNV data was available for 364 samples of TCGA cohort and 64 samples of LCI cohort, and thus we only measured diversity of these samples. Japan cohort and ICGC cohort were not involved in this section as CNV data was not available. The partition of Div-High and Div-Low groups was based on the median diversity score of tumors in each cohort. Student’s t-test was applied for statistical comparison of VEGFA expression in Div-High and Div-Low tumors. Pearson’s correlation coefficients were used to measure the linear correlation of tumor diversity and VEGFA expression. We adopted one-sided hypothesis here considering the obtained relationship of VEGFA expression and tumor diversity in single-cells. Since both TCGA and LCI cohorts have transcriptomic data of paired non-tumor tissues, we used them as control. The number of matched samples (tumor and non-tumor) in TCGA cohort and LCI cohort is 50 and 60, respectively. We used the diversity score of a tumor as measurement of diversity of the corresponding non-tumor. Similar statistical comparisons were performed for the non-tumor samples. We also performed PCA on the VEGFA functional surrogate genes for tumor and nontumor samples in TCGA and LCI cohorts, respectively. Additionally, we used the differential expression genes of TECs, TAMs and CAFs to discriminate Div-High and Div-Low tumors, which could further provide evidence for the reprogramming of VEGFA downstream signaling in stromal cells. The difference of multivariate means of Div-High and Div-Low tumor groups was tested by Hotelling’s T-squared test with hotelling.test function R Hotelling package.
T cell subtypes
We used a shared nearest neighbor modularity optimization-based clustering algorithm, which was implemented in FindClusters function of R Seurat package, to conduct clustering of T cells. The first 10 PCs derived from PCA were applied, while other parameters were set as default. Six clusters were obtained from Set 1, and we assigned them to CD8+ and CD4+ T-cell subgroups according to T-cell subsets marker genes from Xcell (Aran et al., 2017). We also assigned and confirmed T-cell subgroups by learning T-cell trajectory tree with reversed graph embedding method implemented in R Monocle package. To further annotate each T-cell cluster, we performed differential gene expression analysis among different clusters of T cells, and annotated each cluster based on marker genes. Among the clusters, one cluster contained both CD8+ and CD4+ T cells expressing GZMA, and we annotated this cluster as CD4-C5-GZMA/CD8-C2-GZMA. For T cells from Set 2, we performed clustering and differential gene expression analysis similar as analyses of Set 1. Five clusters were obtained, among which three were found in Set 1 while two were considered as new clusters (CD4-C6-CCR7, naïve T cells; CD8-C3-GNLY, effector T cells).
Regulatory T cells and exhausted T cells
To determine regulatory T cells and exhausted T cells, we used the gene signatures from (Zheng et al., 2017). A total of 401 regulatory T-cell specific genes were provided, among which 31 genes were also found in three other works according to the study. We used the average expression of the 31 genes to characterize regulatory T cells of our data (both Set 1 and Set 2). Similarly, we applied average expression of 82 T-cell exhaustion specific genes from the paper to characterize exhausted T cells. According to data distribution (data not shown), we used average expression of 0.7 as cutoff to characterize the two types of cells, followed by calculating the percentage of regulatory T cells and exhausted T cells among all T cells from Div-Low and Di-High tumors.
Gene set enrichment analysis
Pathway analyses were performed on hallmark gene sets in Molecular Signatures Database (MSigDB v6.2) by using GSEA (version 3.0) (Subramanian et al., 2005). We performed 100 permutations for CD8+ and CD4+ T cells (Div-Low versus Div-High) respectively, by using genes that were detected in more than 5% of CD8+ or CD4+ T cells. Pathways were selected with q value < 0.05 for either CD8+ or CD4+ T cells. The enrichment of each pathway was indicated by the normalized enrichment score.
VEGFA immunohistochemistry staining
Immunohistochemistry was performed on 4-5 μm-thick whole tissue sections. Slides were deparaffinized and rehydrated through xylenes and series of graded ethanols. Heat induced antigen retrieval was performed in ph9 retrieval solution containing EDTA (DAKO, cat. S2367) using DAKO Pascal pressure cooker. The endogenous peroxidase activity was blocked with 3% H2O2 (Dako) for 10 min with additional protein blocking (Dako) for 15 min to minimize nonspecific staining. The slides were incubated with mouse monoclonal anti-VEGF (clone VG-1) (ThermoFisher) for 90 min at room temperature. The antigen-antibody reaction was detected using a DAKO Envision+ peroxidase kit and visualized with 3,3-diaminobenzadine (Dako). Slides were lightly counterstained with hematoxylin, dehydrated in a series graded ethanol, cleared in xylene, and coverslipped.
Histopathology
Histopathology images were obtained from the Laboratory of Pathology at National Cancer Institute, where surgical and core needle biopsies were sectioned at 5 μm and routinely stained with haematoxylin and eosin for further examination.
Plot generation
Boxplots were generated by using boxplot function in R graphics package. The central rectangle spans the interquartile range (IQR, the first quartile to the third quartile), with the segment inside the rectangle corresponding to the median value. Lower and upper whiskers represent the minimum (or first quartile minus 1.5×IQR) and the maximum (or third quartile plus 1.5×IQR), respectively. Violin plots were generated with ggplot and geom_violin functions in R ggplot2 package. Jitter plots were generated with ggplot and geom _jitter functions in R ggplot2 package. Kaplan-Meier plots of overall survival were generated with GraphPad Prism (version 7.04).
QUANTIFICATION AND STATISTICAL ANALYSIS
Statistical analysis was performed using R (version 3.4.3) and GraphPad Prism (version 7.04). Wilcoxon rank-sum test, Student’s t-test and Hotelling’s T-squared test were used in this study. * p < 0.05, ** p < 0.01, *** p < 0.001.
DATA AND SOFTWARE AVAILABILITY
The scRNA-seq data are available through the Gene Expression Omnibus (accession number GSE125449).
Supplementary Material
Table S6. Differential Expression Genes Among Different Clusters of T Cells from Set 1 and Set 2, Related to Figure 6.
Table S7. CD4+ and CD8+ T Cell Activity Related Genes Obtained from Differential Gene Expression Analysis between Div-Low and Div-High Tumor-derived CD4+ or CD8+ T cells, Related to Figure 6.
KEY RESOURCES TABLE
| REAGENT or RESOURCE | SOURCE | IDENTIFIER |
|---|---|---|
| Biological Samples | ||
| Patient-derived biopsy tissues | NIH/NCI Clinical Center | N/A |
| Chemicals, Peptides, and Recombinant Proteins | ||
| RPMI 1640 Medium | Gibco | Cat# 11875 |
| MACS Tissue Storage Solution | Miltenyi Biotech | Cat# 130-100-008 |
| Cell Culture Freezing Medium | Gibco | Cat# 12648-010 |
| 1X Red Blood Cell Lysis Buffer | Invitrogen (Thermo-Fisher) | Cat# 00-4333-57 |
| C Tubes | Miltenyi Biotech | Cat# 130-093-237 |
| MACS Strainers (70um) | Miltenyi Biotech | Cat# 130-095-823 |
| VEGF Ab-7, Mouse Monoclonal Antibody | Thermo Fisher Scientific | Cat# MS-1467P |
| EnVision+ Dual Link, Single Reagents (HRP. Mouse) | Agilent Dako | Cat# K406189-2 |
| Tris/EDTA buffer, pH 9 | Agilent Dako | Cat# S236784-2 |
| Critical Commercial Assays | ||
| Tumor Dissociation Kit, Human | Miltenyi Biotech | Cat# 130-095-929 |
| Chromium Single Cell 3′ Library & Gel Bead Kit v2 | 10x Genomics | Cat# PN-120237 |
| Chromium Single Cell A Chip Kit | 10x Genomics | Cat# PN-120236 |
| Chromium i7 Multiplex Kit | 10x Genomics | Cat# PN-120262 |
| Deposited Data | ||
| scRNA-seq data | This paper | GSE125449 |
| Software and Algorithms | ||
| Cell Ranger version 2.0.2 | 10x Genomics | https://support.10xgenomics.com/single-cell-gene-expression/software/downloads/latest |
| Seurat version 2.3.0 | Satija Lab | https://satijalab.org/seurat/ |
| Monocle version 2.6.3 | Trapnell Lab | http://cole-trapnell-lab.github.io/monocle-release/ |
| R version 3.4.3 | The R Project for Statistical Computing | https://www.r-project.org/ |
| BRB-ArrayTools version 4.6.0 | Biometric Research Branch of National Cancer Institute | https://brb.nci.nih.gov/BRB-ArrayTools/ |
| GSEA version 3.0 | Broad Institute | http://software.broadinstitute.org/gsea/index.jsp |
| InferCNV | GitHub | https://github.com/broadinstitute/inferCNV |
| IPA version 01-13 | QIAGEN Bioinformatics | https://www.qiagenbioinformatics.com/products/ingenuity-pathway-analysis/ |
| GraphPad Prism version 7 | GraphPad Software, San Diego California USA | https://www.graphpad.com/ |
| Other | ||
| GentleMACS Dissociator | Miltenyi Biotech | 130-093-235 |
| Sequencer NextSeq 500 | Illumina | N/A |
| Sequencer Hiseq 4000 | Illumina | N/A |
SIGNIFICANCE.
Liver cancer, the second most lethal malignancy in the world, consists of mainly hepatocellular carcinoma (HCC) and intrahepatic cholangiocarcinoma (iCCA). However, most of patients with HCC and iCCA have limited response to molecularly-targeted therapies. Here, we have developed a method to measure tumor cell biodiversity and demonstrate that tumor transcriptomic diversity is associated with overall survival in HCC and iCCA patients treated with immune checkpoint inhibitors. We also show that TME polarization including T-cell dysfunction is related to an increased expression of tumor-derived VEGF. These findings suggest a utility of a transcriptomic diversity score to predict immune therapy response and provide a rationale for a combination therapy of immune checkpoint blockage and anti-vascular treatment to improve therapeutic efficacies.
HIGHLIGHTS.
HCC and iCCA have a varying degree of transcriptomic diversity
Tumor transcriptomic diversity is associated with patient outcomes
Tumor-derived VEGF drives microenvironmental reprogramming
T cells derived from higher heterogeneous tumors showed lower cytolytic activities
ACKNOWLEDGEMENTS
We thank members of the Wang laboratory for critical discussions; Haydar Celik, Ching-Wen Chang, Marshonna Forgues and Wei Tang for technical support; Snorri Thorgeirsson for critical reading of this manuscript; the patients, families and nurses for contribution to this study. This work was supported by grants (Z01 BC 010877, Z01 BC 010876, Z01 BC 010313 and ZIA BC 011870) from the intramural research program of the Center for Cancer Research, National Cancer Institute of the United States.
Footnotes
Publisher's Disclaimer: This is a PDF file of an unedited manuscript that has been accepted for publication. As a service to our customers we are providing this early version of the manuscript. The manuscript will undergo copyediting, typesetting, and review of the resulting proof before it is published in its final citable form. Please note that during the production process errors may be discovered which could affect the content, and all legal disclaimers that apply to the journal pertain.
DECLARATION OF INTERESTS
The authors declare no competing interests.
REFERENCES
- Alexandrov LB, Nik-Zainal S, Wedge DC, Aparicio SA, Behjati S, Biankin AV, Bignell GR, Bolli N, Borg A, Borresen-Dale AL, et al. (2013). Signatures of mutational processes in human cancer. Nature 500, 415–421. [DOI] [PMC free article] [PubMed] [Google Scholar]
- Andor N, Graham TA, Jansen M, Xia LC, Aktipis CA, Petritsch C, Ji HP, and Maley CC (2016). Pan-cancer analysis of the extent and consequences of intratumor heterogeneity. Nat Med 22, 105–113. [DOI] [PMC free article] [PubMed] [Google Scholar]
- Aran D, Hu Z, and Butte AJ (2017). xCell: digitally portraying the tissue cellular heterogeneity landscape. Genome Biology 18, 220. [DOI] [PMC free article] [PubMed] [Google Scholar]
- Azizi E, Carr AJ, Plitas G, Cornish AE, Konopacki C, Prabhakaran S, Nainys J, Wu K, Kiseliovas V, Setty M, et al. (2018). Single-Cell Map of Diverse Immune Phenotypes in the Breast Tumor Microenvironment. Cell 174, 1293–1308 e1236. [DOI] [PMC free article] [PubMed] [Google Scholar]
- Baslan T, and Hicks J (2017). Unravelling biology and shifting paradigms in cancer with single-cell sequencing. Nat Rev Cancer 17, 557–569. [DOI] [PubMed] [Google Scholar]
- Belaiba RS, Bonello S, Zahringer C, Schmidt S, Hess J, Kietzmann T, and Gorlach A (2007). Hypoxia up-regulates hypoxia-inducible factor-1alpha transcription by involving phosphatidylinositol 3-kinase and nuclear factor kappaB in pulmonary artery smooth muscle cells. Mol Biol Cell 18, 4691–4697. [DOI] [PMC free article] [PubMed] [Google Scholar]
- Blakely CM, Watkins TBK, Wu W, Gini B, Chabon JJ, McCoach CE, McGranahan N, Wilson GA, Birkbak NJ, Olivas VR, et al. (2017). Evolution and clinical impact of co-occurring genetic alterations in advanced-stage EGFR-mutant lung cancers. Nat Genet 49, 1693–1704. [DOI] [PMC free article] [PubMed] [Google Scholar]
- Boyault S, Rickman DS, de Reynies A, Balabaud C, Rebouissou S, Jeannot E, Herault A, Saric J, Belghiti J, Franco D, et al. (2007). Transcriptome classification of HCC is related to gene alterations and to new therapeutic targets. Hepatology 45, 42–52. [DOI] [PubMed] [Google Scholar]
- Buffa F, Harris A, West C, and Miller C (2010). Large meta-analysis of multiple cancers reveals a common, compact and highly prognostic hypoxia metagene. Br J Cancer 102, 428. [DOI] [PMC free article] [PubMed] [Google Scholar]
- Burrell RA, McGranahan N, Bartek J, and Swanton C (2013). The causes and consequences of genetic heterogeneity in cancer evolution. Nature 501, 338–345. [DOI] [PubMed] [Google Scholar]
- Butler A, Hoffman P, Smibert P, Papalexi E, and Satija R (2018). Integrating single-cell transcriptomic data across different conditions, technologies, and species. Nature Biotechnology 36, 411. [DOI] [PMC free article] [PubMed] [Google Scholar]
- Chaisaingmongkol J, Budhu A, Dang H, Rabibhadana S, Pupacdi B, Kwon SM, Forgues M, Pomyen Y, Bhudhisawasdi V, Lertprasertsuke N, et al. (2017). Common Molecular Subtypes Among Asian Hepatocellular Carcinoma and Cholangiocarcinoma. Cancer Cell 32, 57–70 e53. [DOI] [PMC free article] [PubMed] [Google Scholar]
- Chew V, Chen J, Lee D, Loh E, Lee J, Lim KH, Weber A, Slankamenac K, Poon RT, Yang H, et al. (2012). Chemokine-driven lymphocyte infiltration: an early intratumoural event determining long-term survival in resectable hepatocellular carcinoma. Gut 61, 427–438. [DOI] [PMC free article] [PubMed] [Google Scholar]
- Chong CR, and Janne PA (2013). The quest to overcome resistance to EGFR-targeted therapies in cancer. Nat Med 19, 1389–1400. [DOI] [PMC free article] [PubMed] [Google Scholar]
- Dang H, Takai A, Forgues M, Pomyen Y, Mou H, Xue W, Ray D, Ha KCH, Morris QD, Hughes TR, et al. (2017). Oncogenic Activation of the RNA Binding Protein NELFE and MYC Signaling in Hepatocellular Carcinoma. Cancer Cell 32, 101–114 e108. [DOI] [PMC free article] [PubMed] [Google Scholar]
- Duffy AG, Ulahannan SV, Makorova-Rusher O, Rahma O, Wedemeyer H, Pratt D, Davis JL, Hughes MS, Heller T, ElGindi M, et al. (2017). Tremelimumab in combination with ablation in patients with advanced hepatocellular carcinoma. J Hepatol 66, 545–551. [DOI] [PMC free article] [PubMed] [Google Scholar]
- Gerlinger M, Rowan AJ, Horswell S, Larkin J, Endesfelder D, Gronroos E, Martinez P, Matthews N, Stewart A, Tarpey P, et al. (2012). Intratumor heterogeneity and branched evolution revealed by multiregion sequencing. N Engl J Med 366, 883–892. [DOI] [PMC free article] [PubMed] [Google Scholar]
- Giustacchini A, Thongjuea S, Barkas N, Woll PS, Povinelli BJ, Booth CAG, Sopp P, Norfo R, Rodriguez-Meira A, Ashley N, et al. (2017). Single-cell transcriptomics uncovers distinct molecular signatures of stem cells in chronic myeloid leukemia. Nat Med 23, 692–702. [DOI] [PubMed] [Google Scholar]
- Goel HL, and Mercurio AM (2013). VEGF targets the tumour cell. Nat Rev Cancer 13, 871–882. [DOI] [PMC free article] [PubMed] [Google Scholar]
- Goyal L, Saha SK, Liu LY, Siravegna G, Leshchiner I, Ahronian LG, Lennerz JK, Vu P, Deshpande V, Kambadakone A, et al. (2017). Polyclonal Secondary FGFR2 Mutations Drive Acquired Resistance to FGFR Inhibition in Patients with FGFR2 Fusion-Positive Cholangiocarcinoma. Cancer Discov 7, 252–263. [DOI] [PMC free article] [PubMed] [Google Scholar]
- Gu Z, Eils R, and Schlesner M (2016). Complex heatmaps reveal patterns and correlations in multidimensional genomic data. Bioinformatics 32, 2847–2849. [DOI] [PubMed] [Google Scholar]
- Guo X, Zhang Y, Zheng L, Zheng C, Song J, Zhang Q, Kang B, Liu Z, Jin L, Xing R, et al. (2018). Global characterization of T cells in non-small-cell lung cancer by single-cell sequencing. Nat Med 24, 978–985. [DOI] [PubMed] [Google Scholar]
- Horwitz E, Stein I, Andreozzi M, Nemeth J, Shoham A, Pappo O, Schweitzer N, Tornillo L, Kanarek N, Quagliata L, et al. (2014). Human and mouse VEGFA-amplified hepatocellular carcinomas are highly sensitive to sorafenib treatment. Cancer Discov 4, 730–743. [DOI] [PubMed] [Google Scholar]
- Hou Y, Guo H, Cao C, Li X, Hu B, Zhu P, Wu X, Wen L, Tang F, Huang Y, et al. (2016). Single-cell triple omics sequencing reveals genetic, epigenetic, and transcriptomic heterogeneity in hepatocellular carcinomas. Cell Res 26, 304–319. [DOI] [PMC free article] [PubMed] [Google Scholar]
- Huber JP, and David Farrar J (2011). Regulation of effector and memory T-cell functions by type I interferon. Immunology 132, 466–474. [DOI] [PMC free article] [PubMed] [Google Scholar]
- Hunger SP, and Mullighan CG (2015). Acute Lymphoblastic Leukemia in Children. N Engl J Med 373, 1541–1552. [DOI] [PubMed] [Google Scholar]
- Jusakul A, Cutcutache I, Yong CH, Lim JQ, Huang MN, Padmanabhan N, Nellore V, Kongpetch S, Ng AWT, Ng LM, et al. (2017). Whole-Genome and Epigenomic Landscapes of Etiologically Distinct Subtypes of Cholangiocarcinoma. Cancer Discov 7, 1116–1135. [DOI] [PMC free article] [PubMed] [Google Scholar]
- Kalluri R (2016). The biology and function of fibroblasts in cancer. Nat Rev Cancer 16, 582–598. [DOI] [PubMed] [Google Scholar]
- Katoh H, Ojima H, Kokubu A, Saito S, Kondo T, Kosuge T, Hosoda F, Imoto I, Inazawa J, Hirohashi S, et al. (2007). Genetically Distinct and Clinically Relevant Classification of Hepatocellular Carcinoma: Putative Therapeutic Targets. Gastroenterology 133, 1475–1486. [DOI] [PubMed] [Google Scholar]
- Kelley KW, Nakao-Inoue H, Molofsky AV, and Oldham MC (2018). Variation among intact tissue samples reveals the core transcriptional features of human CNS cell classes. Nat Neurosci 21, 1171–1184. [DOI] [PMC free article] [PubMed] [Google Scholar]
- Khan KA, and Kerbel RS (2018). Improving immunotherapy outcomes with anti-angiogenic treatments and vice versa. Nat Rev Clin Oncol 15, 310–324. [DOI] [PubMed] [Google Scholar]
- Kim DS, Ryu JW, Son MY, Oh JH, Chung KS, Lee S, Lee JJ, Ahn JH, Min JS, and Ahn J (2017). A liver-specific gene expression panel predicts the differentiation status of in vitro hepatocyte models. Hepatology 66, 1662–1674. [DOI] [PMC free article] [PubMed] [Google Scholar]
- Kolumam GA, Thomas S, Thompson LJ, Sprent J, and Murali-Krishna K (2005). Type I interferons act directly on CD8 T cells to allow clonal expansion and memory formation in response to viral infection. Journal of Experimental Medicine 202, 637–650. [DOI] [PMC free article] [PubMed] [Google Scholar]
- Krämer A, Green J, Pollard J Jr, and Tugendreich S (2013). Causal analysis approaches in ingenuity pathway analysis. Bioinformatics 30, 523–530. [DOI] [PMC free article] [PubMed] [Google Scholar]
- Kwon SM, Budhu A, Woo HG, Chaisaingmongkol J, Dang H, Forgues M, Harris CC, Zhang G, Auslander N, and Ruppin E (2019). Functional Genomic Complexity Defines Intratumor Heterogeneity and Tumor Aggressiveness in Liver Cancer. bioRxiv, 614057. [DOI] [PMC free article] [PubMed] [Google Scholar]
- Lambrechts D, Wauters E, Boeckx B, Aibar S, Nittner D, Burton O, Bassez A, Decaluwe H, Pircher A, and Van den Eynde K (2018). Phenotype molding of stromal cells in the lung tumor microenvironment. Nature Medicine 24, 1277. [DOI] [PubMed] [Google Scholar]
- LeCouter J, Moritz DR, Li B, Phillips GL, Liang XH, Gerber HP, Hillan KJ, and Ferrara N (2003). Angiogenesis-independent endothelial protection of liver: role of VEGFR-1. Science (New York, NY) 299, 890–893. [DOI] [PubMed] [Google Scholar]
- Lee JS, Chu IS, Heo J, Calvisi DF, Sun Z, Roskams T, Durnez A, Demetris AJ, and Thorgeirsson SS (2004). Classification and prediction of survival in hepatocellular carcinoma by gene expression profiling. Hepatology 40, 667–676. [DOI] [PubMed] [Google Scholar]
- Li H, Courtois ET, Sengupta D, Tan Y, Chen KH, Goh JJL, Kong SL, Chua C, Hon LK, Tan WS, et al. (2017). Reference component analysis of single-cell transcriptomes elucidates cellular heterogeneity in human colorectal tumors. Nat Genet 49, 708–718. [DOI] [PubMed] [Google Scholar]
- Ling S, Hu Z, Yang Z, Yang F, Li Y, Lin P, Chen K, Dong L, Cao L, Tao Y, et al. (2015). Extremely high genetic diversity in a single tumor points to prevalence of non-Darwinian cell evolution. Proceedings of the National Academy of Sciences of the United States of America 112, E6496–6505. [DOI] [PMC free article] [PubMed] [Google Scholar]
- Maley CC, Aktipis A, Graham TA, Sottoriva A, Boddy AM, Janiszewska M, Silva AS, Gerlinger M, Yuan Y, Pienta KJ, et al. (2017). Classifying the evolutionary and ecological features of neoplasms. Nat Rev Cancer 17, 605–619. [DOI] [PMC free article] [PubMed] [Google Scholar]
- Mao Q, Wang L, Tsang IW, and Sun Y (2017). Principal graph and structure learning based on reversed graph embedding. IEEE Transactions on Pattern Analysis and Machine Intelligence 39, 2227–2241. [DOI] [PMC free article] [PubMed] [Google Scholar]
- Mariathasan S, Turley SJ, Nickles D, Castiglioni A, Yuen K, Wang Y, Kadel EE III, Koeppen H, Astarita JL, Cubas R, et al. (2018). TGFbeta attenuates tumour response to PD-L1 blockade by contributing to exclusion of T cells. Nature 554, 544–548. [DOI] [PMC free article] [PubMed] [Google Scholar]
- McDermott DF, Huseni MA, Atkins MB, Motzer RJ, Rini BI, Escudier B, Fong L, Joseph RW, Pal SK, Reeves JA, et al. (2018). Clinical activity and molecular correlates of response to atezolizumab alone or in combination with bevacizumab versus sunitinib in renal cell carcinoma. Nat Med 24, 749–757. [DOI] [PMC free article] [PubMed] [Google Scholar]
- McGranahan N, and Swanton C (2015). Biological and therapeutic impact of intratumor heterogeneity in cancer evolution. Cancer Cell 27, 15–26. [DOI] [PubMed] [Google Scholar]
- McGranahan N, and Swanton C (2017). Clonal Heterogeneity and Tumor Evolution: Past, Present, and the Future. Cell 168, 613–628. [DOI] [PubMed] [Google Scholar]
- Neftel C, Laffy J, Filbin MG, Hara T, Shore ME, Rahme GJ, Richman AR, Silverbush D, Shaw ML, Hebert CM, et al. (2019). An Integrative Model of Cellular States, Plasticity, and Genetics for Glioblastoma. Cell. [DOI] [PMC free article] [PubMed] [Google Scholar]
- Patel AP, Tirosh I, Trombetta JJ, Shalek AK, Gillespie SM, Wakimoto H, Cahill DP, Nahed BV, Curry WT, Martuza RL, et al. (2014). Single-cell RNA-seq highlights intratumoral heterogeneity in primary glioblastoma. Science (New York, NY) 344, 1396–1401. [DOI] [PMC free article] [PubMed] [Google Scholar]
- Pollard JW (2004). Tumour-educated macrophages promote tumour progression and metastasis. NatRevCancer 4, 71–78. [DOI] [PubMed] [Google Scholar]
- Puram SV, Tirosh I, Parikh AS, Patel AP, Yizhak K, Gillespie S, Rodman C, Luo CL, Mroz EA, Emerick KS, et al. (2017). Single-Cell Transcriptomic Analysis of Primary and Metastatic Tumor Ecosystems in Head and Neck Cancer. Cell 171, 1611–1624 e1624. [DOI] [PMC free article] [PubMed] [Google Scholar]
- Qiu X, Mao Q, Tang Y, Wang L, Chawla R, Pliner H, and Trapnell C (2017). Reversed graph embedding resolves complex single-cell developmental trajectories. bioRxiv. [DOI] [PMC free article] [PubMed] [Google Scholar]
- Rius J, Guma M, Schachtrup C, Akassoglou K, Zinkernagel AS, Nizet V, Johnson RS, Haddad GG, and Karin M (2008). NF-kappaB links innate immunity to the hypoxic response through transcriptional regulation of HIF-1alpha. Nature. [DOI] [PMC free article] [PubMed] [Google Scholar]
- Rodriguez A, and Laio A (2014). Clustering by fast search and find of density peaks. Science (New York, NY) 344, 1492–1496. [DOI] [PubMed] [Google Scholar]
- Roessler S, Jia HL, Budhu A, Forgues M, Ye QH, Lee JS, Thorgeirsson SS, Sun Z, Tang ZY, Qin LX, et al. (2010). A unique metastasis gene signature enables prediction of tumor relapse in early-stage hepatocellular carcinoma patients. Cancer Research 70, 10202–10212. [DOI] [PMC free article] [PubMed] [Google Scholar]
- Roessler S, Long EL, Budhu A, Chen Y, Zhao X, Ji J, Walker R, Jia HL, Ye QH, Qin LX, et al. (2012). Integrative genomic identification of genes on 8p associated with hepatocellular carcinoma progression and patient survival. Gastroenterology 142, 957–966. [DOI] [PMC free article] [PubMed] [Google Scholar]
- Seehawer M, Heinzmann F, D’Artista L, Harbig J, Roux PF, Hoenicke L, Dang H, Klotz S, Robinson L, Dore G, et al. (2018). Necroptosis microenvironment directs lineage commitment in liver cancer. Nature 562, 69–75. [DOI] [PMC free article] [PubMed] [Google Scholar]
- Semenza GL (2012). Hypoxia-inducible factors in physiology and medicine. Cell 148, 399–408. [DOI] [PMC free article] [PubMed] [Google Scholar]
- Simon R, Lam A, Li M-C, Ngan M, Menenzes S, and Zhao Y (2007). Analysis of gene expression data using BRB-array tools. Cancer Informatics 3, 11–17. [PMC free article] [PubMed] [Google Scholar]
- Subramanian A, Tamayo P, Mootha VK, Mukherjee S, Ebert BL, Gillette MA, Paulovich A, Pomeroy SL, Golub TR, Lander ES, et al. (2005). Gene set enrichment analysis: a knowledge-based approach for interpreting genome-wide expression profiles. Proc Natl Acad Sci USA 102, 15545–15550. [DOI] [PMC free article] [PubMed] [Google Scholar]
- Tanay A, and Regev A (2017). Scaling single-cell genomics from phenomenology to mechanism. Nature 541, 331–338. [DOI] [PMC free article] [PubMed] [Google Scholar]
- TheCancerGenomeAtlasResearchNetwork (2017). Comprehensive and Integrative Genomic Characterization of Hepatocellular Carcinoma. Cell 169, 1327–1341 e1323. [DOI] [PMC free article] [PubMed] [Google Scholar]
- Tirosh I, Izar B, Prakadan SM, Wadsworth MH 2nd, Treacy D, Trombetta JJ, Rotem A, Rodman C, Lian C, Murphy G, et al. (2016a). Dissecting the multicellular ecosystem of metastatic melanoma by single-cell RNA-seq. Science (New York, NY) 352, 189–196. [DOI] [PMC free article] [PubMed] [Google Scholar]
- Tirosh I, Venteicher AS, Hebert C, Escalante LE, Patel AP, Yizhak K, Fisher JM, Rodman C, Mount C, Filbin MG, et al. (2016b). Single-cell RNA-seq supports a developmental hierarchy in human oligodendroglioma. Nature 539, 309–313. [DOI] [PMC free article] [PubMed] [Google Scholar]
- Trapnell C, Cacchiarelli D, Grimsby J, Pokharel P, Li S, Morse M, Lennon NJ, Livak KJ, Mikkelsen TS, and Rinn JL (2014). The dynamics and regulators of cell fate decisions are revealed by pseudotemporal ordering of single cells. Nature Biotechnology 32, 381. [DOI] [PMC free article] [PubMed] [Google Scholar]
- Unitt E, Marshall A, Gelson W, Rushbrook SM, Davies S, Vowler SL, Morris LS, Coleman N, and Alexander GJ (2006). Tumour lymphocytic infiltrate and recurrence of hepatocellular carcinoma following liver transplantation. J Hepatol 45, 246–253. [DOI] [PubMed] [Google Scholar]
- Venteicher AS, Tirosh I, Hebert C, Yizhak K, Neftel C, Filbin MG, Hovestadt V, Escalante LE, Shaw ML, Rodman C, et al. (2017). Decoupling genetics, lineages, and microenvironment in IDH-mutant gliomas by single-cell RNA-seq. Science (New York, NY) 355. [DOI] [PMC free article] [PubMed] [Google Scholar]
- Vento-Tormo R, Efremova M, Botting RA, Turco MY, Vento-Tormo M, Meyer KB, Park J-E, Stephenson E, Polanski K, and Goncalves A (2018). Single-cell reconstruction of the early maternal-fetal interface in humans. Nature 563, 347. [DOI] [PMC free article] [PubMed] [Google Scholar]
- Waltman L, and Van Eck NJ (2013). A smart local moving algorithm for large-scale modularity-based community detection. The European Physical Journal B 86, 471. [Google Scholar]
- Wang XW, and Thorrgeirsson SS (2014). The Biological and clinical challenge of liver cancer heterogeneity. Hepatic Oncology 1, 5. [DOI] [PMC free article] [PubMed] [Google Scholar]
- Wiener CM, Booth G, and Semenza GL (1996). In vivo expression of mRNAs encoding hypoxia-inducible factor 1. BiochemBiophysRes Commun 225, 485–488. [DOI] [PubMed] [Google Scholar]
- Xue R, Li R, Guo H, Guo L, Su Z, Ni X, Qi L, Zhang T, Li Q, Zhang Z, et al. (2016). Variable Intra-Tumor Genomic Heterogeneity of Multiple Lesions in Patients With Hepatocellular Carcinoma. Gastroenterology 150, 998–1008. [DOI] [PubMed] [Google Scholar]
- Ye QH, Qin LX, Forgues M, He P, Kim JW, Peng AC, Simon R, Li Y, Robles AI, Chen Y, et al. (2003). Predicting hepatitis B virus-positive metastatic hepatocellular carcinomas using gene expression profiling and supervised machine learning. NatMed 9, 416–423. [DOI] [PubMed] [Google Scholar]
- Zheng C, Zheng L, Yoo JK, Guo H, Zhang Y, Guo X, Kang B, Hu R, Huang JY, Zhang Q, et al. (2017). Landscape of Infiltrating T Cells in Liver Cancer Revealed by Single-Cell Sequencing. Cell 169, 1342–1356 e1316. [DOI] [PubMed] [Google Scholar]
- Zheng H, Pomyen Y, Hernandez MO, Li C, Livak F, Tang W, Dang H, Greten TF, Davis JL, Zhao Y, et al. (2018). Single cell analysis reveals cancer stem cell heterogeneity in hepatocellular carcinoma. Hepatology 68, 127–140. [DOI] [PMC free article] [PubMed] [Google Scholar]
Associated Data
This section collects any data citations, data availability statements, or supplementary materials included in this article.
Supplementary Materials
Table S6. Differential Expression Genes Among Different Clusters of T Cells from Set 1 and Set 2, Related to Figure 6.
Table S7. CD4+ and CD8+ T Cell Activity Related Genes Obtained from Differential Gene Expression Analysis between Div-Low and Div-High Tumor-derived CD4+ or CD8+ T cells, Related to Figure 6.
Data Availability Statement
The scRNA-seq data are available through the Gene Expression Omnibus (accession number GSE125449).