

Abstract
Objective
To assess the effect of diabetes type on the long‐term rate and extent of epidermal nerve regeneration.
Methods
Subjects with well controlled type 1 diabetes mellitus (n = 11) or type 2 diabetes mellitus (n = 36), with normal nerve conduction studies and baseline intraepidermal nerve fiber density (IENFD), and healthy controls (n = 10) underwent chemical axotomy of the intraepidermal nerves at the thigh using topical capsaicin. Skin biopsies were performed at 30, 90, 150, and 180 days post‐axotomy.
Results
After 180 days, IENFD in diabetic subjects remained significantly below baseline levels, while healthy controls returned to normal. At each time point, regeneration rates were significantly slower among diabetic subjects, although type 1 subjects regenerated significantly faster and achieved higher percentages of baseline IENFD compared with type 2.
Interpretation
Among diabetic patients, nerve injury recovery is likely to take significantly longer than in healthy individuals, and remains incomplete, particularly among type 2 patients. This may partially explain the progression of neuropathy among diabetic patients: damage accumulates because nerve recovery is slowed and incomplete. Furthermore, these findings support caution when recommending certain procedures, such as carpal tunnel repair, to patients with progressed diabetic disease.
Introduction
Peripheral neuropathy is a common and progressive complication of diabetes that leads to significant morbidity. Axonal degeneration of all nerve fibers, including small unmyelinated axons, is considered the pathological hallmark of diabetic peripheral neuropathy and typically results in sensory and autonomic dysfunction.1, 2, 3, 4, 5 In addition to axonal degeneration, regeneration of small cutaneous unmyelinated axons is impaired in animal models of diabetic neuropathy and diabetic patients, even without clinical neuropathy.6, 7, 8, 9 This is suggested to result from impaired neurovascular repair and Schwann cell dysfunction, potentially playing a role in pathogenesis of diabetic neuropathy.10
Topical capsaicin has been developed to create a uniform chemical axotomy of the intraepidermal nerves.9 Using this model, it has been shown that somatic (intraepidermal nerve fibers) and autonomic (sweat gland) epidermal innervation returns to normal within 90–180 days in nondiabetic subjects.9, 11 In diabetic patients, however, the long‐term course of nerve regeneration has not been well studied. One previous study found slowed and incomplete axonal regeneration in diabetic patients after 90 days, but the long‐term outcome of regeneration in these patients is not known.9
In this study, we addressed two clinically relevant questions: (1) do people with diabetes fully regenerate the distal ends of chemically axotomized nerve fibers, given sufficient time, and (2) are there differences in regeneration between type 1 and 2 diabetes? Using the capsaicin chemical axotomy model, we measured axonal regeneration for 180 days after chemical denervation in diabetic patients (type 1 and type 2) and healthy controls. We estimated regeneration rates and ultimate regeneration amounts and compared this regeneration between type 1 and type 2 diabetic patients, and to healthy controls. Finally, we analyzed the association of this regeneration with clinical correlates, such as body mass index and hemoglobin A1c level.
Methods
Study participants
Diabetic cases
Eleven patients with type 1 diabetes mellitus and 36 with type 2 diabetes mellitus who were identified as having normal sural sensory nerve conduction studies and normal intraepidermal nerve fiber density (IENFD) by baseline skin biopsy were included in this study. Blood glucose level and hemoglobin A1c (HbA1c) were measured at baseline, 90, and 180 days. We excluded three diabetic patients who were lost to follow‐up prior to 150 days post‐axotomy (one type 1, two type 2). Additionally, weight, height, and hypercholesterolemia were recorded at baseline.
Healthy controls
Ten healthy controls with no evidence of neuropathy on examination and no predisposing factors for neuropathy underwent a skin punch biopsy at the proximal thigh.
This study was approved by the Johns Hopkins Medicine Institutional Review Board. All subjects gave signed informed consent.
Skin biopsy
Capsaicin chemical axotomy was performed by applying an occlusive bandage containing 1.8 g of 0.1% capsaicin cream (Chattem, Inc.) to skin on the thigh for two consecutive 24‐h periods, as previously described.9 Skin punch biopsies measuring three millimeters were obtained using lidocaine local anesthesia, as previously described.9 Four 50 μmol/L sections separated by regular space intervals with a random start point were immunohistochemically stained using a free‐floating protocol with rabbit anti‐human polyclonal PGP9.5 antibody (Serotec; 1:10,000 dilution). Slides were masked using a random identifier, and a single technician blinded to study details assessed IENFD values. For diabetic cases, biopsies were obtained after the 48‐hour capsaicin period and at 30, 90, 150, and 180 days. For controls, biopsies were performed at 2, 30, 60, 90, 180, and 360 days post‐axotomy. A template was used to define biopsy sites and prevent the possibility of performing the biopsy on a previous, healed biopsy site or needle track.
Statistical analysis
Demographic and baseline characteristics of cases and controls are reported (Table 1). Statistical comparisons were performed using chi‐squared test for categorical variables and analysis of variance for continuous variables. We assessed the absolute extent, percent of baseline, and rate of small fiber peripheral nerve regeneration using the IENFD measurements over the 6‐month study period for each study subject (Table 2). Comparisons between groups were made using analysis of variance and linear regression models. For subjects where measurements at 180 days were not taken but measurements before and after were available, we fit cubic splines to estimate IENFD values at 180 days.
Table 1.
Demographic and electrophysiologic features of study subjects.
| Type 1 | Type 2 | Controls | P‐valuea | |||
|---|---|---|---|---|---|---|
| Type 1 vs. Type 2 | Type 1 vs. Controls | Type 2 vs. Controls | ||||
| (n = 11) | (n = 36) | (n = 10) b | ||||
| Age (mean (sd)) | 35.5 (14.3) | 53.5 (10.2) | 39.8 (11.2) | <0.001 | 0.5 | 0.001 |
| Gender, male (%) | 4 (36.4%) | 11 (30.6%) | 2 (20.0%) | 1 | 0.7 | 0.8 |
| BMI, mean (SD) | 26.5 (5.3) | 32.9 (7.1) | 30.1 (6.9) | 0.008 | 0.2 | 0.3 |
| Height, mean (SD) | 1.7 (0.08) | 1.7 (0.1) | 1.6 (0.07) | 0.7 | 0.1 | 0.2 |
| Weight, mean (SD) | 76.5 (12.2) | 94.2 (19.8) | 93.8 (21.4) | 0.008 | 0.06 | 1.0 |
| Diabetes Duration (years, mean, SD) | 14.0 (10.0) | 4.9 (5.8) | – | <0.001 | – | – |
| IENFD Baselinec (fibers/mm, mean (SD)) | 17.7 (8.9) | 19.7 (7.7) | 17.3 (5.2) | 0.5 | 0.2 | 0.3 |
| Sural SNAP baseline L, mean (SD) d | 17.0 (8.1) | 16.9 (8.3) | – | 1.0 | – | – |
| Sural SNAP baseline R, mean (SD) d | 20.0 (13.5) | 17.3 (8.4) | – | 0.4 | – | – |
| HbA1c, 0 days, mean (SD) | 6.8 (0.9) | 7.0 (0.7) | – | 0.4 | – | – |
| HbA1c, 90 days, mean (SD) | 6.9 (1.0) | 6.7 (0.9) | – | 0.6 | – | – |
| HbA1c, 210 days, mean (SD) | 6.9 (1.0) | 6.7 (0.9) | – | 0.8 | – | – |
| Hypercholesterolemia (%) | 2 (18%) | 16 (44%) | – | 0.2 | – | – |
Assessed through chi‐square and regular ANOVA tests.
Height and weight were only available for 5 of 10 controls; sural SNAP, HbA1c, and cholesterol measurements were not available for any controls (n = 0).
IENFD: intraepidermal nerve fiber density, taken at the proximal thigh through skin punch biopsy.
SNAP: sensory nerve action potential.
Table 2.
180‐days small fiber peripheral nerve regeneration.
| Type 1 (n = 11) | Type 2 (n = 36) | Controls (n = 10) | P‐value4 | |||
|---|---|---|---|---|---|---|
| Type 1 vs. Type 2 | Type 1 vs. Controls | Type 2 vs. Controls | ||||
| IENFD Baselinea (fibers/mm, mean (sd)) | 17.7 (8.9) | 19.7 (7.7) | 17.3 (5.2) | 0.5 | 0.2 | 0.3 |
| Regeneration, 180‐days | ||||||
| Return of IENFD @ 180 days (fibers/mm, mean (SD)) | 12.4 (5.2) | 10.9 (5.5) | 19.5 (7.1) | 0.4 | 0.02 | <0.001 |
| Difference from baseline (fibers/mm, mean (SD)) | −5.2 (4.6) | −8.6 (5.3) | −2.7 (5.7) | 0.06 | 0.3 | 0.003 |
| Percent of Baseline (%, mean (SD)) | 76% (14%) | 58% (21%) | 91% (25%) | 0.01 | 0.1 | <0.001 |
| Regeneration: return of IENF density, 180‐days b | ||||||
| Density regeneration per day (fibers/mm/day, mean (sd)) | 0.07 (0.03) | 0.06 (0.03) | 0.11 (0.04) | 0.4 | 0.02 | <0.001 |
| Percent of baseline per day (%/day, mean (sd)) | 0.4% (0.08%) | 0.3% (0.12%) | 0.5% (0.14%) | 0.01 | 0.1 | <0.001 |
Assessed through chi‐square and regular ANOVA tests.
IENFD: intraepidermal nerve fiber density, taken at the proximal thigh through skin punch biopsy.
Calculated from regeneration total after 180 days.
We estimated the 6‐month regeneration rates as the IENFD at 180 days minus the measurement at 48 h post‐axotomy (day 0), divided by the 180 days. We used multiple linear regression to assess the effect of other covariates (i.e., age, gender, height, weight, BMI, HbA1C, and cholesterol).
We estimated the continuous rate of regeneration (over time) using a linear mixed‐effects model with a quadratic term to capture the deceleration of regeneration, with a random effect for study subject and fixed effects for subject type (i.e., type 1 diabetes, type 2, or control), baseline IENFD, age, and BMI, fit to the longitudinal data. Baseline IENFD, age, and BMI were centered on the variable medians for interpretability. From this model, we estimated rate of regeneration at 0, 30, 60, 90, and 180 days post‐axotomy. To visualize the effect of subject type, we used the fitted model and projected the regeneration trajectories for the study subjects, assuming identical covariate values set at the study population medians (baseline IENFD = 19 fibers/mm, age = 52 years, and BMI = 29.7). Finally, we used the fitted model and bootstrapping to estimate the day at which nerve regeneration culminated for cases and controls.
Results
Forty‐seven diabetic patients (11 type 1, 36 type 2) and ten healthy controls were included in the study. Patients with type 2 diabetes were on average older than patients with type 1 diabetes or healthy controls (Table 1, P < 0.001). There was no difference in height between diabetic groups but type 1 patients weighed significantly less than type 2 patients, leading to a significant difference in body mass index (BMI; P = 0.008) (Table 1). We found no difference in BMI between controls and either type 1 or type 2 patients (P = 0.2, P = 0.3); height and weight were not available for five controls (50%), therefore these measures could not be assessed.
There were no significant differences between baseline IENFD of diabetic patients and healthy controls (Table 1). Sural sensory responses, blood glucose level, hypercholesterolemia status, and HbA1C were similar between patients with type 1 and type 2 diabetes at baseline and subsequent measurements (these were not measured in controls) (Table 1).
After 180 days of follow‐up, IENFD levels in both type 1 and type 2 diabetic patients remained significantly below baseline levels, with type 1 patients 5.2 [95% CI, 2.1‐8.3] fibers/mm below baseline levels and type 2 patients 8.6 [95% CI, 6.8–10.4] fibers/mm below (Table 2, Fig. 1). All type 1 diabetic patients remained below 100% reinnervation, regenerating to 76% [95% confidence interval (CI), 54‐92%], with 7/11 (64%) regenerating to 75% of baseline or higher (Fig. 2). In contrast, only 8/36 (22%) of type 2 diabetic patients regenerated to 75% of baseline, with a mean regeneration percentage of 58% [95% CI, 22–98%]. Healthy controls regenerated nerve fiber densities that were statistically consistent with baseline levels, with a mean difference from baseline of −2.7 fibers/mm [95% confidence interval (CI), −6.8 to 1.4] and a mean regeneration percentage of 91% [95% CI, 54 to 134%] (Table 2, Fig. 2, 3). Regeneration rates in these control subjects were similar with previously reported rates in control subjects.10
Figure 1.
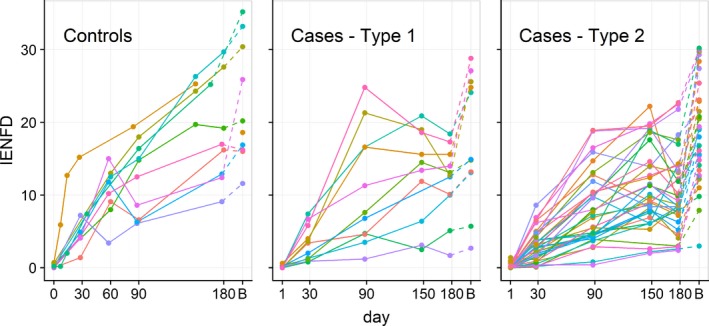
Individual data for nerve regeneration in healthy control and diabetic patients. Each line represents the intraepidermal nerve fiber density (IENFD) measurements from the proximal thigh for each subject followed over time, from 0 to 180 days post‐chemical axotomy. “B” indicates the IENFD at baseline, prior to denervation. IENFD returned to normal among healthy controls after 180 days of follow‐up but remained below baseline levels in diabetic patients.
Figure 2.
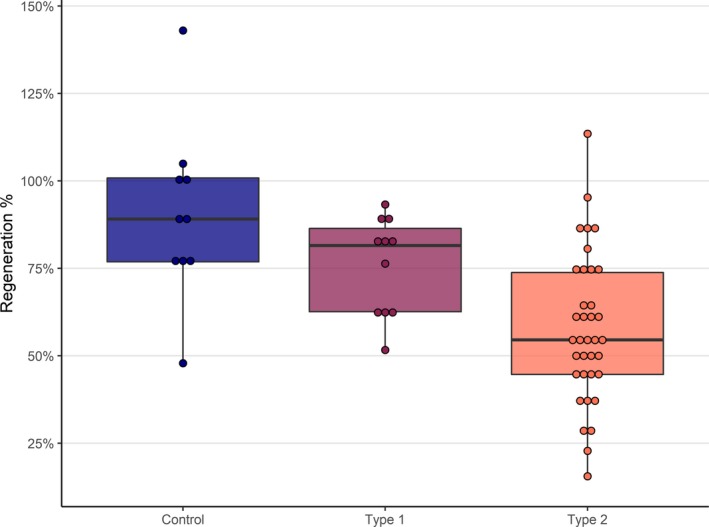
Percent of baseline IENFD regenerated after 180 days in healthy control and diabetic patients. Controls regenerate higher percentages of baseline fiber densities than both type 1 (nonsignificant) and type 2 diabetic patients, and type 1 patients regenerate to significantly higher percentages than type 2 patients (Table 2). Boxed region represent the precent of baseline IENFD regenrated and bars represent standard error.
Figure 3.
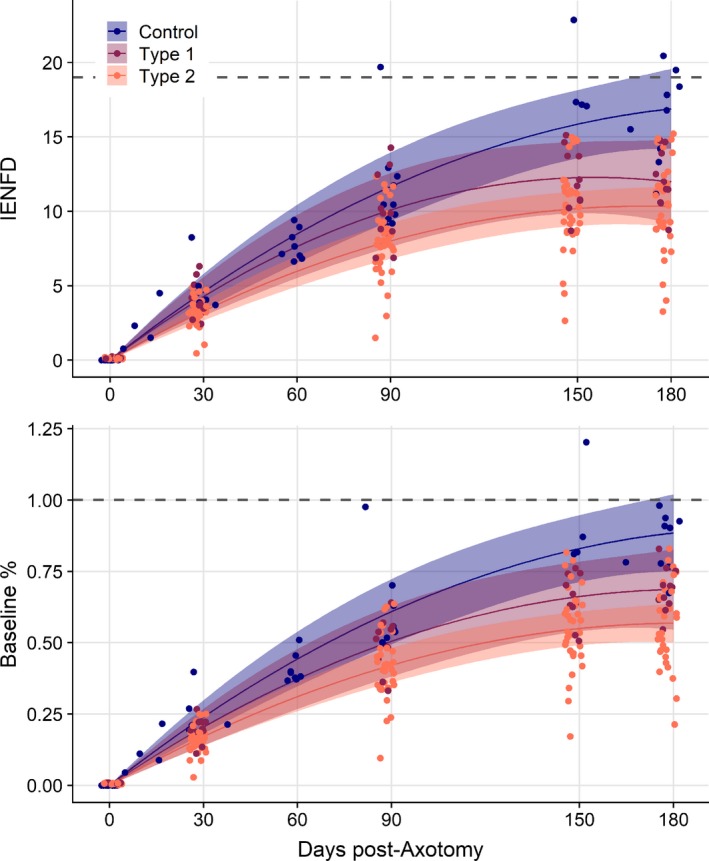
Fitted absolute intraepidermal nerve fiber density (IENFD) and percent of baseline IENFD regeneration trajectories of intraepidermal axons after chemical axotomy over 180 days in patients with diabetes types 1 and 2, and healthy controls, controlling for baseline IENFD, age, and BMI. Lines and 95% confidence bounds represent the estimated trajectories for IENFD regeneration following chemical axotomy, estimated from the longitudinal mixed effects model, with baseline IENFD = 19 fibers/mm, age = 52 years, and BMI = 29.7 (study subject median values). Points represent estimated values for study individuals, re‐estimated assuming these values for baseline IENFD, age, and BMI, but incorporating individual regeneration rates and variability. Even when controlling for baseline IENFD, age, and BMI individuals with diabetes type 2 continue to regenerate slower, to a lower absolute level, and to a lower percent of baseline. An individual without diabetes will regenerate to nearly 100% in 180 days, the same individual with diabetes type 1 or type 2 will reach much lower levels (bottom panel). Additionally, this individual without diabetes continues regenerating throughout the 6‐month interval and after. However, with diabetes (maroon and orange lines), regeneration rate slows at a greater rate, plateauing prior to day 180.
Regeneration rates over 180 days were significantly slower in diabetic patients than controls, both in terms of absolute IENFD per day and percent of baseline per day (Table 2). This resulted in control subjects regenerating nearly twice the absolute density (19.5 vs. 12.4 and 10.9 fibers/mm) during the 6‐month follow‐up period and attaining significantly higher mean percentage of baseline than subjects with type 1 or 2 diabetes (90% vs. 76% and 58%, Table 2). Regeneration rates and the absolute return of IENFD did not differ between type 1 and type 2 patients (P = 0.4 and P = 0.4); however, after adjusting for lower baseline densities in type 1 subjects, we found type 1 patients attained a significantly higher percentage of baseline levels (76% vs. 58%, P = 0.01) than type 2 subjects (Table 2). Taken together, the data indicate that control subjects regenerate more quickly and for a longer period than subjects with diabetes, with type 1 subjects regenerating more quickly and completely than type 2 subjects (Fig. 2).
In the multivariable longitudinal model, while slightly nonsignificant, subject type (control, type 1, or type 2), demonstrated a substantial effect on the regeneration rate (Table 3). Type 2 subjects regenerated slower than controls and type 1 diabetics, with absolute regeneration rates slower by 0.044 [95% CI, −0.008 to 0.097] and 0.037 [95% CI, −0.019 to 0.092] fibers/mm per day. Increasing age significantly reduced regeneration, with absolute rate of density regeneration decreasing by 0.001 (95% CI, 0 to 0.003) fibers/mm per day and 0.01% (95% CI, 0.0002 to 0.017%) of baseline density per day. Baseline density increased the absolute density rate by 0.008 (95% CI, 0.006 to 0.011) fibers/mm per day, but had no effect on percent of baseline regeneration rate. BMI had no significant effect on either absolute density (0.000, [95% CI, −0.003 to 0.003) nor percent of baseline regeneration (0.000, [95% CI, −0.015 to 0.013]). We found duration of diabetes was negatively associated with regeneration rate and total amount, but only among type 1 diabetic patients, with a reduction in regeneration rate of 0.004 [95% CI, 0.00005–0.008] fibers/mm per day with each additional year of diabetes (P = 0.05; for type 2, P = 0.6). The lack of an association between diabetes duration and regeneration in type 2 diabetes may be attributed to the difficulty in accurately identifying the onset of type 2 diabetes.
Table 3.
Regeneration rate coefficients from multivariable mixed effects model.
| Regeneration Rate (per day) | Regeneration Acceleration (per day2)a | |||||
|---|---|---|---|---|---|---|
| Mean | 95% CI | P‐value | Mean | 95% CI | P‐value | |
| Absolute Regeneration (fibers/mm) | ||||||
| Controls | 0.165 | (0.118–0.212) | <0.001 | −0.0004 | (−0.00066 to −0.00013) | 0.005 |
| Type 1 | 0.158 | (0.107–0.209) | <0.001 | −0.0005 | (−0.0008 to −0.00021) | 0.001 |
| Type 2 | 0.121 | (0.096–0.146) | <0.001 | –0.0003 | (−0.00049 to −0.00021) | <0.001 |
| Baseline IENFD | 0.008 | (0.006–0.011) | <0.001 | −0.00003 | (−0.00004 to −0.00001) | <0.001 |
| BMI (kg/m2) | 0 | (−0.003–0.003) | 0.97 | 0 | (−0.00002–0.00002) | 0.93 |
| Age (years) | −0.001 | (−0.003–0) | 0.05 | 0.00001 | (0–0.00002) | 0.262 |
| Percent of Baseline IENFD | ||||||
| Controls | 0.86% | (0.6339–1.0895%) | <0.001 | −0.000021% | (−0.003329 to −0.000784%) | 0.002 |
| Type 1 | 0.74% | (0.4892–0.993%) | <0.001 | −0.000020% | (−0.003417 to −0.00058%) | 0.007 |
| Type 2 | 0.62% | (0.4971–0.7423%) | <0.001 | −0.000017% | (−0.00238 to −0.000996%) | <0.001 |
| Baseline IENFD | 0.01% | (−0.0058–0.0178%) | 0.33 | −0.000001% | (−0.000123–0.000011%) | 0.106 |
| BMI (kg/m2) | 0.00% | (−0.0149–0.0134%) | 0.92 | 0% | (−0.000081–0.000078%) | 0.963 |
| Age (years) | –0.01% | (−0.0168 to −0.0002%) | 0.05 | 0% | (−0.000003–0.000091%) | 0.072 |
These regeneration rates were estimated using a mixed effect linear regression model, with a random effect for study participant across repeated measures. The model included variables for day of measurement and a quadratic term for day (i.e., day2) to account for declining rates over time. Covariates were included as interactions with day/day2 variables to account for rates among study participant type (control, type 1, and type 2 diabetes) and effects on rates by baseline IENFD, BMI, and age. Both controls and type 1 diabetic subjects regenerated significantly faster than type 2 diabetic subjects. While controlling for other variables, increased baseline IENFD was associated with increased absolute regeneration rate, age was associated with decreased regeneration rate and BMI had no effect on regeneration rate, neither absolute nor percent of baseline.
Regeneration rate accounts for the effect of each coefficient on the number of fibers regenerated per day, while regeneration acceleration is captured by the quadratic term (day^2) and accounts for the effect of each variable on the deceleration of regeneration (the leveling off).
At each time‐point, regeneration rates were significantly slower among diabetic cases compared to controls, and regeneration among cases stopped earlier than controls (Table 4, Fig. 3). The rate of regeneration among control subjects through 90 days was comparable to what we had observed demonstrating the reproducibility of the model.9 Seven of 11 (64%) type 1 diabetic cases and 22 of 36 (61%) type 2 cases stopped regenerating before 180 days (Fig. 1). Among controls, for which measurements were taken at 150 days for all of them, 8 of 10 (80%) had positive regeneration trajectories approaching the 180‐day visit. From the fitted multivariable longitudinal models, we estimate type 1 patients continued to regenerate on average for 156 days (95% CI, 125–247) and type 2 patients for 170 days (145–211), while control subjects attained maximum regeneration at 231 days (95% CI, 179–318). When controlling for baseline IENFD, age, and BMI, we see controls regenerate faster, to a greater percent of baseline, and to a greater final density than both type 1 and type 2 diabetics (Figs. 2, 3). Similarly, type 1 diabetics have better nerve regeneration outcomes compared with type 2 diabetics, though this was not significant.
Table 4.
Rate of regeneration at 0, 30, 60, 90, and 180 days post chemical‐axotomy.
| Regeneration Rate | Controls | Type 1 | Type 2 |
|---|---|---|---|
| (n = 10) | (n = 11) | (n = 36) | |
| Density per day (fibers/mm/day) | |||
| 0 days post‐axotomy | 0.165 | 0.157 | 0.12 |
| 30 days post‐axotomy | 0.141 | 0.127 | 0.099 |
| 60 days post‐axotomy | 0.117 | 0.096 | 0.078 |
| 90 days post‐axotomy | 0.093 | 0.066 | 0.057 |
| 180 days post‐axotomy | 0.022 | −0.025 | −0.006 |
| Percent of baseline per day (%/day) | |||
| 0 days post‐axotomy | 0.86% | 0.74% | 0.62% |
| 30 days post‐axotomy | 0.74% | 0.62% | 0.52% |
| 60 days post‐axotomy | 0.61% | 0.50% | 0.42% |
| 90 days post‐axotomy | 0.49% | 0.38% | 0.31% |
| 180 days post‐axotomy | 0.12% | 0.02% | 0.01% |
Rates were estimated from longitudinal data using a linear mixed effects model, with random effect for study subject and controlling for baseline density, body mass index (BMI), and age. These regeneration rates assume a baseline density of 19 fibers/mm, BMI of 29.7, and age of 52 years (study medians).
Discussion
We used a standardized capsaicin chemical axotomy model to study the rate and extent of nerve regeneration in subjects with diabetes and healthy controls.12, 13 We report that subjects with diabetes but no neuropathy regenerate more slowly and plateau without reaching baseline levels of IENFD while healthy control subjects regenerate epidermal nerve fibers more quickly and for a longer period, returning to baseline levels by 180 days. Subjects with type 1 diabetes showed a trend to regenerate better than those with type 2 diabetes, attaining a higher percent of baseline despite having a longer duration of disease. In some of the healthy controls, IENFD reached a level higher than baseline, which is consistent with the hyper‐innervation reported in the past after nerve injury.14
It has been previously shown that regeneration is deficient in animal models of diabetes15, 16 and diabetic individuals and potentially an underlying mechanism for diabetic neuropathy.6, 9, 17 However, the long‐term outcome of nerve regeneration in diabetic patients was not previously studied. In this study, we show that 180 days after the chemical denervation of skin, IENFD does not return to baseline levels in the majority of diabetic patients with no evidence of neuropathy. As demonstrated in Figures 1 and 3, in diabetic patients, the trajectory of nerve regeneration slows over time and plateaus within the study period, with IENFD remaining significantly below baseline levels. The clinical significance of this incomplete regeneration may be substantial for diabetic patients, with or without neuropathy, reinforcing the importance of early diagnosis and intervention. For example, it has been shown that the outcome of carpal tunnel surgery is not favorable in patients with diabetes.18 Our results suggest that impaired regeneration could play a role in this less favorable outcome. Thus, correcting the entrapment before significant axonal degeneration occurs may be crucial to prevent irreparable damage. Similar rationale could be extended to other forms of peripheral nerve injury in diabetes, such as cervical and lumbar radiculopathy, which are reported to have poorer outcomes in diabetic patients after surgical treatment.19, 20 Furthermore, it is reported that the risk of chemotherapy‐induced neuropathy in elderly population is significantly higher with comorbid diabetes, even without pre‐existing neuropathy.21 In patients with type 1 diabetes who were treated with pancreas‐kidney transplantation and were normoglycemic for several years, repeat skin biopsy did not show improvement in IENFD, suggesting that axonal nerve regeneration does not occur despite long‐lasting normoglycemia.22
Among patients with diabetes, we found that type 1 patients regenerated to significantly higher percentages of their original baseline IENFD levels compared to type 2 patients. There was also a trend toward slower regeneration rate in type 2 patients, despite a longer duration of disease and lower baseline levels of nerve density among type 1 patients. Admittedly, diabetes onset in type 2 patients is often unclear and therefore disease duration is imprecise. However, this finding is consistent with other evidence suggesting differential effects of type 1 and type 2 diabetes on peripheral nerves.23, 24, 25, 26, 27 Additionally, it has been previously shown that glycemic control is more successful in reducing the risk of neuropathy from type 1 disease than type 2.28, 29, 30, 31 Finally, established diabetic neuropathy risk factors such as hypertension and elevated lipid levels are common comorbidities in type 2 diabetes and may explain the differences between the groups.32
Consistent with previous studies, we found no effect of HbA1c on the regeneration rate or ultimate regeneration outcome in diabetic patients. In animal models, it has previously been shown that while increased glycemic control can improve neuropathic outcomes in type 1,33 it does not prevent development or progression of neuropathy in type 2 diabetes.34, 35 Outcome trials have also shown that intensive glycemic control doesn’t change the neuropathic complications of type 2 diabetes over standard of care.29, 36 After 10 years, subjects in the UKPDS intensive treatment group achieved approximately a 1% improvement in HbA1c versus conventional treatment, yet there was no significant difference in the incidence of diabetic neuropathy between the two groups.29 A significant effect on development of neuropathy was finally observed between the two groups after 15 years. Additionally, we found no significant impact of BMI on the rate of nerve regeneration among our participants. Obesity is increasingly being recognized as a risk factor for neuropathy independent of diabetes.37, 38, 39 However, effect of BMI on nerve regeneration is poorly understood. Limited data from animal models suggest that obesity can impair nerve regeneration after injury.40 In human, the only data available is from the study of nerve regeneration for 30 days after chemical axotomy in patients with metabolic syndrome with or without diabetes.13 In this study, a reduced rate of regeneration was seen compared to historical control in patients with metabolic syndrome, but the effect of BMI on regeneration rate was not directly estimated. Our study was not aimed at studying the effect of BMI on nerve regeneration independent of diabetes, but was aimed to measure the effect of BMI as a covariate on rate of nerve regeneration in diabetic patients. Our finding suggests that within the diabetic population, factors other than direct metabolic consequences of hyperglycemia or obesity are important in regenerating axons. For example, changes in lipid metabolism,41 reduced expression of nerve growth factors,42, 43 structural distortion of extracellular matrix,44 and slowed proliferation and migration of Schwann cells45, 46 are all reported in animal models of diabetic neuropathy. These factors can create an inhospitable environment for nerve regeneration, contributing to the development of neuropathy.
There are several important limitations to this study. We did not have detailed data pertaining to blood pressure, tobacco use, detailed information on lipid profile, or other peripheral neuropathy risk factors. Furthermore, we only had cross‐sectional data for risk factors, while the cumulative effects of risk factors are likely most relevant. Additionally, our samples sizes were modest, limiting our power, though this was offset by the repeated measurements over time.
In this study, we find deficits in nerve regeneration likely play a key role in the progression to peripheral neuropathy, particularly among diabetic patients. We addressed two fundamental questions: 1) Do subjects with diabetes regain baseline innervation levels following a standardized nerve injury? In comparison to healthy controls, we found type 1 and type 2 diabetic patients attain significantly lower than their original nerve fiber densities 2) Are there differences between subjects with type 1 and type 2 diabetes? We found slower distal axon regeneration rates among type 2 subjects as compared to type 1, despite potentially shorter durations of disease and higher baseline IENFDs. The damage accumulated from this slowed and abbreviated regrowth in diabetic patients is likely a major contributor to the progression of diabetic neuropathy and its clinical consequences. Furthermore, the differences between type 1 and type 2 diabetics likely explain the higher prevalence of diabetic neuropathy among type 2 patients.
Acknowledgment
We would like to thank Mark Rubenstein who supported this study by a philanthropic gift.
Author Contributions
MP, MK, and ST contributed to conception and design of the study, acquisition and analysis of data, drafting a significant portion of the manuscript or figures, and manuscript revision.
Conflict of Interest
The authors do not have any conflict of interest to disclose.
References
- 1. Dyck PJ, Lais A, Karnes JL, et al. Fiber loss is primary and multifocal in sural nerves in diabetic polyneuropathy. Ann Neurol. 1986;19:425–39. [DOI] [PubMed] [Google Scholar]
- 2. Lehtinen JM, Uusitupa M, Siitonen O, et al. Prevalence of neuropathy in newly diagnosed NIDDM and nondiabetic control subjects. Diabetes 1989;38:1307–13. [DOI] [PubMed] [Google Scholar]
- 3. Malik RA, Veves A, Walker D, et al. Sural nerve fibre pathology in diabetic patients with mild neuropathy: relationship to pain, quantitative sensory testing and peripheral nerve electrophysiology. Acta Neuropathol. 2001;101:367–74. [DOI] [PubMed] [Google Scholar]
- 4. Polydefkis M, Hauer P, Griffin JW, et al. Skin biopsy as a tool to assess distal small fiber innervation in diabetic neuropathy. Diabetes Technol Ther. 2001;3:23–8. [DOI] [PubMed] [Google Scholar]
- 5. Quattrini C, Jeziorska M, Boulton AJ, et al. Reduced vascular endothelial growth factor expression and intra‐epidermal nerve fiber loss in human diabetic neuropathy. Diabetes Care 2008;31:140–5. [DOI] [PubMed] [Google Scholar]
- 6. Dyck PJ, Zimmerman BR, Vilen TH, et al. Nerve glucose, fructose, sorbitol, myo‐inositol, and fiber degeneration and regeneration in diabetic neuropathy. N Engl J Med. 1988;319:542–8. [DOI] [PubMed] [Google Scholar]
- 7. Kennedy JM, Zochodne DW. The regenerative deficit of peripheral nerves in experimental diabetes: its extent, timing and possible mechanisms. Brain 2000;123(Pt 10):2118–29. [DOI] [PubMed] [Google Scholar]
- 8. Kennedy JM, Zochodne DW. Impaired peripheral nerve regeneration in diabetes mellitus. J Peripher Nerv Syst. 2005;10:144–57. [DOI] [PubMed] [Google Scholar]
- 9. Polydefkis M, Hauer P, Sheth S, et al. The time course of epidermal nerve fibre regeneration: studies in normal controls and in people with diabetes, with and without neuropathy. Brain 2004;127:1606–15. [DOI] [PubMed] [Google Scholar]
- 10. Ebenezer GJ, O'Donnell R, Hauer P, et al. Impaired neurovascular repair in subjects with diabetes following experimental intracutaneous axotomy. Brain 2011;134:1853–63. [DOI] [PMC free article] [PubMed] [Google Scholar]
- 11. Gibbons CH, Wang N, Freeman R. Capsaicin induces degeneration of cutaneous autonomic nerve fibers. Ann Neurol. 2010;68:888–98. [DOI] [PMC free article] [PubMed] [Google Scholar]
- 12. Khoshnoodi MA, Ebenezer GJ, Polydefkis M. Epidermal innervation as a tool to study human axonal regeneration and disease progression. Exp Neurol. 2017;287:358–64. [DOI] [PubMed] [Google Scholar]
- 13. Singleton JR, Marcus RL, Lessard MK, et al. Supervised exercise improves cutaneous reinnervation capacity in metabolic syndrome patients. Ann Neurol 2015;77:146–53. [DOI] [PMC free article] [PubMed] [Google Scholar]
- 14. Duraku LS, Hossaini M, Hoendervangers S, et al. Spatiotemporal dynamics of re‐innervation and hyperinnervation patterns by uninjured CGRP fibers in the rat foot sole epidermis after nerve injury. Mol Pain 2012;8:61. [DOI] [PMC free article] [PubMed] [Google Scholar]
- 15. Singh B, Singh V, Krishnan A, et al. Regeneration of diabetic axons is enhanced by selective knockdown of the PTEN gene. Brain 2014;137:1051–67. [DOI] [PMC free article] [PubMed] [Google Scholar]
- 16. Tu NH, Katano T, Matsumura S, et al. Na(+) /K(+) ‐ATPase coupled to endothelin receptor type B stimulates peripheral nerve regeneration via lactate signalling. Eur J Neurosci 2017;46:2096–2107. [DOI] [PubMed] [Google Scholar]
- 17. Sima AA, Bril V, Nathaniel V, et al. Regeneration and repair of myelinated fibers in sural‐nerve biopsy specimens from patients with diabetic neuropathy treated with sorbinil. N Engl J Med 1988;319:548–555. [DOI] [PubMed] [Google Scholar]
- 18. Gulabi D, Cecen G, Guclu B, et al. Carpal tunnel release in patients with diabetes result in poorer outcome in long‐term study. Eur J Orthop Surg Traumatol 2014;24:1181–1184. [DOI] [PubMed] [Google Scholar]
- 19. Guzman JZ, Iatridis JC, Skovrlj B, et al. Outcomes and complications of diabetes mellitus on patients undergoing degenerative lumbar spine surgery. Spine (Phila Pa 1976) 2014:1596–1604. [DOI] [PMC free article] [PubMed] [Google Scholar]
- 20. Guzman JZ, Skovrlj B, Shin J, et al. The impact of diabetes mellitus on patients undergoing degenerative cervical spine surgery. Spine (Phila Pa 1976;2014:1656–1665. [DOI] [PMC free article] [PubMed] [Google Scholar]
- 21. Hershman DL, Till C, Wright JD, et al. Comorbidities and risk of chemotherapy‐induced peripheral neuropathy among participants 65 years or older in Southwest oncology group clinical trials. J Clin Oncol 2016;34:3014–3022. [DOI] [PMC free article] [PubMed] [Google Scholar]
- 22. Havrdova T, Boucek P, Saudek F, et al. Severe epidermal nerve fiber loss in diabetic neuropathy is not reversed by long‐term normoglycemia after simultaneous pancreas and kidney transplantation. Am J Transplant. 2016;16:2196–2201. [DOI] [PubMed] [Google Scholar]
- 23. Sima AA, Kamiya H. Diabetic neuropathy differs in type 1 and type 2 diabetes. Ann N Y Acad Sci 2006;1084:235–249. [DOI] [PubMed] [Google Scholar]
- 24. Jende JME, Groener JB, Oikonomou D, et al. Diabetic neuropathy differs between type 1 and type 2 diabetes: Insights from magnetic resonance neurography. Ann Neurol 2018;83:588–598. [DOI] [PubMed] [Google Scholar]
- 25. Gibbons CH, Freeman R. Treatment‐induced neuropathy of diabetes: an acute, iatrogenic complication of diabetes. Brain 2015;138:43–52. [DOI] [PMC free article] [PubMed] [Google Scholar]
- 26. Schamarek I, Herder C, Nowotny B, et al. Adiponectin, markers of subclinical inflammation and nerve conduction in individuals with recently diagnosed type 1 and type 2 diabetes. Eur J Endocrinol 2016;174:433–443. [DOI] [PubMed] [Google Scholar]
- 27. Feldman EL, Callaghan BC, Pop‐Busui R, et al. Diabetic neuropathy. Nat Rev Dis Primers 2019;5:41. [DOI] [PubMed] [Google Scholar]
- 28. Effect of intensive diabetes treatment on nerve conduction in the Diabetes Control and Complications Trial. Ann Neurol 1995;38:869–880. [DOI] [PubMed] [Google Scholar]
- 29. Effect of intensive blood‐glucose control with metformin on complications in overweight patients with type 2 diabetes (UKPDS 34). UK Prospective Diabetes Study (UKPDS) Group. Lancet 1998;352:854–865. [PubMed] [Google Scholar]
- 30. Azad N, Emanuele NV, Abraira C, et al. The effects of intensive glycemic control on neuropathy in the VA cooperative study on type II diabetes mellitus (VA CSDM). J Diabetes Complications 1999;13:307–313. [DOI] [PubMed] [Google Scholar]
- 31. Azad N, Murphy J, Amos SS, et al. Nutrition survey in an elderly population following admission to a tertiary care hospital. CMAJ 1999;161:511–515. [PMC free article] [PubMed] [Google Scholar]
- 32. Tesfaye S, Chaturvedi N, Eaton SE, et al. Vascular risk factors and diabetic neuropathy. N Engl J Med 2005;352:341–350. [DOI] [PubMed] [Google Scholar]
- 33. Ziegler D, Behler M, Schroers‐Teuber M, et al. Near‐normoglycaemia and development of neuropathy: a 24‐year prospective study from diagnosis of type 1 diabetes. BMJ Open 2015;5:e006559. [DOI] [PMC free article] [PubMed] [Google Scholar]
- 34. Greene DA, De Jesus PV Jr., Winegrad AI. Effects of insulin and dietary myoinositol on impaired peripheral motor nerve conduction velocity in acute streptozotocin diabetes. J Clin Invest 1975;55:1326–1336. [DOI] [PMC free article] [PubMed] [Google Scholar]
- 35. Sharma AK, Duguid IG, Blanchard DS, et al. The effect of insulin treatment on myelinated nerve fibre maturation and integrity and on body growth in streptozotocin‐diabetic rats. J Neurol Sci 1985;67:285–297. [DOI] [PubMed] [Google Scholar]
- 36. Ismail‐Beigi F, Craven T, Banerji MA, et al. Effect of intensive treatment of hyperglycaemia on microvascular outcomes in type 2 diabetes: an analysis of the ACCORD randomised trial. Lancet 2010;376:419–430. [DOI] [PMC free article] [PubMed] [Google Scholar]
- 37. Callaghan BC, Xia R, Reynolds E, et al. Association between metabolic syndrome components and polyneuropathy in an obese population. JAMA Neurol. 2016;73:1468–1476. [DOI] [PMC free article] [PubMed] [Google Scholar]
- 38. Stino AM, Smith AG. Peripheral neuropathy in prediabetes and the metabolic syndrome. J Diabetes Investig 2017;8:646–655. [DOI] [PMC free article] [PubMed] [Google Scholar]
- 39. Callaghan BC, Gao L, Li Y, et al. Diabetes and obesity are the main metabolic drivers of peripheral neuropathy. Ann Clin Transl Neurol 2018;5:397–405. [DOI] [PMC free article] [PubMed] [Google Scholar]
- 40. Bekar E, Altunkaynak BZ, Balci K, et al. Effects of high fat diet induced obesity on peripheral nerve regeneration and levels of GAP 43 and TGF‐beta in rats. Biotech Histochem 2014;89:446–456. [DOI] [PubMed] [Google Scholar]
- 41. McGregor BA, Eid S, Rumora AE, et al. Conserved transcriptional signatures in human and murine diabetic peripheral neuropathy. Sci Rep 2018;8:17678. [DOI] [PMC free article] [PubMed] [Google Scholar]
- 42. Tomlinson DR, Fernyhough P, Diemel LT, et al. Deficient neurotrophic support in the aetiology of diabetic neuropathy. Diabet Med 1996;13:679–681. [DOI] [PubMed] [Google Scholar]
- 43. Tomlinson DR, Fernyhough P, Diemel LT. Role of neurotrophins in diabetic neuropathy and treatment with nerve growth factors. Diabetes 1997;46(Suppl 2):S43–S49. [DOI] [PubMed] [Google Scholar]
- 44. Duran‐Jimenez B, Dobler D, Moffatt S, et al. Advanced glycation end products in extracellular matrix proteins contribute to the failure of sensory nerve regeneration in diabetes. Diabetes 2009;58:2893–2903. [DOI] [PMC free article] [PubMed] [Google Scholar]
- 45. Gumy LF, Bampton ET, Tolkovsky AM. Hyperglycaemia inhibits Schwann cell proliferation and migration and restricts regeneration of axons and Schwann cells from adult murine DRG. Mol Cell Neurosci 2008;37:298–311. [DOI] [PubMed] [Google Scholar]
- 46. Duraikannu A, Krishnan A, Chandrasekhar A, et al. Beyond trophic factors: exploiting the intrinsic regenerative properties of adult neurons. Front Cell Neurosci 2019;13:128. [DOI] [PMC free article] [PubMed] [Google Scholar]