Introductory Paragraph
Since most dominant human mutations are single nucleotide substitutions1,2, we explored gene editing strategies to efficiently and selectively disrupt dominant mutations without affecting wild-type alleles. However, single nucleotide discrimination can be difficult to achieve3 because commonly used endonucleases, such as Streptococcus pyogenes Cas9 (SpCas9), can tolerate up to seven mismatches between gRNA and target DNA. Furthermore, the protospacer-adjacent motif (PAM) in some Cas9 enzymes can tolerate mismatches with the target DNA3,4. To circumvent these limitations, we screened 14 Cas9/gRNA combinations for specific and efficient disruption of a nucleotide substitution that causes the dominant progressive hearing loss, DFNA36. As a model for DFNA36, we used Beethoven mice5 , which harbor a point mutation in Tmc1, a gene required for hearing that encodes a pore-forming subunit of mechanosensory transduction channels in inner ear hair cells6. We identified a PAM variant of Staphylococcus aureus Cas9 (SaCas9-KKH) that selectively and efficiently disrupted the mutant allele, but not the wild-type Tmc1/TMC1 allele, in Beethoven mice and in a DFNA36 human cell line. AAV-mediated SaCas9-KKH delivery prevented deafness in Beethoven mice up to one year post transduction. Analysis of current ClinVar entries revealed that ~21% of dominant human mutations could be targeted using a similar approach.
To increase specificity of gene editing, truncated gRNAs7 or high fidelity Cas9 variants8-10 have been developed. To expand Cas9’s targeting range, variants that recognize different PAM sites have also been engineered11,12. The possibility that the PAM sequence itself could distinguish mutant from wild-type alleles has been suggested13,14, but the strategy has not been tested in vivo to ameliorate a disease phenotype.
We sought to develop allele specific genome editing strategies for dominant hearing loss, and focused on the Beethoven (Bth) mouse, an excellent model for DFNA36 hearing loss in humans5. The Bth mutation results in an amino acid substition (p.M412K, c.T1253A) in Tmc1. The mutation causes hair cell degeneration and progressive hearing loss in mice. In humans, the p.M418K substitution is identical to the Bth mutation in the orthologous position and causes DFNA36, dominant progressive hearing loss15. A recent study with cationic lipid delivery of Cas9:gRNA ribonucleoprotein complexes into the inner ears of Bth mice, showed modest improvement in hearing thresholds four weeks after treatment16. However, the effect was not sustained and cellular degeneration was not halted, perhaps because the strategy did not selectively or efficiently target the mutant allele.
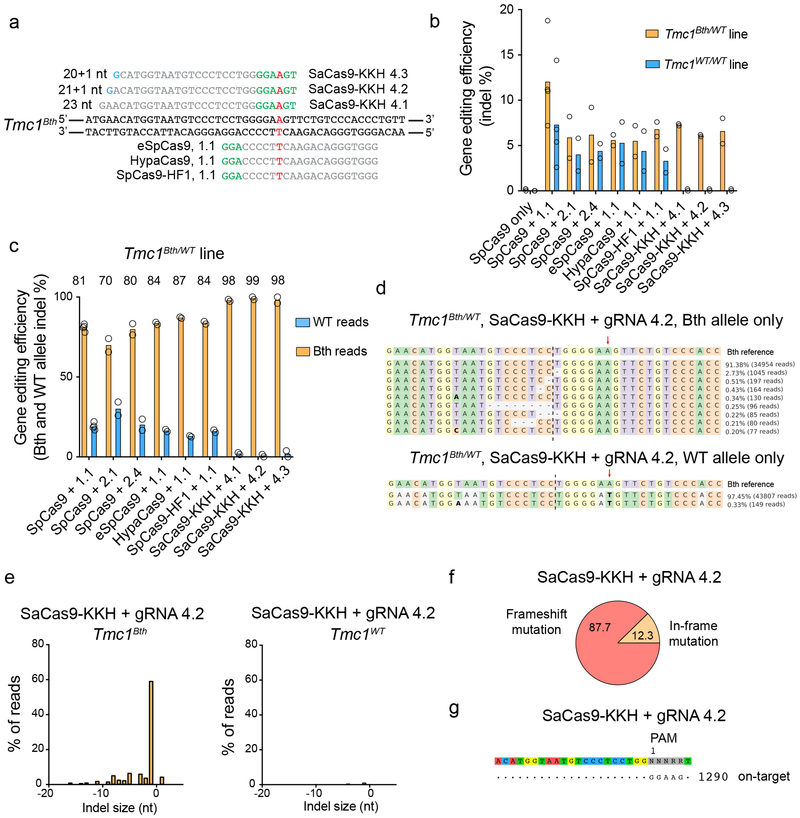
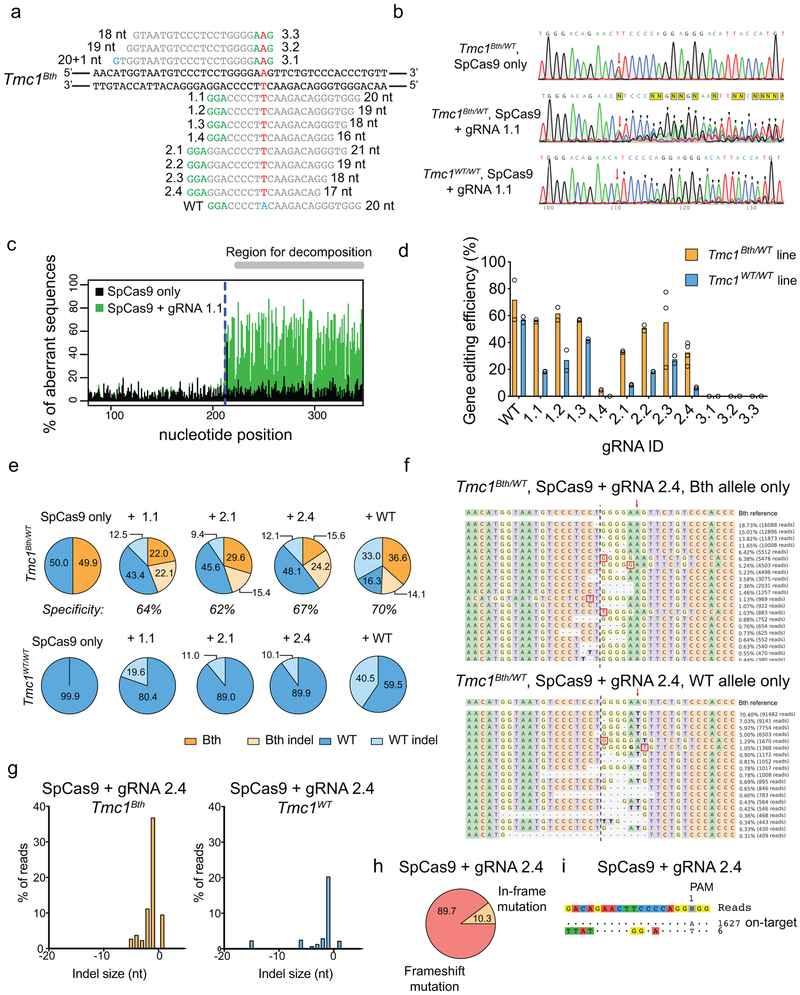
To selectively disrupt the Bth allele in fibroblasts from Tmc1Bth/WT mice (Tmc1WT/WT cells were used as controls), we screened various Cas9 and gRNA combinations in vitro. We tested SpCas9 in combination with 12 different gRNAs, including full-length and truncated forms targeting either Tmc1Bth or Tmc1WT (Extended Data Fig. 1). However, none of the various combinations, including the Cas9:gRNA combination previously reported to show transient improvement in auditory thresholds in Bth mice16 (gRNA 1.1 in our study), had the necessary specificity, as indel formation was evident in both Bth and WT alleles (Extended Data Fig. 1, Supplementary Dataset 1 and 2). To improve allele selectivity, we evaluated high-fidelity SpCas9 enzymes; however none mediated selective targeting of the Bth allele (Fig. 1a,b, Supplementary Dataset 3, Extended Data Fig. 2).
Figure 1:
Targeting Tmc1Bth allele with high-fidelity SpCas9s and SaCas9-KKH. (a) gRNA design. Mutation site is highlighted in red. PAM sites are marked by green nucleotides. Mismatching nucleotides are shown in blue. SaCas9-KKH: KKH PAM variant of SaCas9, eSpCas9(1.1), HypaCas9 and SpCas9-HF1 are different high fidelity variants of SpCas9 (used in combination with 1.1 gRNA, same as on Extended Data Fig. 1a). (b) Indel percent (mean) in Tmc1Bth/WT and Tmc1WT/WT fibroblasts determined by targeted deep-sequencing and CRISPResso analysis. SpCas9 with 1.1, 2.1 and 2.4 gRNA represent the same conditions as on Extended Data Fig. 1 (except that cells were not sorted for GFP expression), however experiments were repeated to allow for head-to-head comparison with SaCas9-KKH and high fidelity SpCas9 enzymes. Cells were transfected on two different occasions (SpCas9 only and SpCas9 + gRNA 1.1 on four occasions) and genomic DNA from two independent biological samples on each transfection day were pooled for sequencing. (c) Allele-specific indel analysis (mean) of the samples from (b) in Tmc1Bth/WT cells. Tmc1Bth and Tmc1WT reads were segregated using a Python script and indel percentages were analyzed for each allele. Thus, one condition represents indel formation in the same population of cells. The numbers above the graphs show specificity towards the Beethoven allele, expressed as percentages. (d) The most abundant reads in the SaCas9-KKH + gRNA 4.2 treated cells, shown separately for Tmc1Bth (top) and Tmc1WT (bottom) reads. The CRISPR cut site is marked by black dashed line. Dashes represent deleted nucleotides. Nucleotides in bold are substitutions, however these were not quantified as CRISPR actions. Sequences were aligned to Bth allele, thus in the bottom panel, WT sequence appears as a substitution (an A to T change). Mutation site is marked by red arrow. (e) Indel profiles from SaCas9-KKH + gRNA-4.2 transfected Tmc1Bth/WT fibroblasts. Tmc1Bth and Tmc1WT reads are plotted separately. Minus numbers represent deletions, plus numbers represent insertions. Sequences without indels (value=0) are omitted from the chart. (f) Indels causing in-frame vs. frame shift mutations (percentages are shown) in the coding sequence after SaCas9-KKH + gRNA 4.2 transfection. (g) GUIDE-Seq analysis on SaCas9-KKH + gRNA 4.2 transfected Tmc1Bth/WT fibroblasts. Genomic DNA was pooled from 3 biological replicates for sequencing on one occasion. The number next to read is read count in the GUIDE-Seq assay.
Next, we reasoned that a Cas9 nuclease with a PAM site selective for the mutant sequence might show specific targeting of the Tmc1Bth allele. The Bth mutation is a T to A change; thus, the GGAAGT sequence present in Tmc1Bth, but not in Tmc1WT (GGATGT), may allow the PAM site of the SaCas9-KKH variant11 (NNNRRT) to distinguish the Tmc1Bth from the Tmc1WT allele. We designed full-length and truncated gRNAs (Fig. 1a) and transfected plasmids expressing each of these together with SaCas9-KKH into fibroblasts. SaCas9-KKH induced indels only in Tmc1Bth/WT, but not in Tmc1WT/WT fibroblasts (Fig. 1b, Extended Data Fig. 2 and Supplementary Dataset 3). We also analyzed allele-specific indel formation in Tmc1Bth/WT cells to avoid potential differences in transfection efficiency between Tmc1Bth/WT and Tmc1WT/WT fibroblasts (Fig. 1c, and Supplementary Dataset 3). Allele-specific analysis revealed that 98–99% of all indels that occurred in Tmc1Bth/WT cells were present just in the mutant allele. The indel profile revealed that the majority of CRISPR-induced variants were deletions, the most common being a single base deletion causing a frame-shift (Fig. 1d-f and Supplementary Dataset 3). Single nucleotide changes were not frequent events and were not different between Cas9-treated and control cells (Extended Data Fig. 3). The few indels (less than 0.2%) in Tmc1WT/WT fibroblasts were not significantly different from indel rates in no-gRNA control samples, which likely reflect PCR/sequencing error (Extended Data Fig. 4). Importantly, SaCas9-KKH + gRNA 4.2 was specific for the Tmc1Bth allele; we did not detect cleavage at any genome-wide off-target sites using GUIDE-Seq (Fig. 1g).
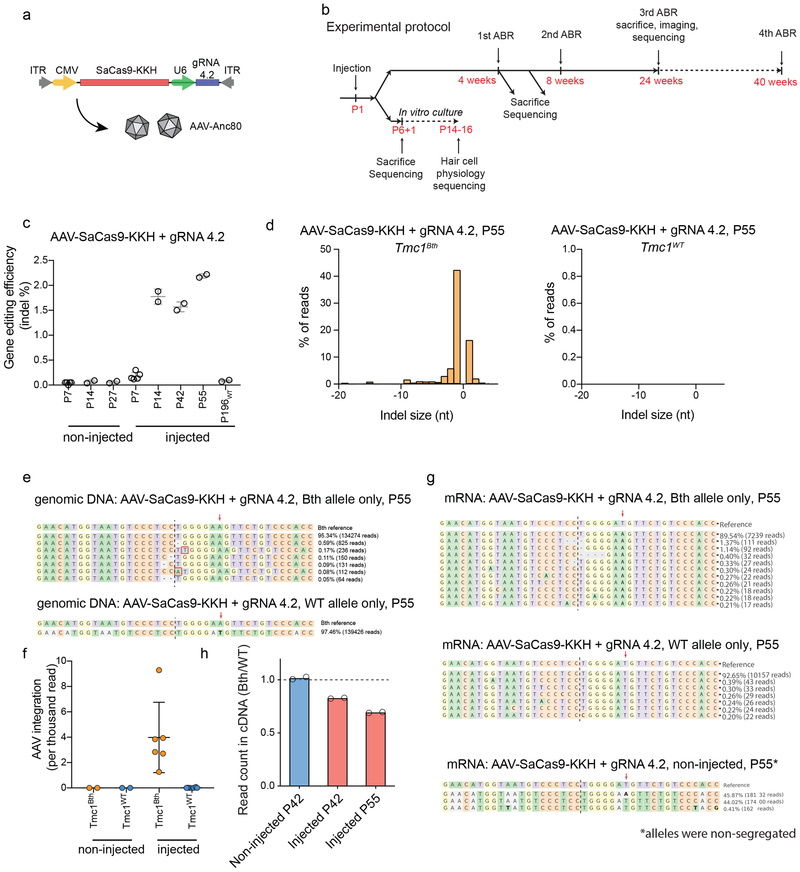
Next, SaCas9-KKH and gRNA 4.2 were packaged into Anc80L65 capsids17 (Fig. 2a) for delivery to sensory hair cells of the cochlea. One microliter of virus was injected into the inner ears of P1 mice (Fig. 2b). We performed targeted deep sequencing from whole cochlear tissue at different ages post-injection and in non-injected animals (Fig. 2c). In whole cochlea, in which supporting cells vastly outnumber viral-targeted hair cells, we observed 0.2%, 1.8%, 1.6% and 2.2% indel frequencies at 7, 14, 42 and 55 days after injection, respectively. Indel formation in injected WT animals was not different from background even after 196 days (Fig. 2c, for statistical analysis see: Supplementary Table 1). We detected indel formation only in the Tmc1Bth allele but not in the Tmc1WT allele in injected Tmc1Bth/WT animals (Fig. 2d, e). Next, we used a more sensitive, independent analysis—the presence of AAV inverted terminal repeats in the cut site18—to investigate allele selectivity of SaCas9-KKH. In non-injected Tmc1Bth/WT animals, we did not detect AAV reads within the Tmc1 gene (Fig. 2f) but AAV integration was evident in the Tmc1Bth allele in all injected animals at P42 or P55. However, we found only three unique Tmc1WT reads with AAV integration in 45 injected mice, corresponding to a 0.0075% indel rate (Supplementary Note 1), suggesting little SaCas9-KKH activity on the WT allele. As a final test, we analyzed gene editing at the mRNA level. In contrast to non-injected Tmc1Bth/WT animals, we observed some indel formation at the mRNA level in injected animals at P55 (0.83% in injected animals, Fig. 2g), but only in mutant alleles. We also observed a 24% decrease (Fig. 2h) in non-modified Bth mRNA relative to non-modified WT mRNA in injected animals (Supplementary Note 2).
Figure 2:
In vivo genome editing with SaCas9-KKH. (a) Schematic of the AAV vector used in the study. (b) Experimental overview for in vivo studies. (c) Targeted deep sequencing from noninjected or AAV-SaCas9-KKH-gRNA-4.2 injected whole cochleas (mean ± SD). In non-injected animals, background indel frequencies ranged between 0.05 - 0.06%. Every data point represents a unique sequencing reaction from pooled cochleas (Supplementary Table 6 includes the number of cochleas each data point, number of independent sequencing reactions for non-injected: 5 (P7), 2 (P14), 2 (P27), injected: 5 (P7), 2 (P14), 2 (P42), 2 (P55) and 2 (P196 WT)). ANOVA was performed to describe overall difference (F=445.8, p<0.0001) followed by Tukey’s post hoc test (for statistical results see Supplementary Table 1). (d) Indel profiles from AAV-SaCas9-KKH-gRNA-4.2 injected Tmc1Bth/WT animals. Tmc1Bth and Tmc1WT reads are plotted separately. Minus numbers represent deletions, plus numbers represent insertions. Sequences without indels (value=0) are omitted from the chart. (e) The most abundant reads in the AAV-SaCas9-KKH + gRNA 4.2 injected Tmc1Bth/WT animals, shown separately for Tmc1Bth (top) and Tmc1WT (bottom) reads. Representation is similar to Extended Data Figs. 1f. (f) AAV integration into the Tmc1Bth and Tmc1WT alleles in non-injected and injected Tmc1Bth/WT animals at P14-P55. Mean ± SD, number of independent experiments and sequencing reactions: 2 for non-injected and 6 for injected). Supplementary Table 6 includes the age and number of cochleas for each data point. (g) Indel profiles and read abundance at the mRNA level from AAV-SaCas9-KKH-gRNA-4.2 injected Tmc1Bth/WT animals. Data representation is similar to Extended Data Figs. 1f. (h) Relative read counts for Tmc1Bth and Tmc1WT representing mRNA in non-injected and injected animals (Supplementary Table 6 includes age and number of cochleas for each data point). The dashed line represents an equal ratio (ratio=1). (ANOVA, p=0.0001, Dunnett’s multiple comparisons: p=0.0005 for injected (P42) vs non-injected (P42) and p=0.0001 for injected (P55) vs non-injected (P42)).
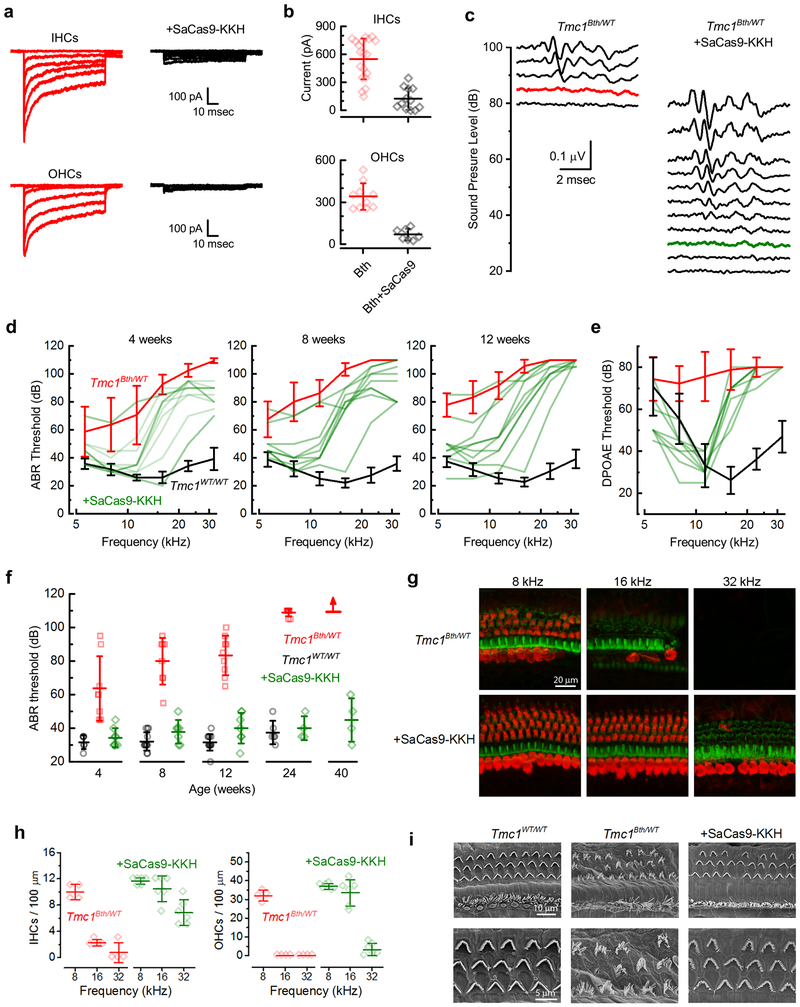
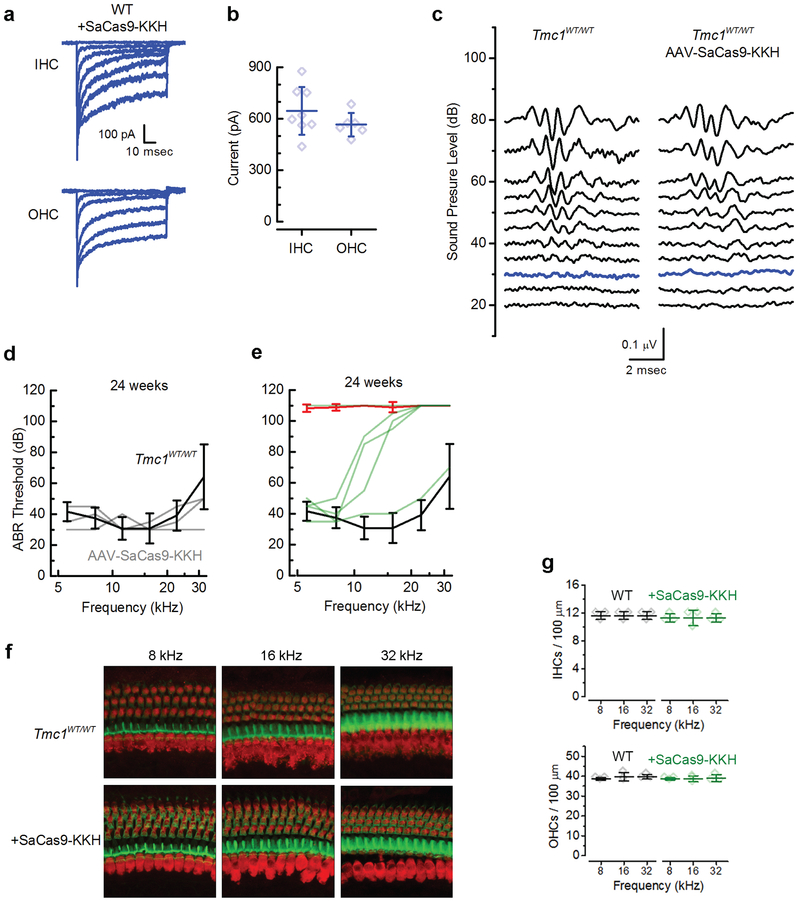
Next, we investigated whether the consequences of SaCas9-KKH-mediated disruption of the Bth allele could be detected in hair cell mechanosensory transduction current. Although the Bth mutation eventually causes cell death, the mutation does not cause a loss of mechanosensitivity19. Single-cell electrophysiology was performed on hair cells from either Tmc1WT/WT or Tmc1Bth/Δ mouse pups on a Tmc2Δ/Δ background because Tmc2 contributes to mechanosensory currents and is expressed transiently at neonatal stages20. After injection of AAV-SaCas9-KKH-gRNA-4.2 at P1, cochleas were dissected at P5-P7 and cultured 8–10 days, or the equivalent of P14-P16. Both inner (IHCs) and outer hair cells (OHCs) from injected Tmc1WT/WT mice showed normal current amplitudes (Extended Data Fig. 5a, b) similar to WT amplitudes reported previously17,19,21, which indicated no disruption of the Tmc1WT allele. Tmc1Bth/Δ;Tmc2Δ/Δ hair cells from mice injected with AAV-CMV-SaCas9-KKH-U6-gRNA-4.2 showed a significant reduction in current amplitude in both OHCs and IHCs, relative to hair cells of uninjected Tmc1Bth/Δ;Tmc2Δ/Δ mice, in some cases almost completely abolishing the current (Fig. 3a, b).
Figure 3:
Effects of SaCas9-KKH+sgRNA4.2 on inner ear function in Bth mice. (a) Representative sensory transduction currents recorded at P14-16 from apical IHCs and OHC of uninjected Tmc1Bth/Δ;Tmc2Δ/Δ mice (left) and those injected with AAV-SaCas9-KKH-sgRNA4.2 at P1-P2 (right). (b) Mean ± SEM maximal current amplitudes, measured at P14-16 for uninjected IHCs (n = 19; top) and OHCs (n = 10; bottom) from uninjected Tmc1Bth/Δ; Tmc2 Δ/Δ (red) and injected (black) mice. (IHCs: 124 ± 118 pA, n = 7, p = 3.4×10⁻⁶; OHCs: 71 ± 41 pA, n = 12, p = 8.1×10⁻⁷; unpaired two-tailed t-test). (c) Families of ABR waveforms recorded at eight weeks from an uninjected Tmc1Bth/WT mouse (left) and a Tmc1Bth/WT mouse injected with AAV-SaCas9-KKH-gRNA-4.2 at P1 (right). Bolded traces indicate threshold. Scale bar applies to all traces. (d) ABR thresholds plotted as a function of frequency for ten injected Tmc1Bth/WT mice (green). Mean ± S.D. ABR thresholds for uninjected Tmc1Bth/WT (red, n = 8), and uninjected Tmc1WT/WT control mice (black) tested at 4 (n = 6), 8 (n = 12) and 12 (n = 12) weeks. (e) DPOAE thresholds verses stimulus frequency at 12 weeks for eight injected Tmc1Bth/WT mice (green). Mean ± S.D. DPOAE thresholds for uninjected Tmc1Bth/WT (red, n = 9), and uninjected Tmc1WT/WT control mice (black, n = 13). (f) Mean ± S.D. ABR thresholds at 8 kHz verses age, from 4 to 40 weeks (WT: n = 6, 12, 12, 6; Tmc1Bth/WT: n = 8, 8, 9, 9, 6; +SaCas9-KKH: n = 8, 7, 7, 4, 4; one-way ANOVA, p = 0.32). (g) Representative confocal images of 100-μm cochlear sections harvested at 24 weeks from 8, 16, and 32 kHz regions of four uninjected (top), and six injected Tmc1Bth/WT mice (bottom). Tissue was stained for MYO7A (red) and actin (green). (h) Mean ± S.D. number of IHCs (left) and OHCs (right) per 100-μm section for four uninjected and six injected Tmc1Bth/WT mice (i) SEM images of the apical cochlear sensory epithelium showing hair bundle morphology for one uninjected Tmc1WT/WT (left), one uninjected Tmc1Bth/WT (middle), and one injected Tmc1Bth/WT mouse (right).
We next measured auditory brainstem responses (ABR) and distortion product otoacoustic emissions (DPOAE) in Bth mice using our allele-specific SaCas9-KKH nuclease (Fig. 2b). In 8-week old Tmc1Bth/WT mice, ABR recordings revealed elevated hearing thresholds (90 dB at 8 kHz; Fig. 3c) compared to WT controls (30 dB, Extended Data Fig. 5), consistent with the progressive hearing loss in Bth mice. In Tmc1Bth/WT animals injected with AAV-SaCas9-KKH-gRNA-4.2, we observed improved thresholds at eight weeks (45 dB median threshold; Fig. 3c, d). At four weeks, the mouse with the greatest hearing preservation had ABR thresholds of 20–35 dB in the 5–16 kHz test range, indistinguishable from wild-type mice (Fig. 3d).
Since the Bth mutation causes progressive hearing loss, we measured the time course of hearing sensitivity in Tmc1Bth/WT and Tmc1WT/WT animals 4, 8, 12 and 24 weeks after injection at frequencies from 5.6 to 32 kHz (Fig. 3d, f and Extended Data Fig. 5d,e). At 4 weeks of age, uninjected Bth mice had low frequency hearing but high frequency hearing loss (Fig. 3d), similar to previous reports5,16. At later time points, ABR thresholds were progressively elevated, and at 24 weeks of age, no ABR thresholds were detected in untreated Bth mice (Extended Data Fig. 5e). In contrast, Bth mice injected with AAV-SaCas9-KKH-gRNA-4.2 showed normal or near-normal ABR thresholds at low frequencies (8kHz, injected: 38 ± 11 dB n = 9; uninjected: 64 ± 19 dB n = 8), and improved, but not completely normalized, ABR thresholds at high frequencies (22kHz, injected: 84 ± 15 dB n = 9; uninjected: 103 ± 5 dB n = 8). In contrast to uninjected Bth mice, ABR thresholds in injected mice did not deteriorate over time (8 kHz, 8 weeks: 45 ± 15 dB n = 9; 12 weeks: 48 ± 17 dB n = 10; 24 weeks: 40 ± 7 dB, n = 4; Fig. 3f). At 24 weeks, injected mice exhibited normal or near-normal thresholds at 5–8 kHz, while untreated animals were profoundly deaf. One injected animal showed remarkable preservation of hearing even in high frequencies at 24 weeks of age (Extended Data Fig. 5e).
ABR peak 1 (P1) amplitudes were in the normal range for most of the injected Bth mice at 8 weeks, in contrast to non-injected animals, which showed small P1 amplitudes only at high sound intensities (Extended Data Fig. 6a). Latencies of P1 waves of injected Tmc1Bth/WT animals were also normalized by injection (Extended Data Fig. 6b). To test OHC function, we performed DPOAE measurements at 4, 8, 12 and 24 weeks after injection. Like the ABRs, DPOAE thresholds in injected Bth mice revealed preservation of outer hair cell function at lower frequencies (5–11 kHz) at 12 weeks of age (Fig. 3e) and in the surviving animals, up to 24 weeks of age. We also investigated whether AAV-SaCas9-KKH-gRNA-4.2 injection disrupts hearing in wild-type animals. We performed ABRs and observed no ABR or DPOAE threshold shifts, even 24 weeks post-injection (Extended Data Fig. 5d, 8kHz, injected: 38 ± 8 dB n = 3; uninjected: 38 ± 6 dB n = 6) confirming that AAV-SaCas9-KKH does not disrupt hearing function in Tmc1WT/WT mice.
In one cohort of four Bth mice we measured ABR thresholds 40 weeks post-injection. We tracked thresholds (8kHz) between 4 and 40 weeks and excluded data from two mice with failed injections, based on histological examination (below). Thresholds were stable over time and only slightly elevated relative to WT mice (Fig. 3f). Two mice that survived to one year of age had stable ABR thresholds of 35 and 40 dB at 8 kHz.
Next, we evaluated hair cell survival in injected and non-injected Tmc1Bth/WT and Tmc1WT/WT animals. Following ABR and DPOAE evaluations, mice were sacrificed at 24 weeks of age. Surviving hair cells were identified with an antibody for MYO7A and phalloidin staining for actin. IHCs and OHCs were present in uninjected Tmc1WT/WT mice and those injected with AAV-SaCas9-KKH-gRNA-4.2(Extended Data Fig. 5f, 5g). In contrast, uninjected Tmc1Bth/WT animals showed significant hair cell loss in all regions (Fig. 3g, h). In the low-frequency (8 kHz) apex, many hair cells were missing, and in the 16 and 32 kHz regions, essentially all hair cells were absent. In contrast, injected Tmc1Bth/WT animals showed normal sensory epithelia in the 8 and 16 kHz regions (Fig. 3g, h), with minimal hair cell loss. In the basal region (32 kHz) IHCs, but not OHCs survived (Fig. 3g, h). We also found that mean ABR thresholds were correlated with the percent of surviving hair cells at the low frequency end of the cochlea (Extended Data Fig. 6c).
Hair bundle morphology was evaluated with scanning electron microscopy, in Bth and WT hair cells. In uninjected Tmc1WT/WT animals at 24 weeks of age, IHCs and OHCs showed classical staircase organization of hair bundles (Fig. 3i). In contrast, surviving hair cells from Tmc1Bth/WT animals showed significant bundle disorganization. Hair cells from SaCas9-KKH-injected mice, however, showed preservation of normal hair bundle morphology in both IHCs and OHCs (Fig. 3i). These results are concordant with the ABR data, which showed robust preservation of thresholds at low frequencies (8 and 16 kHz), but less restoration at high frequencies (32 kHz). Together, these results suggest robust therapeutic benefit of AAV-SaCas9-KKH-gRNA-4.2 injection in Bth mice.
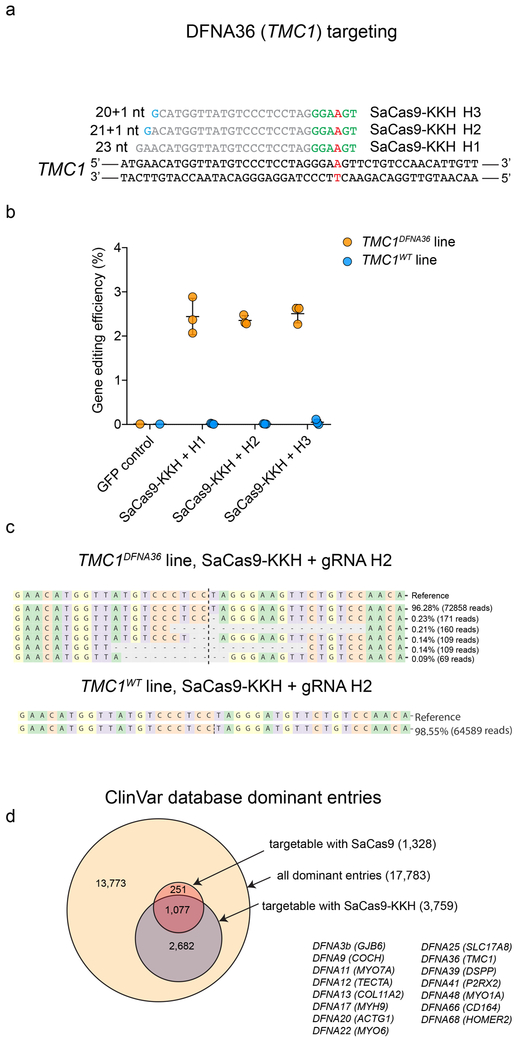
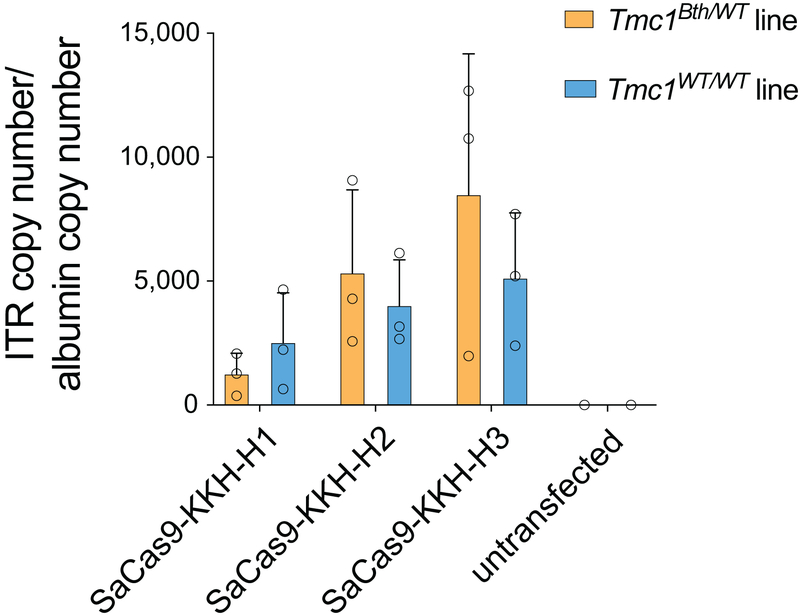
To validate our strategy for targeting the human p.M418K mutation, we created a haploid human cell line containing the p.M418K mutation in TMC1 (c.T1253A). TMC1DFNA36 and TMC1WT cells were transfected with SaCas9-KKH and 3 different gRNAs targeting the mutant allele (Fig. 4a). Transfection efficiency was similar between the two lines (Extended Data Fig. 7). Targeted deep sequencing of TMC1 revealed indel formation in the TMC1DFNA36 line, but no indel formation in the TMCWT line (Fig. 4b and Extended Data Fig. 8) suggesting specific disruption of the mutant allele. The most common indel event was a single nucleotide deletion but we also observed larger deletions (Fig. 4c). These results suggest that our strategy translates to human cells, and that allele-specific targeting of dominant mutations holds promise for preventing dominant hearing loss. In addition to the TMC1 p.M418K mutation (DFNA36), we identified 15 other dominant mutations in deafness genes potentially targetable with SaCas9-KKH (Fig. 4d and Supplementary Table 2). To further generalize our results we analyzed all known dominant human mutations for possible specific PAM targeting using SaCas9 and SaCas9-KKH. SaCas9 has a unique PAM requirement of ‘GRRT’, while SaCas9-KKH has a PAM requirement only of ‘RRT’. Of 17,783 dominant entries (Supplementary Table 3) in the ClinVar database (see Supplementary Note 3), the SaCas9 GRRT PAM site was evident in 1,328 variants (7.5%) (Supplementary Table 4, Fig, 4d), while the SaCas9-KKH PAM site may be able to distinguish mutant from wild-type for 3,759 dominant alleles (21.1%) (Supplementary Table 5, Fig. 4d).
Figure 4:
Human dominant mutations, potentially targetable with SaCas9 and SaCas9-KKH, and allele-specific targeting of human DFNA36. (a) All human dominant mutations in the ClinVar database (accessed 2019.03.25) and mutations targetable with SaCas9 and SaCas9-KKH. (b) gRNA design targeting a human DFNA36 allele. Mutation site is highlighted in red. PAM sites are marked by green nucleotides. Mismatching nucleotides are shown in blue. (c) Genome editing efficiency (indel formation percentage) in haploid TMC1DFNA36 and TMC1WT cells after transfection with SaCas9-KKH and H1, H2, H3 gRNA (mean ± SD, 3 biological replicates sequenced independently). Control cells were transfected with GFP only. (d) Types of indels in the case of H2 gRNA in TMC1DFNA36 and TMC1WT cells (CRISPResso analysis, similar results were obtained from all gRNAs and all biological replicates).
For the current study we screened multiple gene editing strategies for specific disruption of the Beethoven mutation in Tmc1, a gene critical for auditory function6. We compared gRNAs with different PAM locations, truncated gRNAs, high-fidelity Cas9 enzymes and a SaCas9 variant characterized by an NNNRRT PAM site11. All gRNAs with SpCas9 of high fidelity Cas9 enzymes had significant activity at the WT allele, suggesting that selective single-base discrimination cannot be achieved with gRNAs targeting the Bth allele. In contrast, targeting the mutation with SaCas9-KKH, led to undetectable WT allele disruption, suggesting that the T to A change was not tolerated by this PAM-variant enzyme.
Our results represent a significant improvement over previous strategies, where hearing preservation was modest and not sustained even at low frequencies16,22,23. In the Gao et al. study16, the limited durability may have been due to an insufficient number of transfected hair cells with lipid-mediated Cas9/gRNA delivery; the subsequent cell death may have resulted from non-cell autonomous factors, as described for genetic mutations that affect the retina24. Another possibility is that lack of specificity16 led to cumulative inactivation of the WT allele. With our approach, AAV-mediated SaCas9-KKH delivery durably improved hearing preservation out to one year of age with no toxicity. We did not detect indel formation or elevated hearing thresholds in WT mice even 196 days after SaCas9-KKH injection. Furthermore, we did not detect off-target effects in cultures of primary fibroblasts with SaCas9-KKH + gRNA 4.2 despite the high level of on-target activity. Importantly, the human TMC1 mutation described by Zhao et al15 (p.M418K, c.T1253A) is also amenable to allele-specific SaCas9-KKH gene disruption. In human HAP1 cells, indel formation was only observed in the mutant TMC1 p.M418K allele, but not the wild-type allele.
While this study focuses on a single missense mutation observed in relatively few hearing loss patients, our ClinVar database analysis revealed that 3,759 dominant disease variants (Supplementary Note 3) are potentially amenable to SaCas9-KKH disruption, which contrasts with S. aureus Cas9WT with 1,328 potential targets. Thus, our PAM-selective strategy has potential broad application, as roughly one quarter of all dominant human mutations may be amenable to allele-specific disruption with SaCas9-KKH, suggesting a precision approach for selective silencing of thousands of human diseases genes.
Online Methods
Animals
All animals were bred and housed in our facilities. All studies involving animals were approved by the HMS Standing Committee on Animals (protocol number: 03524) and the Boston Children’s Hospital (protocol numbers 2878, 3396). All experiments were conducted in accordance with the animal protocols.
Plasmids and cloning
Supplementary Table 7 has information on the specifics of the CRISPR/Cas9 plasmids used in this study. Supplementary Table 8 shows the sequences of the gRNAs and the Cas9 plasmids used together with the gRNA vectors. Altogether we tested 11 different gRNAs with SpCas9 (Extended Data Fig. 1a) that targeted the Tmc1Bth allele and differed in their length and distance between the mutation and PAM site. For gRNAs 1.1–1.4 and 2.1–2.4, we took advantage of a PAM site adjacent to the mutation. Our gRNA 1.1 is identical to the Tmc1-mut3 gRNA in the study of Gao et al16. In the case of gRNAs 3.1–3.3 we used an AAG PAM site created by the mutation in order to specifically recognize the mutant allele, as it has been shown that SpCas9 can also cleave at NAG PAM sites with somewhat lower efficiency3. We also used several truncated gRNAs because previous studies reported enhanced specificity7. We synthesized one gRNA specific for the Tmc1WT allele as a control. We used gRNA 1.1 (Extended Data Fig. 1a) in combination with eSpCas9(1.1)10, HypaCas99 or SpCas9-HF18 (Fig. 1a). We did not chose gRNA 2.4 in these experiments, as it has been shown that truncated gRNAs substantially decrease on-target activity of high fidelity Cas9 enzymes8. pBG201 (AAV-CMV-NLS(SV40)-SaCas9 (E782K/N968K/R1015H)-NLS(nucleoplasmin)-3xHA-bGHpA0-U6-BsaI-sgRNA) was created by synthesizing a gene fragment of the SaCas9-KKH and cloning into the pX60125 backbone using FseI (NEB) and CsiI (Thermo Scientific). Whole plasmid sequencing (MGH DNA Core, Cambridge, MA, USA) was used to verify the sequence of pBG201 (Supplementary Dataset 4). To clone gRNAs into pX458, MLM3636 and pBG201 we used Fast Digest BpiI (Thermo Scientific), BsmbI (NEB), and BsaI, respectively. We used 3 different gRNAs (4.1, 4.2 and 4.3) with SaCas9-KKH (Fig. 1a). The correct gRNA inserts were sequenced using a U6 sequencing primer: 5’-GACTATCATATGCTTACCGT-3’.
Cell culture, transfection and sorting
Mouse primary dermal fibroblasts were established from neonatal C57BL/6 Tmc1WT/WT and Tmc1Bth/WT animals. Briefly, after euthanasia, a small amount of skin was dissected into small pieces and washed with PBS. Next, cells were treated at 37 °C with 1 mg/ml collagenase I (Worthington) for 30 minutes followed by 0.05%-trypsin-EDTA treatment for 15 minutes. Cells were cultured in 10% fetal bovine serum containing DMEM (Gibco) supplemented with 1x penicillin/streptomycin (Gibco). Cell lines were validated by Sanger sequencing (see below). Mycoplasma screening (MycoAlert, Lonza, Basel) was performed regularly and before transfection experiments. For transfection of fibroblasts, we used Nucleofection (Lonza) (CZ-167 program, P2 Primary Cell 4D-Nucleofector X Kit). Every transfection reaction was performed in duplicate and experiments were performed on at least two separate occasions. Four days after transfection of pX458 plasmids, cells were sorted based on GFP fluorescence using a FACS Aria Cell Sorter (BD), and genomic DNA was isolated and analyzed by Sanger sequencing and targeted deep sequencing (see below). In the case of high fidelity SpCas9s (eSpCas9(1.1), HypaCas9, SpCas9-HF1) and SaCas9-KKH transfections, cells were not sorted, but genomic DNA was isolated from all cells 4 days after transfection for deep-sequencing analysis.
Mouse genomic DNA isolation and PCR
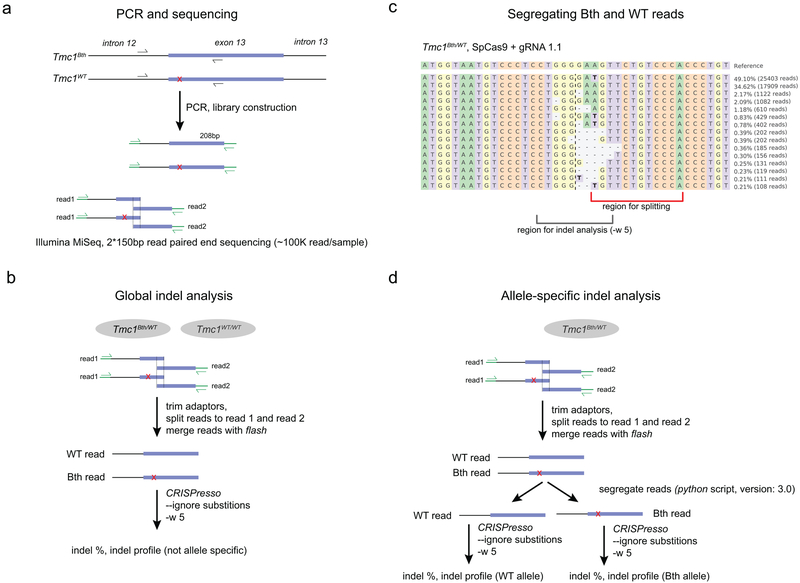
Genomic DNA was isolated from fibroblasts 4 days after transfection using a Qiagen Blood and Tissue Kit (Qiagen). In the case of cochlear tissue, organs were harvested at different ages (Fig. 2c) and dissociated with 1x collagenase I/5x dispase (Gibco) for 40 minutes in Cell Dissociation Buffer (Gibco), as described previously26. Organs were further dissociated by passing through a 20G needle 10 times. DNA and RNA from cochlear tissue were isolated using a Qiagen AllPrep DNA/RNA micro kit. To amplify the Tmc1 gene, we used the following primers: 5’-TAAAGGGACCGCTCTGAAAA-3’ (forward) and 5’-CCATCAAGGCGAGAATGAAT-3’ (reverse). To amplify Tmc1 message, we used 5’-CCATCAAGGCGAGAATGAAT-3’ (forward) and 5’-ACCTCATCTTTTGGGCTGTG-3’ (reverse). PCR products were visualized on a 1% agarose gel using GelRed (Thermo Fisher) and purified on a column (PCR Purification Kit, Qiagen). For Sanger sequencing, we used 200–500 ng genomic DNA, and for targeted deep sequencing we used 500–1400 ng genomic DNA. Sequencing was performed at the MGH DNA Core (Sanger-sequencing and CRISPR-sequencing service). Paired-end reads (150 bp) were generated on an Illumina MiSeq platform with a 100K read depth per sample (Extended Data Fig. 9).
Sanger sequencing and TIDE analysis
Sanger sequencing was performed in the MGH DNA Core. Sequence traces were analyzed by deconvolution (TIDE, Tracking Indels by Decomposition, Desktop genetics, UK). Aberrant sequences were quantified downstream of the CRISPR cut site. Analysis was performed on forward vs. reverse traces and efficiency was averaged.
Targeted deep sequencing data analysis
CRISPR-induced indels were analyzed by CRISPResso using two separate methods (Extended Data Fig. 9, see below). During quantification, we ignored substitutions (only insertions and deletions were quantified) and indels outside of a 10 bp window of the CRISPR cut site were disregarded.
Global CRISPResso indel analysis
To analyze CRISPR action on both Tmc1Bth and Tmc1WT alleles, we subjected the fastq files to CRISPResso analysis without segregating them to mutant and WT reads (Extended Data Fig. 9b). Briefly, reads were split to read 1 and read 2 then merged using flash v1.2.11 (parameters: min overlap: 4, max overlap: 126, max mismatch density: 0.250000, allow “outie” pairs: true, cap mismatch quals: false, combiner threads: 8, input format: fastq, phred_offset=33, output format: fastq, phred_offset=33). Next, CRISPResso was run with the following parameters: CRISPResso -r1 <fastq_file> --split_paired_end -w 5 -c <protein_coding_sequence> --ignore_substitutions -a <amplicon_sequence> -g <gRNA_sequence>.
Allele-specific CRISPResso indel analysis
To analyze CRISPR action on Tmc1Bth and Tmc1WT alleles separately, we first split fastq files to read 1 and read 2, then we merged them using flash v1.2.11, as described above. The reads from heterozygous samples were segregated based on the presence of wild-type sequence (“TGGGACAGAACA” and its reverse complement “TGTTCTGTCCCA”) and mutant sequence (“TGGGACAGAACT” and its reverse complement “AGTTCTGTCCCA”; mutation site is underlined) using a custom Python script (version 3.4.2) used previously27. Reads were segregated based on a sequence downstream of the projected CRISPR cut site so that indels have minor influence on the segregation (Extended Data Fig. 9c). After segregation, CRISPResso was run separately on Tmc1Bth and Tmc1WT reads with the following paramters: -r1 <fastq_file> -w 5 -c <protein_coding_sequence> --ignore_substitutions -a <amplicon_sequence> -g <gRNA_sequence>.
For mRNA analysis, we first merged the reads with flash as described above. CRISPResso analysis was performed similarly to global indel analysis (see above). To quantify intact, non-edited reads, we used the following sequences: 5’-CATCCCCAGGAGGG-3’ and 5’- CCCTCCTGGGGATG-3’ for WT reads, and 5’-CTTCCCCAGGAGGG-3’ and 5’- CCCTCCTGGGGAAG-3’ for mutant reads.
Off-target analysis
To detect genome-wide Cas9 nuclease activity, a GUIDE-Seq assay was performed in fibroblasts3. Briefly, 2 μg of Cas9–2A-GFP-U6-gRNA-2.4 or 2 μg of pAAV-CMV-SaCas9-KKH-U6-gRNA-4.2 along with 50 pmol annealed GUIDE-Seq oligo (forward: /5Phos/G*T*TTAATTGAGTTGTCATATGTTAATAACGGT*A*T, reverse: /5Phos/A*T*ACCGTTATTAACATATGACAACTCAATTAA*A*C, stars indicate thioate bonds) were transfected into Tmc1Bth/WT fibroblasts using electroporation (see above). Four days after transfection, genomic DNA was isolated with a Qiagen DNA Blood and Tissue kit, and a library was constructed as described previously3. Sequencing was performed on an Illumina MiSeq machine. As a control, GUIDE-Seq oligo was transfected without CRISPR/Cas9 plasmids. GUIDE-Seq data were analyzed with the guideseq pipeline v1.1b4 (https://github.com/aryeelab/guideseq) using mm10 as the reference mouse genome.
AAV vector production
AAV vectors were produced by the Boston Children’s Hospital Viral Core (Boston, MA, USA). Plasmid containing SaCas9-KKH and gRNA 4.2 was sequenced before packaging (MGH DNA Core, complete plasmid sequencing, Supplementary Dataset 4) into AAV2/Anc8028. Vector titer was 4.8×10¹⁴ gc/ml as determined by qPCR specific for the inverted terminal repeat of the virus.
Inner ear injections
Inner ears of Tmc1Bth/WT or Tmc1WT//WT mouse pups were injected at P1 with 1 μl of Anc80-AAV-CMV-SaCas9-KKH-U6-gRNA-4.2 virus at a rate of 60 nl/min. Pups were anesthetized using hypothermia exposure in ice water for 2–3 min. Upon anesthesia, a post-auricular incision was made to expose the otic bulla and visualize the cochlea. Injections were made manually with a glass micropipette. After injection, a suture was used to close the skin cut. Then, the injected mice were placed on a 42°C heating pad for recovery. Pups were returned to the mother after they fully recovered within ~10 min. Standard post-operative care was applied after surgery. Sample sizes for in vivo studies were determined on a continuing basis to optimize the sample size and decrease the variance. At P5 to P7, organs of Corti were excised from injected ears. Organ of Corti tissues were incubated at 37°C, 5% CO2 for 8–10 days, the tectorial membrane was removed right before electrophysiology recording.
Hair cell electrophysiology
Mechanotransduction currents were recorded from cochlear IHCs and OHCs at P14–16. Organ of Corti tissues were bathed in external solution containing (in mM): 140 NaCl, 5.8 KCl, 0.7 NaH2PO4, 10 HEPES, 1.3 CaCl2, 0.9 MgCl2, 5.6 glucose, and vitamins and essential amino acids (Thermo Fisher Scientific, Waltham, MA), adjusted to pH 7.4 with NaOH, ~310 mmol/kg. Recording electrodes were pulled from R6 capillary glass (King Precision Glass). The intracellular solution contained (in mM): 140 CsCl, 5 EGTA, 5 HEPES, 2.5 Na2‐ATP, 0.1 CaCl2, and 3.5 MgCl2, and was adjusted to pH 7.4 with CsOH, ~285 mmol/kg. Mechanotransduction currents were recorded under whole‐cell voltage‐clamp configuration using an Axopatch 200B (Molecular Devices) amplifier. Cells were held at –80 mV for all electrophysiology recordings. Data were low‐pass filtered at 5 kHz (Bessel filter), then sampled at 20 kHz with a 16‐bit acquisition board (Digidata 1440A). Data were corrected for a −4 mV liquid junction potential in standard extracellular solutions. Cochlea IHC and OHC bundles were deflected using stiff glass probes mounted on a PICMA chip piezo actuator (Physik Instruments) driven by an LPZT amplifier (Physik Instruments) and filtered with an 8‐pole Bessel filter at 40 kHz to eliminate residual pipette resonance. Fire‐polished stimulus pipettes with 3‐5 μm tip diameter were designed to fit into the concave aspect of hair cell bundle as previously described (Stauffer and Holt, 2007). Hair bundle deflections were monitored using a C2400 CCD camera (Hamamatsu, Japan).
Hearing tests
ABR and DPOAE measurements were recorded using the EPL Acoustic system (Massachusetts Eye and Ear, Boston). Stimuli were generated with 24-bit digital I–O cards (National Instruments PXI-4461) in a PXI-1042Q chassis, amplified by a SA-1 speaker driver (Tucker–Davis Technologies, Inc.), and delivered from two electrostatic drivers (CUI CDMG15008–03A) in our custom acoustic system. An electret microphone (Knowles FG-23329-P07) at the end of a small probe tube was used to monitor ear-canal sound pressure. ABRs and DPOAEs were recorded from mice during the same session. Mice were anesthetized with intraperitoneal injection of xylazine (5–10 mg/kg) and ketamine (60 – 100 mg/kg) and the base of the pinna was trimmed away to expose the ear canal. Three subcutaneous needle electrodes were inserted into the skin, including a) dorsally between the two ears (reference electrode); b) behind the left pinna (recording electrode); and c) dorsally at the rump of the animal (ground electrode). Additional aliquots of ketamine (60 – 100 mg/kg i.p.) were given throughout the session to maintain anesthesia if needed. DPOAEs were recorded first. F1 and f2 primary tones (f2/f1 = 1.2) were presented with f2 varied between 5.6 and 32.0 kHz in half-octave steps and L1–L2 = 10 dB SPL. At each f2, L2 was varied between 10 and 80 dB in 10dB increments. DPOAE threshold was defined from the average spectra as the L2-level eliciting a DPOAE of magnitude 5 dB above the noise floor. The mean noise floor level was under 0 dB across all frequencies. ABR recordings were then recorded, with stimuli of broadband “click” tones as well as the pure tones between 5.6 and 32.0 kHz in half-octave steps, all presented as 5-millisec tone pips. The responses were amplified (10,000 times), filtered (0.1–3 kHz), and averaged with an analog-to-digital board in a PC based data-acquisition system (EPL, Cochlear function test suite, MEE, Boston). Across various trials, the sound level was raised in 5 to 10 dB steps from 0 to 110 dB sound pressure level (decibels SPL). At each level, 512 responses were averaged (with stimulus polarity alternated) after “artifact rejection”. Threshold was determined by visual inspection of the appearance of Peak 1 relative to background noise. Data were analyzed and plotted using Origin-2015 (OriginLab Corporation, MA). Thresholds averages ± standard deviations are presented unless otherwise stated. The majority of these experiments were not performed under blind conditions.
Confocal microscopy
The temporal bones of 24-week-old adult mice were harvested, cleaned, and placed in 4% PFA for 1 hour, followed by decalcification for 24 to 36 h with 120 mM EDTA (pH = 7.4). The sensory epithelium was then dissected and remained in PBS until staining. Tissues were permeabilized with 0.01% Triton X-100 for one hour, blocked with 2.5% NDS and 2.5 % BSA in 0.01% Triton X-100 for one hour, and then incubated with anti-MYO7A primary antibody (Proteus Biosciences) overnight (1:500 dilution). Tissues were then washed and counterstained with phalloidin for 2–3 hours. Images were acquired on a Zeiss LSM 800 laser confocal microscope. Full cochlear maps were reconstructed in Adobe Photoshop and tonotopically mapped using an ImageJ plugin.
Scanning electron microscopy
The temporal bones of 24-week-old adult mice were harvested, and cleaned temporal bones were placed in 2.5% glutaraldehyde in 0.1 M cacodylate buffer (EMS) supplemented with 2 mM CaCl2 for 45 minutes. Whole-mount tissues were dissected in distilled water and then dehydrated over the course of 4 hours to pure ethanol. Tissues were critical-point dried (Autosamdri-815, series A, Tousimis) and mounted on carbon tape attached to SEM specimen stubs. The mounted tissues were coated with 4 nm of platinum (Leica EM ACE600) and then imaged at 5 kV with a scanning electron microscope (Hitachi S-4700 FESEM).
ClinVar database analysis
The ClinVar database from April 25, 2019 was downloaded from ftp://ftp.ncbi.nlm.nih.gov/pub/clinvar/vcf_GRCh38/archive_2.0/2019/clinvar_20190325.vcf.gz. The database was filtered for ‘dominant’ diseases, resulting in 17,783 entries. The possibility of generating a PAM site from single nucleotide mutations was analyzed for the SaCas9 (GRRT) and SaCas9-KKH (RRT) recognition motifs. The GRCh38 human reference genome was queried for 7-nt or 5-nt sequences surrounding the site of interest, i.e., 3 (GRRT) or 2 (RRT) nucleotides on either side of the mutation. These sequences were analyzed with a sliding window of length 4 (GRRT) or 3 (RRT) nucleotides. Entries that had a putative PAM site in both the ‘variant’ nucleotide string and the ‘reference’ (i.e. wild-type) string were excluded from further analysis. The same procedure was used for the reverse complement strand. The resulting databases (all dominant entries, dominant entries with PAM site formation for SaCas9, and dominant entries with PAM site formation for SaCas9-KKH recognition) are uploaded as Supplementary Tables 3-5. We also analyzed all ClinVar entries without filtering from dominant diseases. This analysis was done, as several dominant variants are not annotated as ‘dominant’ in the ClinVar database. This dataset is presented as Supplementary Table 9 (variants targetable with SaCas9-WT) and Supplementary Dataset 10 (variants targetable with SaCas9-KKH).
TMC1 gene inactivation in human haploid cells
A human cell line carrying the equivalent of the Beethoven mutation in the human TMC1 gene (ATG to AAG mutation, encoding the M418K amino acid substitution) was engineered from the HAP1 parental cell line derived from the KBM-7 haploid cells (Horizon Genomics GmbH, Vienna, Austria)29. Briefly, a T to A point mutation was introduced in the exon 16 of the TMC1 gene (ENSG00000165091; genomic location: chr9: 72,791,914) to generate the TCCCTCCTAGGGAAGTTC sequence. For insertion of the mutation by gene editing, the HAP1 cell line was modified with the CRISPR/Cas9 nuclease using two guide RNA sequences (5’-CATCGCTTTGAAATGGCTAC-3’ and 5’-AACCATGTTCATCTACAAGG-3’) and a 1 kb donor template encompassing TMC1 exon 6 and which contained the T to A Beethoven mutation. The genetic identity of the cells was verified by Sanger sequencing of a PCR amplicon.
The parental and HAP1 cell lines were cultured as monolayer at 37°C in a humidified atmosphere with 5% CO2, using IMDM medium plus GlutaMAX (Gibco) supplemented with 10% FBS, 100 U/ml penicilin and 100 μg/ml streptomycin. Cells were passaged every 2–3 days when reaching 70–75% confluency. For transfection, the cells were grown in 6-well plates at a 70% confluency. One day later, cells were transfected with 2.5 μg pDNA using Lipofectamine 3000 (ThermoFisher), following manufacturer’s instructions. Two days after transfection, the cells were collected by trypsinization and the pellet was stored at −20°C. Total genomic DNA was extracted from the cells with the NucleoSpin® Tissue kit (Macherey-Nagel AG, Switzerland). A PCR amplicon was amplified for next-generation sequencing, using the Phusion High-Fidelity DNA Polymerase (ThermoFisher). For TMC1DFNA36 cells we used the primers 5’-AGCCTAGCTCAGAATCTTCCA-3’ and 5’-AAAATGCGTCCCAGTAGCCA-3’. For TMCWT cells we used the 5’-AAAATGCGTCCAAGTAGCCA-3’ due to a point mutation in the primer binding region. The PCR protocol was based on manufacturer’s instruction, with 35 cycles (5 s at 98°C; 20 s at 59°C; 15 s at 72°C). The PCR product was visualized on a 2% agarose gel and purified with the PCR clean-up and gel extraction kit (Macherey-Nagel AG, Switzerland). Next-generation sequencing was performed by the Massachusetts General Hospital DNA Core facility.
To verify transfection efficacy in each sample, we quantified by TaqMan real-time PCR the number of plasmid copies of the sequence contained in the AAV inverted terminal repeats using the following primers: forward: 5’-GGA ACC CCT AGT GAT GGA GTT-3’; reverse: 5’-CGG CCT CAG TGA GCG A-3’; probe: 5’-FAM-CAC TCC CTC TCT GCG CGC TCG-BHQ1–3’. The amount of cellular gDNA was quantified using a set of primers specific for the human albumin gene: forward: 5’-TGA AAC ATA CGT TCC CAA AGA GTT T-3’; reverse: 5’-CTC TCC TTC TCA GAA AGT GTG CAT AT-3’; probe: 5’-FAM-TGC TGA AAC ATT CAC CTT CCA TGC AGA-BHQ1–3’. Absolute number of copies were determined according to standards and used to calculate the number of plasmid copies per cell.
Statistical analysis
We used GraphPad Prism 7.0 for Mac OS and OriginPro (2015) for statistical analysis. To compare means, we used an unpaired two tailed t-test (after Shapiro-Wilk normality testing); to compare multiple groups, we used ANOVA followed by Tukey’s post-hoc test (to compare every mean to every other mean) or Dunnett’s test (to compare every mean to a control group mean). p values <0.05 were accepted as significant.
Extended Data
Extended Data Fig. 1:
Targeting Tmc1Bth with SpCas9. (a) gRNA design for SpCas9. Mutation site is highlighted in red. PAM sites are marked by green nucleotides. Mismatching nucleotides are shown in blue. The numbers or letters (e.g. 1.1) next to the PAM site represent gRNAs IDs. Our gRNA 1.1 is identical to the Tmc1-mut3 gRNA in the study of Gao et al16. Plasmids encoding SpCas9-2A-GFP, along with the different gRNAs, were transfected into fibroblasts. Four days after transfection, GFP-positive cells were sorted by FACS (b) Sanger sequencing traces from Tmc1Bth/WT or Tmc1WT/WT mouse fibroblasts transfected with SpCas9-2A-GFP with or without gRNA 1.1. GFP expressing cells were sorted by FACS 4 days after transfection. The mutation site is marked by red arrow. Additional peaks appearing downstream (marked by black arrowheads) of the mutation site demonstrate sequence heterogeneity and thus, indel formation. Similar results were obtained by all gRNAs from two technical replicates (forward and reverse sequencing). Genome editing is apparent both in Tmc1Bth/WT or Tmc1WT/WT cells with SpCas9 + gRNA 1.1. (c) Sanger sequencing data was analyzed by TIDE. The control sample (SpCas9-2A-GFP only, black) and the genome edited sample (SpCas9-2A-GFP + gRNA 1.1, green) are overlaid. Downstream of the expected cut site (blue dashed line) the percentage of aberrant sequences was quantified in the region for decomposition. (d) Indel percentages (mean ± standard deviation) in Tmc1Bth/WT or Tmc1WT/WT cells based on TIDE analysis. Cells were transfected in duplicates and two independent sequencing reactions (forward and reverse) were performed. No indel formation was observed in the case of 3.1, 3.2 and 3.3 gRNAs. gRNA 1.4 showed minimal, but specific genome editing on the Tmc1Bth/WT cells. All the other gRNAs mediated efficient indel formation both in Tmc1Bth/WT or Tmc1WT/WT cells. (e) Targeted deep sequencing on control (SpCas9-2A-GFP only) cells, WT gRNA and the 3 most specific gRNAs (1.1, 2.1 and 2.4) in Tmc1Bth/WT (top) Tmc1WT/WT (bottom) cells. Indels were quantified after segregating Tmc1Bth and Tmc1WT reads by CRISPResso (only insertions and deletions were quantified, substitutions were ignored). None of the gRNAs are specific to the Tmc1Bth allele, and mediate efficient indel formation on the Tmc1WT allele as well (light blue). Sequencing was performed one time from pooled cells, transfected in triplicates. Numbers in pie charts represent the percentage of reads. Specificity was defined as the indel percentage towards the targeted allele among total indels. The gRNA with the highest selectivity towards the Tmc1Bth allele was gRNA 2.4. (f) The most abundant reads in the SpCas9 + gRNA 2.4 treated cells, shown separately for Tmc1Bth (top) and Tmc1WT (bottom) reads. The CRISPR cut site is marked by a black dashed line. Dashes represent deleted nucleotides. Insertions are shown with nucleotides in red squares. Nucleotides in bold are substitutions, however these were not quantified as CRISPR actions. Sequences were aligned to Bth allele, thus in the bottom panel, WT reads appear as having a substitution (a T to A change). Mutation site is marked by red arrow. Indel formation is evident in both Tmc1Bth and Tmc1WT reads. (g) Indel profiles from SpCas9 + gRNA 2.4 transfected Tmc1Bth/WT fibroblasts. Tmc1Bth and Tmc1WT reads are plotted separately. Minus numbers represent deletions, plus numbers represent insertions. Sequences without indels (value=0) are omitted from the chart. The most common indel event is a single base deletion. (h) Indels causing in-frame vs. frame shift mutations (percentages are shown) in the coding sequence after SpCas9 + gRNA 2.4 transfection. (i) GUIDE-Seq analysis on SpCas9 + gRNA 2.4 transfected Tmc1Bth/WT fibroblasts. Genomic DNA was isolated from 3 biological replicates for sequencing on one occasion. Only one off-target site was identified. Numbers next to reads are read counts in the GUIDE-Seq assay.
Extended Data Fig. 2.
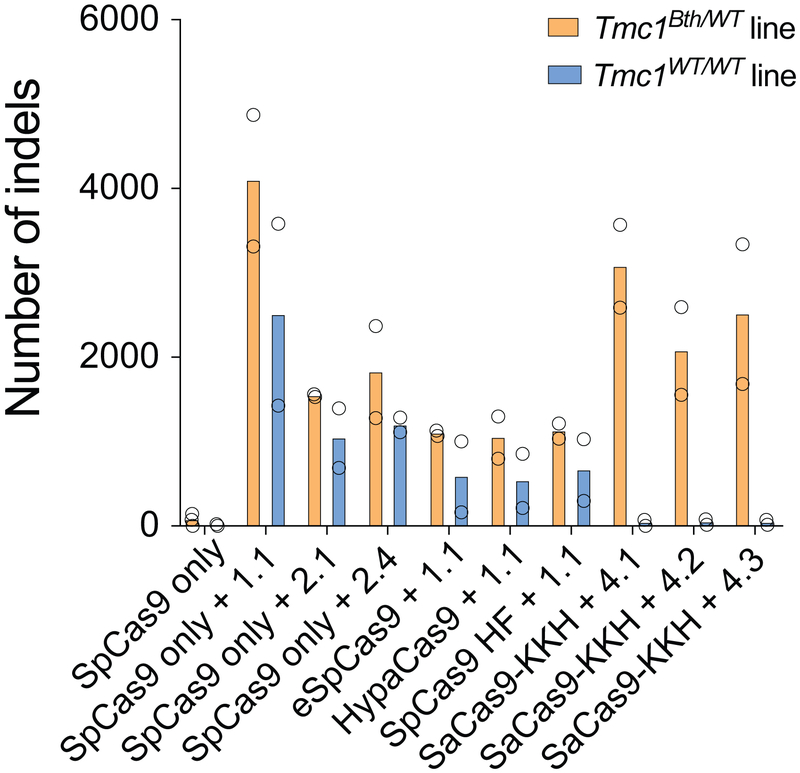
Number of indels based on targeted deep sequencing data from Tmc1Bth/WT and Tmc1WT/WT cell lines treated with different Cas9+gRNA combinations (from Fig. 1b). Note, that data points show non-normalized read counts. Cells were transfected on two different occasions (SpCas9 only and SpCas9 + gRNA 1.1 on four occasions) and genomic DNA from two independent biological samples on each transfection day were pooled for sequencing. Indels in the SaCas9-KKH treated Tmc1WT/WT lines are not different from the background (i.e. untreated samples). This method revealed high sensitivity, as the indel rates in CRISPR treated samples were 40-160-fold higher than the background indel rates observed in untreated samples.
Extended Data Fig. 3.
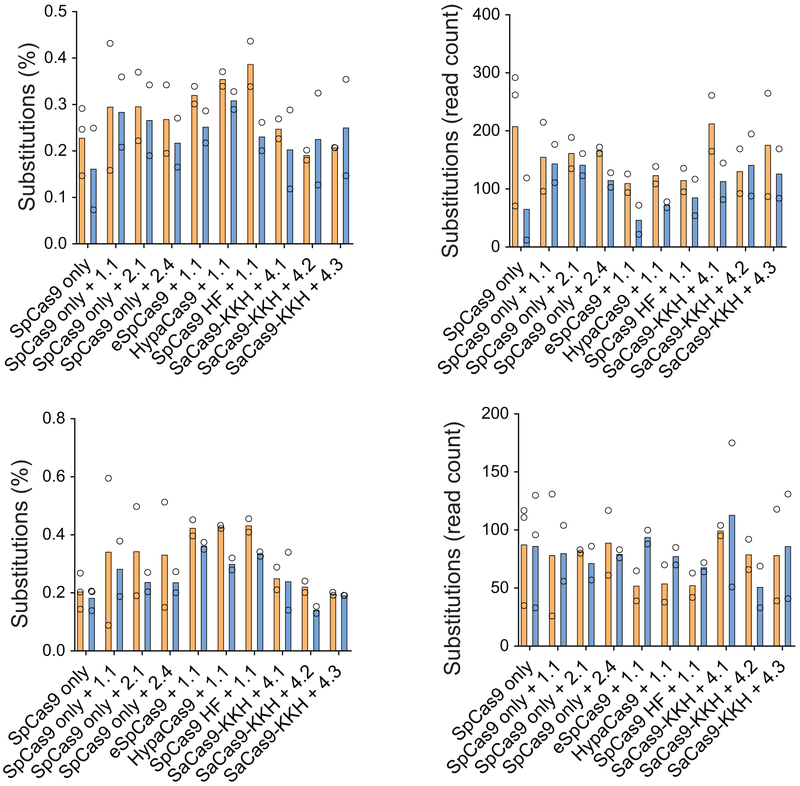
Single nucleotide substitutions after Cas9+gRNA treatment. Cells were transfected on two different occasions (SpCas9 only and SpCas9 + gRNA 1.1 on four occasions) and genomic DNA from two independent biological samples on each transfection day were pooled for sequencing. Substitutions are given as percentages (i.e. normalized to total read counts) or non-normalized values (i.e. the number of reads with substitutions). Analysis was performed on non-segregated .fastq files in Tmc1Bth/WT cells and in Tmc1WT/WT cells (top) and segregated .fastq files in Tmc1Bth/WT cells (bottom). Experimental conditions are the same as in Fig. 1b. Substitutions were not frequent (0.1-0.5% of reads) and there was no difference between untreated and treated samples in the percentage or number of reads with single nucleotide substitutions.
Extended Data Fig. 4.
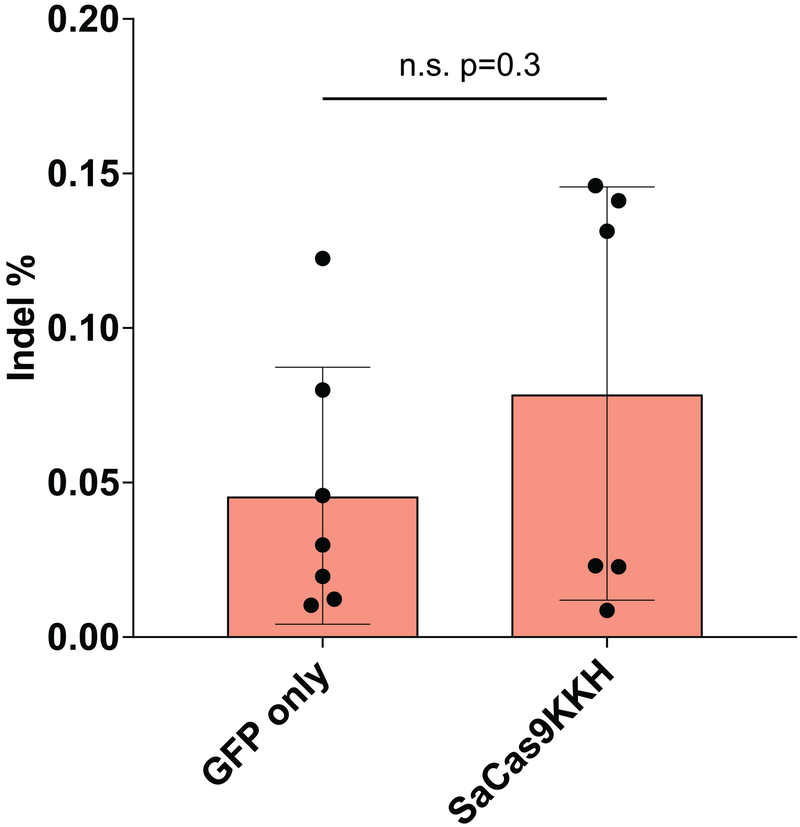
Background sequencing error vs. indel formation with SaCas9-KKH (mean ± SD). Background sequencing error rate (GFP only) and comparison indel events in SaCas9-KKH + gRNA 4.1/gRNA 4.2 and gRNA 4.3 transfected Tmc1WT/WT fibroblasts are plotted. The difference is not significant (two-tailed t-test, p=0.3).
Extended Data Fig. 5.
Effects of SaCas9-KKH+sgRNA4.2 on inner ear function in WT & Bth mice. (a) Representative sensory transduction currents recorded at P14-16 from inner hair cells (IHCs) and outer hair cells (OHC) of WT mice injected with AAV-SaCas9-KKH-sgRNA4.2 at P1-P2. (b) Mean ± SEM maximal transduction current amplitudes for P14-16 IHCs (left, n = 8) and OHCs (right, n = 6) from WT mice injected with AAV-SaCas9-KKH-sgRNA4.2 at P1-P2. (c) Families of ABR waveforms recorded at eight weeks from an uninjected Tmc1WT/WT mouse (left) and a Tmc1WT/WT mouse injected with AAV-SaCas9-KKH-gRNA-4.2 at P1 (right). Bolded traces indicate threshold. Scale bar applies to all traces. (d) Mean ± S.D. ABR thresholds plotted as a function of stimulus frequency for six Tmc1WT/WT mice (black, n = 6) and three Tmc1WT/WT mice injected with AAV-SaCas9-KKH-gRNA-4.2 (gray) at 24 weeks of age (p = 0.9). (e) Mean ± S.D. ABR thresholds plotted as a function of stimulus frequency for six Tmc1WT/WT mice (black), nine Tmc1Bth/WT, and five Tmc1Bth/WT mice injected with AAV-SaCas9-KKH-gRNA-4.2 (green) at 24 weeks of age. 8-kHz thresholds for injected: 38 ± 11 dB (n = 9) and uninjected: 64 ± 19 dB (n = 8) were significantly different (p = 0.004, unpaired two-tailed t-test). ABR thresholds at higher frequencies (22kHz) for injected (84 ± 15 dB, n = 9) and uninjected Tmc1Bth/WT mice (103 ± 5 dB, n = 8; p = 0.004, unpaired two-tailed t-test). (f) Representative confocal images of 100-μm cochlear sections harvested at 24 weeks from the 8, 16, and 32 kHz regions from three uninjected Tmc1WT/WT mice (top), and three Tmc1WT/WT mice injected with AAV-SaCas9-KKH-gRNA-4.2 (bottom). The tissue was stained for MYO7A (red) and actin (green). (g) Mean ± S.D. number of surviving IHCs (left) and OHCs (right) per 100-μm section (n = 3).
Extended Data Fig. 6.
ABR amplitude, latencies and correlation of thresholds with surviving hair cells. (a) Peak 1 amplitudes and Peak 1 latencies (b) measured from 8 kHz ABR waveforms at the 8 week time point, from examples shown in Figs. 5a & 5c, for all Tmc1Bth/WT mice injected with AAV-SaCas9-KKH-gRNA-4.2 (green traces), and an example of an uninjected Tmc1Bth/WT (red trace). (c) Mean ABR thresholds measured at 24 weeks, evoked by 8 and 16 kHz tone bursts (from Extended Data Fig. 5e) plotted as function of the mean percentage of surviving inner and outer hair cells from the 8 and 16 kHz regions (from Fig. 3h). The data were fit with a linear equation that had a slope of −2.1 dB/% and a correlation coefficient of −0.82 (red line, Pearson’s r).
Extended Data Fig. 7.
qPCR specific for the ITR region in the transfected plasmid (AAV-CMV-SaCas9-KKH-U6-gRNA) normalized to albumin gene in HAP-1DFNA36 and HAP1WT cells. Bars show mean +/− SD. Data points is from three independent biological replicates.
Extended Data Fig. 8.
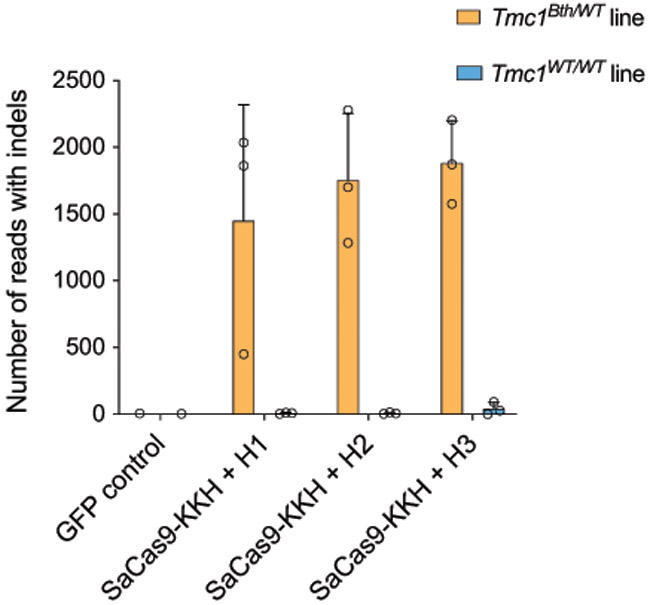
Number of indels based on targeted deep sequencing data from TMC1DFNA36 and TMC1WT cells treated with different Cas9+gRNA combinations (from Fig. 4c). Note, that data points show non-normalized read counts. Bars show mean +/− SD. Data points is from three independent biological replicates.
Extended Data Fig. 9.
Targeted deep sequencing and CRISPResso analysis. (a) PCR and sequencing of the Tmc1 gene. (b) Global indel analysis by CRISPREsso. Reads were not segregated. (c) Strategy to segregate Tmc1Bth reads and Tmc1WT reads. The region for splitting partly overlaps with indels, thus some reads cannot be assigned as mutant or WT. (d) Allele specific indel analysis by CRISPResso.
Supplementary Material
Supplementary Dataset 1. TIDE analysis of all Sanger sequencing samples from Extended Data Fig. 1. SpCas9 only (GFP) was used as a control for analysis.
Supplementary Dataset 2. CRISPResso analysis on all samples from Extended Data Fig. 1e. In the case of Tmc1Bth/WT samples, reads were segregated to Bth and WT before CRISPResso analysis.
Supplementary Dataset 3. CRISPResso analysis on all samples from Fig. 1b. In the case of Tmc1Bth/WT samples, reads were segregated to Bth and WT before CRISPResso analysis.
Supplementary Data 4. Sequencing result from pBG201 empty vector (pAAV-CMV-NLS(SV40)-SaCas9(E782K/N968K/R1015H)-NLS(nucleoplasmin)-3xHA-bGHpA0-U6-BsaI-sgRNA). Plasmid DNA was sequences by next-generation sequencing using the Plasmid Sequencing Service of the MGH DNA Core (Cambridge, MA, USA).
Supplementary Table 1. Statistical analysis for Fig. 2c (ANOVA and post-hoc Tukey’s tests)
Supplementary Table 2. Dominant deafness variants potentially targetable with SaCas9-KKH. Entries from Supplementary Data 6 were filtered for entries that are also represented in the Online Mendelian Inheritance in Men (OMIM) database and have at least one publication confirming dominant inheritance and association with deafness. Links to the OMIM Database are included.
Supplementary Table 3. ClinVar Database, selected for dominant entries
Supplementary Table 4. ClinVar Database, dominant entries targetable with SaCas9 (only single nucleotide variations). Three nucleotides upstream and downstream of variant site is indicated to indicate the formation of GRRT PAM site.
Supplementary Table 5. ClinVar Database, dominant entries targetable with SaCas9-KKH (only single nucleotide variations). Two nucleotides upstream and downstream of variant site is indicated to indicate the formation of RRT PAM site.
Supplementary Table 6. Registry file for deep sequencing data files including SRA accession numbers.
Supplementary Table 7. Specification of plasmids used in this study.
Supplementary Table 8. gRNA sequences and usage
Supplementary Table 9. ClinVar Database, all entries targetable with SaCas9 (only single nucleotide variations). Three nucleotides upstream and downstream of variant site is indicated to indicate the formation of GRRT PAM site.
Supplementary Table 10. ClinVar Database, all entries targetable with SaCas9-KKH (only single nucleotide variations). Two nucleotides upstream and downstream of variant site is indicated to indicate the formation of RRT PAM site.
Acknowledgements
We thank members of Holt/Géléoc and Corey laboratories for many helpful discussions and critical review of the manuscript. We thank the MGH DNA Core for sequencing services and the BCH Viral Core (BCH IDDRC, grant # 1U54HD090255) for vector production. We also thank Luca Pinello for assistance with CRISPResso analysis, Victor Dillard for the help with TIDE analysis and Alexander A. Sousa for technical assistance with the GUIDE-Seq analysis. This work was supported by the Jeff and Kimberly Barber Fund and NIH grants R01-DC013521 and R01-DC05439 (J.R.H.), R01-DC000304 and R01-DC016932 (D.P.C.), DC008853 (G.S.G), K99-CA218870, the Charles A. King Trust, a Banting Postdoctoral Fellowship (B.K.), the Richard Floor Biorepository Fund, the Kosciuszko Foundation (M.P.Z.) and by the Bertarelli Foundation. J.K.J. is supported by a Desmond and Ann Heathwood MGH Research Scholar award and B.G. was an Edward R. and Anne G. Lefler Center Postdoctoral Fellow.
Abbreviations:
- AAV
adeno-associated virus
- ABR
auditory brainstem recordings
- CMV
cytomegalovirus
- CRISPR
clustered regularly interspaced short palindromic repeats
- DPOAE
distorted product optoacoustic emission
- FACS
fluorescence activated cell sorting
- GFP
green fluorescent protein
- GUIDE-Seq
Genome-wide Unbiased Identification of Double strand breaks Enabled by Sequencing
- IHC
inner hair cell
- ITR
inverted terminal repeat
- NGS
next generation sequencing
- OHC
outer hair cell
- PAM
protospacer adjacent motif
- SpCas9
Streptococcus pyogenes Cas9 (WT)
- SaCas9
Staphylococcus aureus Cas9 (WT)
- SaCas9-KKH
Staphylococcus aureus Cas9 (KKH PAM variant)
- TIDE
tracking of indels by decomposition
- TMC1
transmembrane channel-like protein 1
Footnotes
Competing Interests Statement
J.R.H. holds patents on TMC1 gene therapy and is an advisor to several biotech firms focused on inner-ear therapies. J.K.J. has financial interests in Beam Therapeutics, Blink Therapeutics, Editas Medicine, Endcadia, Monitor Biotechnologies (formerly known as Beacon Genomics), Pairwise Plants, Poseida Therapeutics, and Transposagen Biopharmaceuticals. J.K.J.’s interests were reviewed and are managed by Massachusetts General Hospital and Partners HealthCare in accordance with their conflict of interest policies. The authors declare no other conflicts.
Data accessibility
Raw sequencing files have been be uploaded to NCBI’s Sequence Read Archive (SRA) (https://www.ncbi.nlm.nih.gov/sra/PRJNA541170). List of uploaded files including SRA IDs are listed in Supplementary Table 6. Detailed data analysis is available in the Supplementary Tables and Supplementary Datasets published with this manuscript. The pBG201 empty vector (pAAV-CMV-NLS(SV40)-SaCas9(E782K/N968K/R1015H)-NLS(nucleoplasmin)-3xHA-bGHpA0-U6-BsaI-sgRNA is available upon completion of a standard Material Transfer Agreement with Harvard Medical School. The HAP1DFNA36 cell line is available upon request and completion of standard Material Transfer Agreement with Ecole Polytechnique Fédérale de Lausanne. Any other raw data including ABR traces and electrophysiological recordings that support the findings of this study are available from the corresponding author.
References
- 1.Landrum MJ et al. ClinVar: Public archive of interpretations of clinically relevant variants. Nucleic Acids Res. 44, D862–D868 (2016). [DOI] [PMC free article] [PubMed] [Google Scholar]
- 2.Komor AC, Kim YB, Packer MS, Zuris JA & Liu DR Programmable editing of a target base in genomic DNA without double-stranded DNA cleavage. Nature (2016). doi: 10.1038/nature17946 [DOI] [PMC free article] [PubMed] [Google Scholar]
- 3.Tsai SQ et al. GUIDE-seq enables genome-wide profiling of off-target cleavage by CRISPR-Cas nucleases. Nat. Biotechnol. 33, 187–198 (2015). [DOI] [PMC free article] [PubMed] [Google Scholar]
- 4.Ran FA et al. Genome engineering using the CRISPR-Cas9 system. Nat Protoc 8, 2281–2308 (2013). [DOI] [PMC free article] [PubMed] [Google Scholar]
- 5.Vreugde S et al. Beethoven, a mouse model for dominant, progressive hearing loss DFNA36. Nat. Genet. 30, 257–258 (2002). [DOI] [PubMed] [Google Scholar]
- 6.Pan B et al. TMC1 Forms the Pore of Mechanosensory Transduction Channels in Vertebrate Inner Ear Hair Cells. Neuron (2018). doi: 10.1016/j.neuron.2018.07.033 [DOI] [PMC free article] [PubMed] [Google Scholar]
- 7.Fu Y, Sander JD, Reyon D, Cascio VM & Joung JK Improving CRISPR-Cas nuclease specificity using truncated guide RNAs. Nat. Biotechnol. 32, 279–284 (2014). [DOI] [PMC free article] [PubMed] [Google Scholar]
- 8.Kleinstiver BP et al. High-fidelity CRISPR-Cas9 nucleases with no detectable genome-wide off-target effects. Nature 529, 490–495 (2016). [DOI] [PMC free article] [PubMed] [Google Scholar]
- 9.Chen JS et al. Enhanced proofreading governs CRISPR-Cas9 targeting accuracy. Nature 550, 407–410 (2017). [DOI] [PMC free article] [PubMed] [Google Scholar]
- 10.Slaymaker IM et al. Rationally engineered Cas9 nucleases with improved specificity. Science (80-. ). 351, 84–88 (2016). [DOI] [PMC free article] [PubMed] [Google Scholar]
- 11.Kleinstiver BP et al. Broadening the targeting range of Staphylococcus aureus CRISPR-Cas9 by modifying PAM recognition. Nat. Biotechnol. 33, 1293–1298 (2015). [DOI] [PMC free article] [PubMed] [Google Scholar]
- 12.Kleinstiver BP et al. Engineered CRISPR-Cas9 nucleases with altered PAM specificities. Nature 523, 481–485 (2015). [DOI] [PMC free article] [PubMed] [Google Scholar]
- 13.Christie KA et al. Towards personalised allele-specific CRISPR gene editing to treat autosomal dominant disorders. Sci. Rep. (2017). doi: 10.1038/s41598-017-16279-4 [DOI] [PMC free article] [PubMed] [Google Scholar]
- 14.Shin JW et al. Permanent inactivation of Huntington’s disease mutation by personalized allele-specific CRISPR/Cas9. Hum. Mol. Genet. (2016). doi: 10.1093/hmg/ddw286 [DOI] [PMC free article] [PubMed] [Google Scholar]
- 15.Zhao Y et al. A novel DFNA36 mutation in TMC1 orthologous to the Beethoven (Bth) mouse associated with autosomal dominant hearing loss in a Chinese family. PLoS One 9, (2014). [DOI] [PMC free article] [PubMed] [Google Scholar]
- 16.Gao X et al. Treatment of autosomal dominant hearing loss by in vivo delivery of genome editing agents. Nature 553, 217–221 (2018). [DOI] [PMC free article] [PubMed] [Google Scholar]
- 17.Landegger LD et al. A synthetic AAV vector enables safe and efficient gene transfer to the mammalian inner ear. Nat. Biotechnol. 35, 280–284 (2017). [DOI] [PMC free article] [PubMed] [Google Scholar]
- 18.Miller DG, Petek LM & Russell DW Adeno-associated virus vectors integrate at chromosome breakage sites. Nat. Genet. 36, 767–773 (2004). [DOI] [PubMed] [Google Scholar]
- 19.Pan B et al. TMC1 and TMC2 are components of the mechanotransduction channel in hair cells of the mammalian inner ear. Neuron 79, 504–515 (2013). [DOI] [PMC free article] [PubMed] [Google Scholar]
- 20.Kawashima Y et al. Mechanotransduction in mouse inner ear hair cells requires transmembrane channel-like genes. J. Clin. Invest. 121, 4796–4809 (2011). [DOI] [PMC free article] [PubMed] [Google Scholar]
- 21.Askew C et al. Tmc gene therapy restores auditory function in deaf mice. Sci. Transl. Med. 7, (2015). [DOI] [PMC free article] [PubMed] [Google Scholar]
- 22.Shibata SB et al. RNA Interference Prevents Autosomal-Dominant Hearing Loss. Am. J. Hum. Genet. 98, 1101–1113 (2016). [DOI] [PMC free article] [PubMed] [Google Scholar]
- 23.Yoshimura H, Shibata SB, Ranum PT, Moteki H & Smith RJH Targeted Allele Suppression Prevents Progressive Hearing Loss in the Mature Murine Model of Human TMC1 Deafness. Mol. Ther. (2019). doi: 10.1016/j.ymthe.2018.12.014 [DOI] [PMC free article] [PubMed] [Google Scholar]
- 24.Narayan DS, Wood JPM, Chidlow G & Casson RJ A review of the mechanisms of cone degeneration in retinitis pigmentosa. Acta Ophthalmologica 94, 748–754 (2016). [DOI] [PubMed] [Google Scholar]
Methods only references:
- 25.Ran FA et al. In vivo genome editing using Staphylococcus aureus Cas9. Nature 520, 186–191 (2015). [DOI] [PMC free article] [PubMed] [Google Scholar]
- 26.Scheffer DI, Shen J, Corey DP & Chen Z-Y Gene Expression by Mouse Inner Ear Hair Cells during Development. J. Neurosci. 35, 6366–80 (2015). [DOI] [PMC free article] [PubMed] [Google Scholar]
- 27.György B et al. CRISPR/Cas9 Mediated Disruption of the Swedish APP Allele as a Therapeutic Approach for Early-Onset Alzheimer’s Disease. Mol. Ther. - Nucleic Acids 11, 429–440 (2018). [DOI] [PMC free article] [PubMed] [Google Scholar]
- 28.Zinn E et al. In silico reconstruction of the viral evolutionary lineage yields a potent gene therapy vector. Cell Rep. 12, 1056–1068 (2015). [DOI] [PMC free article] [PubMed] [Google Scholar]
- 29.Kotecki M, Reddy PS & Cochran BH Isolation and characterization of a near-haploid human cell line. Exp. Cell Res. (1999). doi: 10.1006/excr.1999.4656 [DOI] [PubMed] [Google Scholar]
Associated Data
This section collects any data citations, data availability statements, or supplementary materials included in this article.
Supplementary Materials
Supplementary Dataset 1. TIDE analysis of all Sanger sequencing samples from Extended Data Fig. 1. SpCas9 only (GFP) was used as a control for analysis.
Supplementary Dataset 2. CRISPResso analysis on all samples from Extended Data Fig. 1e. In the case of Tmc1Bth/WT samples, reads were segregated to Bth and WT before CRISPResso analysis.
Supplementary Dataset 3. CRISPResso analysis on all samples from Fig. 1b. In the case of Tmc1Bth/WT samples, reads were segregated to Bth and WT before CRISPResso analysis.
Supplementary Data 4. Sequencing result from pBG201 empty vector (pAAV-CMV-NLS(SV40)-SaCas9(E782K/N968K/R1015H)-NLS(nucleoplasmin)-3xHA-bGHpA0-U6-BsaI-sgRNA). Plasmid DNA was sequences by next-generation sequencing using the Plasmid Sequencing Service of the MGH DNA Core (Cambridge, MA, USA).
Supplementary Table 1. Statistical analysis for Fig. 2c (ANOVA and post-hoc Tukey’s tests)
Supplementary Table 2. Dominant deafness variants potentially targetable with SaCas9-KKH. Entries from Supplementary Data 6 were filtered for entries that are also represented in the Online Mendelian Inheritance in Men (OMIM) database and have at least one publication confirming dominant inheritance and association with deafness. Links to the OMIM Database are included.
Supplementary Table 3. ClinVar Database, selected for dominant entries
Supplementary Table 4. ClinVar Database, dominant entries targetable with SaCas9 (only single nucleotide variations). Three nucleotides upstream and downstream of variant site is indicated to indicate the formation of GRRT PAM site.
Supplementary Table 5. ClinVar Database, dominant entries targetable with SaCas9-KKH (only single nucleotide variations). Two nucleotides upstream and downstream of variant site is indicated to indicate the formation of RRT PAM site.
Supplementary Table 6. Registry file for deep sequencing data files including SRA accession numbers.
Supplementary Table 7. Specification of plasmids used in this study.
Supplementary Table 8. gRNA sequences and usage
Supplementary Table 9. ClinVar Database, all entries targetable with SaCas9 (only single nucleotide variations). Three nucleotides upstream and downstream of variant site is indicated to indicate the formation of GRRT PAM site.
Supplementary Table 10. ClinVar Database, all entries targetable with SaCas9-KKH (only single nucleotide variations). Two nucleotides upstream and downstream of variant site is indicated to indicate the formation of RRT PAM site.


