

Abstract
ATP production through oxidative phosphorylation in the mitochondria is the most efficient way to provide energy to various energy-consuming activities of the neurons. These processes require a large amount of ATP molecules to be maintained. Of these, synaptic transmission is most energy consuming. Here we report that lactate transported through monocarboxylate transporters (MCTs) at excitatory synapses constitutively supports synaptic transmission, even under conditions in which a sufficient supply of glucose and intracellular ATP are present. We analyzed the effects of MCT inhibition on neuronal activities using whole-cell recordings in brain slices of rats in the nucleus of the solitary tract. MCT inhibitors (α-cyano-4-hydroxycinnamic acid (4-CIN), phloretin, and d-lactate) significantly decreased the amplitude of EPSCs without reducing release probability. Although 4-CIN significantly reduced currents mediated by heterologously expressed AMPA-Rs in oocytes (a novel finding in this study), the IC50 of the inhibitory effect on EPSC in brain slices was ∼3.8 times smaller than that on AMPA-R currents in oocytes. Removal of intracellular ATP significantly potentiated the inhibition of EPSC with 4-CIN in a manner that was counteracted by intracellular lactate addition. In addition, extracellular lactate rescued aglycemic suppression of EPSC, in a manner that was prevented by 4-CIN. Inhibition of MCTs also reduced NMDA-R-mediated EPSCs and, to a lesser extent, the IPSC. The reduction in EPSC amplitude by γ-d-glutamylglycine was enhanced by 4-CIN, suggesting also a decreased quantal content. We conclude that “on-site” astrocyte-neuron lactate transport to presynaptic and postsynaptic elements is necessary for the integrity of excitatory synaptic transmission.
Introduction
Neuronal activities in the CNS, such as action potential generation and synaptic transmission, require a large quantity of ATP molecules to maintain (Attwell and Laughlin, 2001; Alle et al., 2009). Although neurons themselves can take up glucose from the extracellular milieu, it is commonly acknowledged that such energy-demanding neuronal activities crucially depend on an energy supply of astrocytic origin, particularly in hypoglycemia or aglycemia and/or during intense neuronal activities (Brown and Ransom, 2007; Pellerin et al., 2007; Barros and Deitmer, 2010). Lactate has been proposed to be the primary molecule for such energy supply, not only because it can be directly converted to pyruvate to be fed into the Krebs cycle but also because it is rapidly produced from glycogen. Glycogen is rich in astrocytes but not in neurons because of the lack of glycogen synthase in the latter cells (Cataldo and Broadwell, 1986; Vilchez et al., 2007). Such energetic interaction between astrocytes and neurons through lactate transport has been termed the “astrocyte-neuron lactate shuttle,” and proposed to be an essential mechanism to fuel neurons (Pellerin et al., 2007; Bèlanger et al., 2011).
The lactate in astrocytes is transported to neurons by monocarboxylate transporters (MCTs) that are expressed in the astrocytic and neuronal membranes (Pierre and Pellerin, 2005; Pellerin et al., 2007). MCTs constitute a 14-member family of membrane proteins encoded by the SLC16 gene, of which MCT1–4 are predominant in the CNS. Recent ultrastructural analyses indicated that a subtype of MCT proteins (MCT2) is localized in the postsynaptic density in the hippocampus and cerebellum, strongly suggesting a function for these proteins in synaptic transmission (Bergersen et al., 2005; Barros and Deitmer, 2010). However, despite such morphological demonstrations suggestive of synapse-related functions of MCTs, their roles in the support of functional integrity of synaptic transmission remain only indirectly demonstrated. For example, pharmacological blockade of MCTs in aglycemic conditions inhibits synaptic activities, as measured by extracellular field potential recordings in brain slices (Izumi et al., 1997; Sakurai et al., 2002) and in vivo knockdown of MCT proteins in the hippocampus perturbs long-term memory formation (Suzuki et al., 2011). Although these lines of evidence favor a possibility that functionality of MCTs indeed affect the synaptic transmission, the cellular and synaptic mechanisms of its involvement, especially in the situation with sufficient glucose and oxygen supply, remain largely unidentified.
In this study, we addressed these issues by directly measuring neuronal membrane currents via patch-clamp recordings in the neurons in the nucleus of the solitary tract (NTS) in acute brainstem slices to analyze the effects of pharmacological blockade of MCTs and those of experimental aglycemia. We used NTS neurons because MCT-mediated lactate transport plays important pathophysiological roles in this structure (Himmi et al., 2001; Patil and Briski, 2005; Briski et al., 2009; Matsuyama et al., 2009). Our results indicate that, even in the presence of sufficient glucose supply, astrocyte-neuron lactate transport is necessary to maintain fully functional excitatory transmission.
Materials and Methods
Slice preparation.
The manipulation of the rats conformed to the Guiding Principles for the Care and Use of Animals in the Field of Physiological Sciences of the Physiological Society of Japan (1988), and the procedures were approved by the Animal Experiment Committee of The Jikei University. Transverse brainstem slices of Wistar rats (20 to 29 d old) of either sex were prepared according to methods described previously (Kato and Shigetomi, 2001; Shigetomi and Kato, 2004; Yamazaki et al., 2006). Briefly, the lower brainstem was dissected under anesthesia with isoflurane (5% in 100% O2) and secured on the cutting stage of a vibrating blade slicer (PRO 7; Dosaka EM) with the caudal end facing upward. Two to three slices (400 μm thick) containing the caudal part of the NTS were cut in ice-cold “cutting” artificial CSF (ACSF) composed of the following (in mm): 125 NaCl, 3 KCl, 0.1 CaCl2, 5 MgCl2, 1.25 NaH2PO4, 10 d-glucose, 0.4 l-ascorbic acid, and 25 NaHCO3, pH 7.4, bubbled with 95% O2 + 5% CO2; osmolarity, 290–300 mOsm kg−1). The slices were incubated in a holding chamber at 37°C for 30–45 min with a constant flow of “standard” ACSF, of which the concentrations of CaCl2 and MgCl2 were 2 and 1.3 mm, respectively. The slices were then kept at room temperature (∼25°C) in the same chamber until the recordings. Each slice was transferred to a recording chamber (RC-26GLP; Warner Instruments; ∼0.4 ml volume) and fixed with nylon grids attached to a platinum frame. The slice was submerged and continuously superfused at a rate of 1–2 ml min−1 with the standard ACSF at room temperature, unless otherwise noted. In the EPSC recordings, the standard ACSF additionally contained 100 μm picrotoxin and 1 μm strychnine to block GABAA/C and glycine receptors, respectively. To selectively record the EPSCs mediated by AMPA-Rs and NMDA-Rs (EPSCAMPA and EPSCNMDA, respectively), 20 μm MK-801 and 10 μm 6-cyano-7-nitroquinoxaline-2,3-dione (CNQX), respectively, were added to the ACSF used for EPSC recordings. For the IPSC recordings, the standard ACSF additionally contained 3 mm kynurenic acid to block non-NMDA-Rs and NMDA-Rs. The “ACSF containing low Ca2+” contained 0.5 mm CaCl2 and 2.8 mm MgCl2. The results presented in the present study are based on recordings from 187 healthy-looking NTS neurons in 187 slices from 104 rats.
Patch-clamp recordings.
The whole-cell transmembrane current and membrane potential were recorded from small (soma diameter < 15 μm) second-order NTS neurons, which were visually identified with an upright microscope (BX-50; Olympus) with IR-DIC optics. The patch-clamp electrodes were made of borosilicate glass pipettes (1B120F-4; World Precision Instruments). The composition of the internal solution was as follows (in mm): 120 gluconic acid potassium, 6 NaCl, 1 CaCl2, 2 MgCl2, 2 ATP magnesium, 0.5 GTP sodium, 5 EGTA, 12 Na2 phosphocreatine, and 10 HEPES hemisodium. The pH was adjusted to 7.3 with KOH. Gluconic acid potassium was replaced by gluconic acid cesium for recordings at a holding potential of +40 mV and by KCl for recording of IPSCs. With these solutions, the equilibrium potential for Na+ was approximately +38 mV. For recordings of miniature IPSCs, the internal solution was composed of the following (in mm): 136 CsCl, 1 CaCl2, 2 ATP magnesium, 5 EGTA, 12 Na2 phosphocreatine, and 10 HEPES hemisodium. The pH was adjusted to 7.3 with CsOH for the Cs-based internal solutions. The osmolarity was 290–300 mOsm kg−1. Except in current-clamp recordings, 5 mm lidocaine N-ethyl bromide (QX-314) was added to avoid eventual action potential generation in response to the stimulation. ATP- and phosphocreatine-free internal solutions contained 4 mm MgCl2 and 30 mm NaCl and the internal solution with 4 mm ATP contained 6 mm NaCl, 4 mm KCl, and no MgCl2; the concentrations of other ingredients remained unchanged. Internal solutions containing 5 mm lactate were made by adding sodium lactate to the internal solutions with 2 mm ATP or 0 mm ATP and phosphocreatine as described above. The tip resistance of the electrode was 4–8 MΩ. The membrane potential was held at −60 mV during the recordings, unless otherwise noted. The liquid junctional potential was not compensated. The membrane capacitance was compensated. All recordings were made at room temperature (20–25°C; n = 158) and at ∼32°C (n = 29; TC-344B; Warner Instruments). The tip of a bipolar concentric electrode was placed on the tractus solitarius (TS) and dorsomedial NTS for the recordings of eEPSCs and eIPSCs, respectively. The interpolar distance of the stimulating electrode was 100 μm. The TS and dorsomedial NTS were stimulated every 10 s, unless otherwise noted. We determined the optimum stimulation intensity for each neuron to obtain the submaximal eEPSC according to the criteria described by Yamazaki et al. (2006), and kept the intensity unchanged throughout the recording from the same neuron (0.01–3 mA). With this stimulation intensity, a stable and clear response was observed during experiments. A small and short hyperpolarizing command (−10 mV; 10–20 ms) was applied 25–100 ms before each stimulus to continuously monitor the changes in series resistance, membrane capacitance, and input resistance. The release probability was evaluated using the paired-pulse ratio (PPR), defined as the ratio of the EPSC amplitude evoked by the second stimulus (EPSC2) to that evoked by the first stimulus (EPSC1), in response to two stimuli delivered to the TS with a 100 ms interstimulus interval. The mean time to peak of the eEPSCs was 8.8 ± 0.2 ms (range, 4.8–13.3 ms; n = 71) and 4.8 ± 0.2 ms (range, 3.5–6.5 ms; n = 29) at room temperature and ∼32°C, respectively. This short latency of the evoked responses is within the range that is characteristic of monosynaptic TS-NTS transmission (Yamamoto et al., 2010). The membrane current or membrane potential was recorded with an Axopatch 200B amplifier (Molecular Devices), low-pass filtered at 2 kHz (4-polar Bessel filter implemented in Axopatch 200B), and sampled at 4 kHz with a 16-bit resolution (PowerLab, ADInstruments), together with the holding potential (or injected current) and timing pulses for stimulation and drug application. To record changes in both of the membrane potential and action potential waveforms, a depolarizing current of 23.4 ± 2.9 pA (range, 11.3–36.4 pA; n = 8 neurons) was injected throughout the recording in current-clamp mode to bring the membrane potential to a level slightly above the threshold for action potential firing. This injected current was fixed so that the firing frequency was kept at ∼2–7 Hz before drug application and remained unchanged in the course of recording from single neuron. Interspike membrane potential (resting potential under constant current injection, as described above) was measured as the peak membrane potential in the probability density function constructed from the membrane potential for 5 min. The latency for the 70% decrease in amplitude (T70) was defined as the first moment after which consecutive eEPSC amplitudes consistently became smaller than 70% of control for 1 min. Concentration–response curve fitting was made with Hill equation function implemented in Igor Pro ver. 5. IC50 was estimated according to the coefficients of the fitted function assuming that the EPSC amplitude before 4-CIN application was 100%. The recorded membrane current was analyzed off-line with Igor Pro (WaveMetrics) using procedures written by F. K. Miniature EPSC (mEPSC) and miniature IPSC (mIPSC) were recorded in the continuous presence of tetrodotoxin (TTX; 1 μm) and detected using a home-made macro “PSC Analysis Pro” running on Igor Pro ver. 5 (Shigetomi and Kato, 2004). Briefly, mEPSCs were first semi-automatically detected by template matching-based detection with a rather low threshold to detect as many “likely” events as possible, but whole trace was visualized to check for overdetection or underdetection of the events. This macro program allowed us to add or delete events according to the visual inspection of the waveforms. The “unlikely” events (judged by visual inspection by the experimenter) were carefully discarded.
Electrophysiological recordings from Xenopus oocytes.
All experiments using the frogs conformed to the guidelines of the Animal Care Committees of the National Institute for Physiological Sciences (Okazaki, Japan). Xenopus oocytes were collected from frogs anesthetized in cold water containing 0.15% tricaine and isolated (Fujiwara and Kubo, 2006; Keceli and Kubo, 2009; Ishii et al., 2010). After being treated with collagenase (2 mg ml−1, type 1; Sigma-Aldrich), oocytes at stage V were injected with cRNA solution (∼50 nl) containing the cRNAs for (1) rat GluR1, GluR2, and stargazin or (2) rat GluR1, GluR4, and stargazin and incubated for 2–3 d at 17°C in frog Ringer's solution. Channel currents were recorded under two-electrode voltage-clamp using an Oocyte Clamp Amplifier (Warner Instruments) and sampled with Digidata 1440A (Molecular Devices) driven by a pClamp 10 software (Molecular Devices). The composition of the bath solution was as follows (in mm): 96 NaCl, 2 KCl, 3 MgCl2, and 5 HEPES, pH 7.3. The pipette solution was 3 m potassium acetate with 10 mm KCl (pH 7.2; tip resistance, 0.3–1.3 MΩ). The membrane potentials were held at −5 mV and the currents induced by agonist application were measured at the steady state of the responses to 100 ms voltage steps to −30 mV (cRNA solution 1) or −60 mV (cRNA solution 2) applied every 1 s. For cRNA solution 1, lower voltage step pulses were used as the recorded current amplitudes were too large at high voltage step pulses. Concentration–response curve fitting was made with Hill equation function implemented in Igor Pro ver. 5. IC50 was estimated according to the coefficients of the fitted function assuming that the kainate-activated current in the absence or at 62.5 μm of 4-CIN was 100% and baseline level of the curve (i.e., inhibition at the infinite concentration of 4-CIN) was 0%.
Drugs and their application.
Phloretin and α-cyano-4-hydroxycinnamic acid (4-CIN) were dissolved in dimethylsulfoxide (DMSO) at 500 mm and 1 m, respectively, kept frozen at −30°C, and then dissolved in ACSF just before use to obtain the final concentration. In some experiments, 4-CIN was dissolved in ACSF at the final concentration. We did not find any essential and detectable differences between the effects of the 4-CIN solutions prepared with and without DMSO; thus, these data were pooled. To apply lactate without affecting the pH and osmolarity, lactic acid was first dissolved in 1 N NaOH so that the pH of the solution became ∼7. Then, this solution was dissolved in ACSF saturated by carbogen to obtain a pH of ∼7.4. In the external solution with no added glucose and that with 20 mm lactate, the concentration of NaCl was adjusted so that the osmolarity becomes 290–300 mOsm kg−1.
In recordings in slices, antagonists and inhibitors were bath applied. To activate AMPA-Rs expressed on the neurons being recorded, AMPA solution containing (in mm) 0.1 AMPA, 135 NaCl, 3 KCl, 1.25 NaH2PO4, 10 glucose, 10 HEPES hemisodium, 0.4 l-ascorbic acid, 2 CaCl2, and 1.3 MgCl2 (pH 7.4, adjusted with NaOH) was loaded in a patch pipette connected to a Pneumatic PicoPump (PV830; World Precision Instruments). The tip of this pipette was placed in proximity to the soma of the neuron by visual guidance. This solution was applied to neurons with a pressure pulse (6–10 psi, 15 ms) every 1 min. In electrophysiological recordings from Xenopus oocytes, kainate and 4-CIN were dissolved in bath solution and applied by quick and thorough pipetting.
Picrotoxin, strychnine hydrochloride, CNQX, (+)-MK-801 hydrogen maleate, kynurenic acid, QX-314, 4-CIN, phloretin, sodium d-lactate, l-lactic acid, EGTA, and HEPES were purchased from Sigma. TTX citrate was purchased from Alomone Labs. Other drugs were purchased from Nacalai-Tesque or Wako Pure Chemical.
Statistical analysis.
The values are expressed as mean values ± SEM. Differences in the values were examined with Mann–Whitney U tests, Wilcoxon sign tests, pairwise Scheffé comparison after Kruskal–Wallis multiple-comparison test (for normalized values), paired t tests, Student's t tests, and ANOVA followed by post hoc Turkey HSD (for values governed by normal distribution with definable variance), and Friedman test (for repeated measurements). Statistical calculations were made with SPSS 19.0 (IBM Japan). Differences with a probability (p) <0.05 were considered significant.
Results
MCT inhibition markedly decreases EPSC amplitude
First, we analyzed the effect of pharmacological blockade of MCTs on excitatory synaptic transmission in the presence of extracellular glucose (10 mm) and intracellular ATP (2 mm). Addition of 4-CIN (1 mm) to ACSF gradually decreased the eEPSC amplitude and this effect became maximal ∼5 min after application and started to recover upon cessation of 4-CIN application (Fig. 1A,B). Such suppression of eEPSCs by 4-CIN was consistently observed in all nine NTS neurons examined with the same experimental conditions. 4-CIN significantly decreased the eEPSC amplitude to 47.2 ± 3.2% of the amplitude observed before application (p < 0.001, Mann–Whitney U test; from −532.0 ± 138.7 to −280.3 ± 90.6 pA). The eEPSC amplitude partly recovered after ∼15 min of washout of 4-CIN (to 79.7 ± 3.6% of pre-4-CIN; p < 0.01, Mann–Whitney U test; n = 5). This effect of 4-CIN was concentration dependent (Fig. 1C); estimated IC50 was 343 μm. 4-CIN did not significantly affect the steady-state current amplitude in response to short hyperpolarizing (−10 mV) voltage step (normalized change, 99.0 ± 2.0% of pre-4-CIN; range, 86.4–108.1%; n = 9; p = 0.799, paired t test; estimated input resistance at the steady-state current recorded with cell capacitance compensation changed from 1439 ± 149 MΩ to 1474 ± 187 MΩ by 4-CIN).
Figure 1.

Effects of 4-CIN on excitatory transmission between the primary afferents and NTS neurons. A, Averaged eEPSC waveforms (n = 8) evoked by paired-pulse stimulation before (black) and during (red) 4-CIN (1 mm) application in the NTS. Right, Overlaid waveforms scaled to eEPSC1. B, Time course of the effect of 4-CIN on eEPSC amplitudes. Open circles show the values of eEPSC1 amplitude for each stimulation; 4-CIN was applied at the time indicated by the horizontal bar. The curve in the top is the moving average over nine consecutive eEPSC amplitudes. C, Concentration–response relation for the effect of 4-CIN on eEPSC amplitude. Estimated IC50 was 342.5 μm. Numbers in parentheses indicate the number of neurons. Filled circles and vertical bars indicate the mean values and SEM. D, Summary of the effects of 4-CIN on PPR. *p < 0.05 (paired t test). n = 9. Open circles represent the values from each neuron.
These NTS synapses show potent short-term plasticity (Yamamoto et al., 2010), which is strongly affected by changes in release probability. If the reduction in EPSC amplitude resulted from decreased release probability at the presynaptic terminal, it should be accompanied by an increase in the PPR. However, the PPR measured at the peak of the 4-CIN effect on the eEPSC amplitude was not increased, but rather slightly decreased (Fig. 1D). This decrease was primarily due to a larger reduction in eEPSC2 than in eEPSC1 (eEPSC1, 52.8 ± 3.2%; eEPSC2, 61.9 ± 3.5%; p < 0.05, Wilcoxon sign tests). This observation rules out the possibility that the potent reduction in the eEPSC amplitude by 4-CIN resulted from a reduction of release probability. (Atwood and Karunanithi, 2002; Zucker and Regehr, 2002).
The NTS neurons show relatively high frequency of action potential-independent release in the presence of TTX (Shigetomi and Kato, 2004). We examined the effect of 4-CIN on the amplitude and frequency of mEPSC in the presence of 1 μm TTX. The mEPSC amplitude was decreased in all neurons recorded by 1 mm 4-CIN (to 64.6 ± 2.1% of pre-4-CIN; range, 56.5–73.9%; n = 7; p < 0.01, Mann–Whitney U test; from −16.5 ± 2.4 to −10.6 ± 1.6 pA). In contrast, 1 mm 4-CIN markedly decreased mEPSC frequency to 10–35% in four neurons but only slightly modified (80–110%) in three neurons (as a whole, from 2.7 ± 0.4 to 1.5 ± 0.5 events/s; n = 7; p < 0.05, paired t test). Such potent reduction in mEPSC amplitude by 1 mm 4-CIN is consistent with the reduction in eEPSC amplitude as described above. The mechanism underlying the decreased mEPSC frequency was not explored in detail because it partially contains lowered sensitivity of detecting smaller events due to markedly reduced mEPSC amplitude. A possibility of reduced release probability is unlikely because it is not compatible with the reduced PPR.
4-CIN did not strongly affect membrane potential and action potential
In contrast to these synaptic effects, 4-CIN did not exert detectable effect on the holding current and action potential waveforms. 4-CIN application resulted only in an insignificant shift in the holding current in either direction (mean, −2.7 ± 1.3 pA; outward shift in two cells and inward shift in seven cells; range, −8.6 to +3.2 pA; n = 9; p = 0.071, paired t test; Fig. 2A,B). Likewise, 4-CIN did not significantly affect the interspike membrane potential recorded in current-clamp mode (interspike potential recorded with constant current injection, from −46.1 ± 1.4 mV to −44.9 ± 1.8 mV; n = 8; p = 0.577, paired t test; Fig. 2C,F) and it slightly but significantly reduced the action potential amplitude (Fig. 2C–E). Such limited effects of 4-CIN on these parameters, which represent neuronal excitability, are in marked contrast to the potent suppression of synaptic transmission described above, suggesting that the principal target of 4-CIN in NTS neurons is synaptic transmission rather than other neuronal processes.
Figure 2.
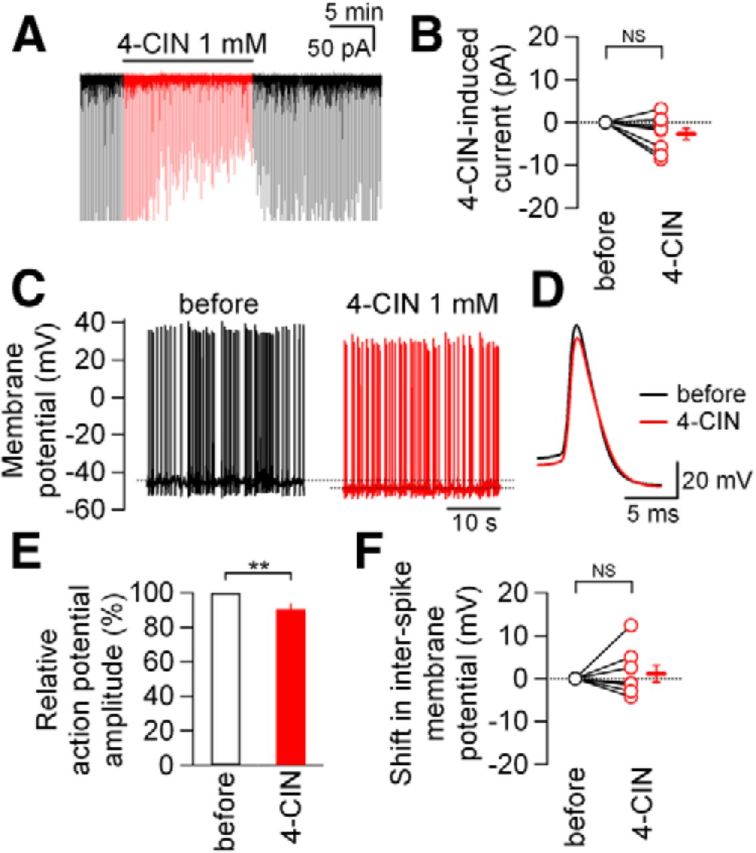
4-CIN exerted only slight effects on membrane potential and action potential amplitude. A, An original trace of the whole-cell membrane current. 4-CIN (1 mm) was applied during the horizontal bar. The current responses to pre-pulse (see Materials and Methods) and stimulation artifacts are nullified by digital sample-and-hold after the experiments. B, Effects of 4-CIN on the holding current. Open red circles, values from each neuron. Horizontal bar and vertical bar on the right, mean value and SEM (n = 9). NS, not significantly different (paired t test). C, Membrane potential traces of a neuron before (black) and during (red) 4-CIN (1 mm) application. A constant depolarizing current of 13.9 pA was injected to induce action potential firing throughout the recording. D, Traces showing action potential waveforms (n = 8) before (black) and during (red) 4-CIN application. E, Summarized results of the effects of 4-CIN on action potential amplitude. **p < 0.01 (Mann–Whitney U test); n = 8. Data are presented as the mean values ± SEM. F, Effects of 4-CIN on interspike membrane potential (open black circle, before 4-CIN application; open red circles, during 4-CIN application; horizontal and vertical bars outside, the mean value and SEM). NS, not significantly different (paired t test); n = 8. In each experiment, the membrane potential was slightly depolarized to a suprathreshold level by a constant current injection so that the neurons regularly fired at 2–7 Hz.
Synaptic suppression is a commonly observed effect of MCT inhibitors
The synaptic influence of MCT inhibition in the NTS synapse was further examined using two other compounds that are known to exert inhibitory effect on MCT (Halestrap and Price, 1999; Tekkök et al., 2005). First, the effects of d-lactate, an enantiomer of l-lactate, on eEPSCs were examined. d-lactate shows larger Kd to MCTs than l-lactate and it inhibits MCTs when given at a high concentration (Tekkök et al., 2005). In addition, mammalian neurons cannot effectively convert d-lactate into pyruvate (Flick and Konieczny, 2002), even if it is taken up by cells. d-Lactate (20 and 30 mm) significantly reduced eEPSC amplitude at 15 min after application (Fig. 3A,C). d-Lactate at 30 mm did not significantly affect the PPR (Fig. 3D), and d-lactate at 20 mm significantly reduced the PPR (Fig. 3D) in a similar manner to 4-CIN (see above). Second, phloretin (500 μm), another inhibitor of MCTs (Halestrap and Price, 1999), also significantly decreased eEPSC amplitude (Fig. 3B,C), again without significantly affecting the PPR (Fig. 3D). Shifts in the holding current by d-lactate and phloretin were within almost negligible levels and were not significant (Fig. 3E). Altogether, the consistent and potent reduction in eEPSC amplitude by these three classes of MCT inhibitors strongly suggests that the inhibition of MCTs reduces eEPSC amplitude without affecting the holding current, and this effect does not result from a decrease in release probability.
Figure 3.

Effects of d-lactate and phloretin on excitatory transmission. A1, Averaged eEPSC waveforms (n = 8) evoked by paired-pulse stimulation before (black) and during (red) d-lactate (30 mm) application in the NTS. Right, Overlaid waveforms scaled to eEPSC1. A2, Time course of the effect of d-lactate (30 mm) on eEPSC amplitudes (open circles, the amplitude of each eEPSC1; line, moving average over nine consecutive responses). B1, Averaged eEPSC waveforms (n = 8) evoked by paired-pulse stimulation before (black) and during (red) phloretin (500 μm) application in the NTS. Right, Overlaid waveforms scaled to eEPSC1. B2, Time course of the effect of phloretin on eEPSC amplitudes. C, Summary of the effects of 4-CIN, d-lactate (20 mm, n = 10; 30 mm, n = 4), and phloretin (n = 5) on eEPSC amplitude. ***p < 0.001, **p < 0.01, *p < 0.05 (Mann–Whitney U test) versus predrug; n = 9. Data are presented as the mean values ± SEM. D, Summary of the effects of d-lactate and phloretin on PPR. **p < 0.01; NS, not significantly (paired t test). Open circles represent the values from each neuron. E, Effects of d-lactate (20 mm, n = 10; 30 mm, n = 4) and phloretin (n = 5) on the holding current. Vertical axis, the difference in the holding current between before and during inhibitor application. Open circles represent the values from each neuron. Horizontal bars and vertical bars on the right side of open circles indicate mean value and SEM, respectively. Differences in the holding currents before and during inhibitor application were examined with paired t test; NS, not significantly different.
MCT inhibition decreased amplitude of AMPA-evoked current (IAMPA)
These results described above suggest that MCT inhibition decreases eEPSC mostly through affecting postsynaptic responses. To directly confirm this, we examined effects of two distinct classes of MCT inhibitors, 4-CIN and d-lactate, on the amplitudes of simultaneously recorded eEPSC and agonist-activated AMPA-R current. We applied AMPA (which was used to avoid activating glutamate transporter currents; Shigetomi and Kato, 2004) at 100 μm (IAMPA) onto neurons every 60 s while recording EPSCs evoked every 10 s (stimulation was withheld when local puffer AMPA application was made) from single neurons (Fig. 4A,B). Application of 1 mm 4-CIN reduced the IAMPA to a degree not significantly different from that for eEPSC (for IAMPA and eEPSC, 30.0 ± 7.0% of pre-4-CIN and 55.0 ± 10.2% of pre-4-CIN, respectively; n = 4; Fig. 4B–D). IAMPA and eEPSC amplitude before 4-CIN were −50.3 ± 12.4 and −373.4 ± 69.3 pA, respectively. Likewise, d-lactate (30 mm) also decreased IAMPA and eEPSC with a similar time course (IAMPA, 30.3 ± 4.3% of pre-d-lactate; eEPSC, 39.1 ± 4.7% of pre-d-lactate; n = 5; Fig. 4B,C). The extent of inhibition by d-lactate was not significantly different between IAMPA and eEPSC (Fig. 4D). IAMPA and eEPSC amplitude before d-lactate were −48.2 ± 6.8 and −263.8 ± 68.9 pA, respectively. It is therefore likely that the maintenance of postsynaptic responses depends on MCT functions.
Figure 4.

Effect of 4-CIN and d-lactate on AMPA-evoked current (IAMPA) in NTS neurons. A, An IR-DIC image showing recording and application pipettes around the neuron being recorded. P, recording pipette; puff, puffer pipette. B, Upper traces, Averaged IAMPA waveforms (n = 5) in the absence (black) and presence (orange) of 4-CIN (1 mm; left) and d-lactate (30 mm; right). AMPA (100 μm) was applied at the filled black circles for 15 ms. Lower traces, averaged eEPSC waveforms (n = 8) evoked by paired-pulse stimulation in the absence (black) and presence (red) of 4-CIN (left) and d-lactate (right). C, Representative time courses of simultaneously recorded IAMPA (orange-filled triangles) and eEPSC amplitudes (red open circles). 4-CIN (above) and d-lactate (below) were applied during the period with horizontal bars. D, Summary of the effects of 4-CIN (n = 4) and d-lactate (n = 5) on IAMPA and eEPSC amplitude. **p < 0.01, *p < 0.05 versus predrug; NS, not significantly different between groups (Mann–Whitney U test). Data are presented as the mean values ± SEM.
Direct inhibitory effect of 4-CIN on AMPA-Rs at higher concentrations
4-CIN has been used most widely to block MCTs in a number of studies (Izumi et al., 1997; Erlichman et al., 2008; Rouach et al., 2008; Parsons and Hirasawa, 2010). These inhibitory effects of 4-CIN on eEPSC amplitude shown above would therefore imply that maintenance of excitatory transmission depends on the integrity of lactate transport. Theoretically, the mechanisms that might underlie this effect would involve decreased energy supply required to maintain locally delimited ion environment and/or reduced ATP concentration that would affect phosphorylation level (Zivkovic and Buck, 2010) and/or ATP-dependent membrane trafficking of the receptors (Maekawa et al., 2009). However, it cannot be fully ruled out that such inhibition of postsynaptic AMPA-R responses involves a yet undescribed direct inhibitory effect of 4-CIN on AMPA-Rs. This is an important possibility because this drug is widely used in studies aiming to identify the role of lactate transport (Izumi et al., 1997; Erlichman et al., 2008; Rouach et al., 2008; Parsons and Hirasawa, 2010). To date and to our knowledge, there is no report showing 4-CIN directly inhibits AMPA-Rs. Indeed, Izumi et al. (1997) clearly demonstrated that 4-CIN at 1 mm did not affect the field EPSP slope in the hippocampus slice. However, because the present study is the first to use whole-cell patch-clamp recording to directly evaluate the effects of this drug on small synaptic currents in single neurons, it would be important to assess the degree and concentration at which 4-CIN affects AMPA-R currents. We estimated these using heterologously expressed AMPA-Rs in oocytes because the relation between IC50s for EPSP in slices and Ki values for AMPA-R currents in oocytes for a series of AMPA-R antagonists has been quantitatively analyzed and reported (Randle et al., 1992).
4-CIN reduced the steady AMPA-R current evoked by bath application of kainate (100 μm), a nondesensitizing AMPA-R agonist, at a high concentration (Fig. 5A1). The IC50 values of 4-CIN against the AMPA-R currents mediated by GluR1 + GluR4 and GluR1 + GluR2 subunits were 1258 ± 49 (n = 8) and 1359 ± 46 μm (n = 6), respectively (Fig. 5A2). These values are ∼3–4 times larger than that estimated in the slice preparations (343 μm; Fig. 1) for the eEPSC inhibition. This inhibition seemed competitive (Fig. 5B3). Altogether, these results clearly demonstrate that 4-CIN has direct inhibitory effect on AMPA-Rs themselves.
Figure 5.
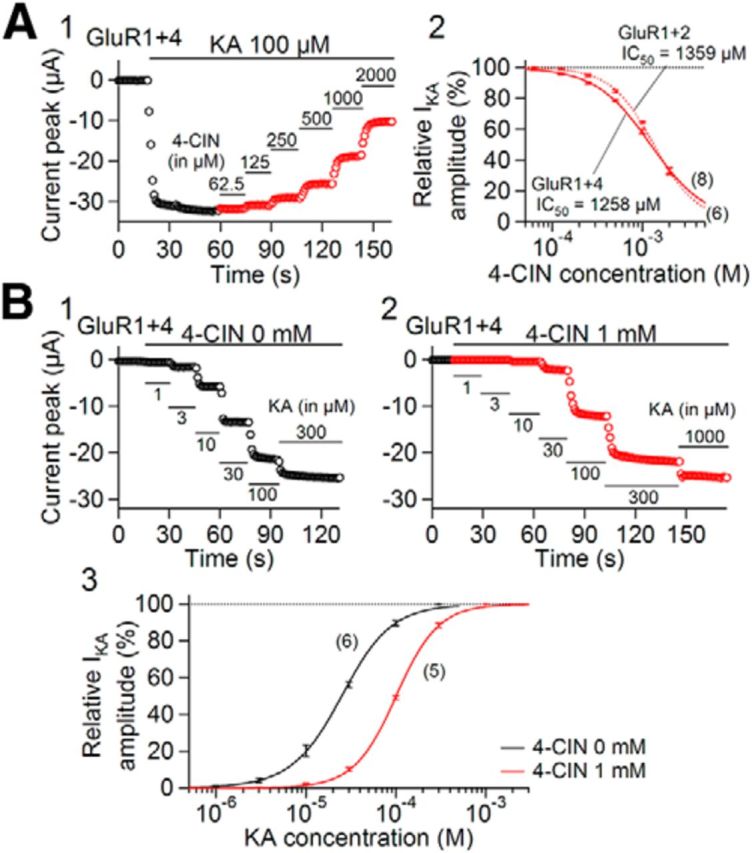
Effects of 4-CIN on heterologously expressed AMPA-R-mediated currents. A1, Effect of 4-CIN on currents mediated by AMPA-Rs with GluR1 + GluR4 subunits in Xenopus oocytes. AMPA-R currents were activated by kainate (KA; 100 μm). Kainate and 4-CIN were applied at the time indicated by the horizontal bars (the concentrations are indicated above each bar). A2, Concentration–response relation for the effect of 4-CIN on the currents mediated by AMPA-R composed of GluR1 + GluR4 (solid line) and GluR1 + GluR2 (dash line) subunits. Estimated IC50 values of 4-CIN against the AMPA-R currents mediated by GluR1 + GluR4 and GluR1 + GluR2 subunits are 1258 ± 49 and 1359 ± 46 μm, respectively. IC50 values estimated from a full date and set of each oocyte, and the mean and SEM are shown. Numbers in parentheses indicate the number of oocytes. B1, B2, Effect of increasing KA concentration on currents mediated by AMPA-Rs with GluR1 + GluR4 subunits in Xenopus oocytes. B1, In the absence of 4-CIN; B2, in the presence of 1 mm 4-CIN. B3, Concentration–response relation of kainate-induced currents mediated by GluR1 + GluR4 subunits in the absence (black) and presence (red) of 4-CIN (1 mm). Numbers in parentheses indicate the number of oocytes. Curve-fitting of the Hill equation was made assuming that the inward current activated by 300 μm (for 0 mm 4-CIN) and 1000 μm (for 1 mm 4-CIN) kainite was 100%. The mean and SEM are shown.
The important question here is to how much extent the effect of 4-CIN on eEPSC involves this direct inhibition on AMPA-Rs. Interestingly, the inhibitory effect of 4-CIN on IAMPA was more potent (though not significantly) than that on eEPSC (Fig. 4D), which was not the case for the inhibitory effect of d-lactate. This indicates that, at least for the effect on IAMPA, which should involve activation of extrasynaptic AMPA-Rs to which 4-CIN can access more easily, 4-CIN might have exerted a direct inhibitory effect on AMPA-Rs to reduce IAMPA. Randle et al. (1992) compared the IC50s for EPSPs recorded in the hippocampal CA1 slice and the Ki values for kainate (100 μm)-induced currents in oocytes expressing AMPA-Rs, both in exactly the same experimental setup as in this study, for eight different competitive non-NMDA-R antagonists, such as NBQX, CNQX, DNQX, MNQX, and BQX. They found that the IC50s for EPSP in slices were consistently ∼10 times higher than the Ki values in the oocytes regardless of the IC50 value of each different antagonist with a high coefficient of correlation (r = 0.98; Randle et al., 1992). In general, the concentration required to inhibit membrane receptors is increased in slice experiments depending on the amount of uptake of the compound into the cells of the slice and/or the drug's lipid solubility. Although we did not address the extent of this increase in this study, the smaller IC50 in slices than in oocytes as described above, together with the similar degree of inhibition of eEPSC by d-lactate to that by 4-CIN, suggest that the involvement of direct AMPA-R inhibition is, if any, small in the inhibitory effect of 4-CIN on eEPSC amplitude in the present experimental conditions.
Synaptic effect of 4-CIN depends on the intracellular supply of ATP or lactate
The novel finding above that 4-CIN could directly inhibit AMPA-R currents is extremely important in telling us that we should be careful in interpreting the effect of this nonspecific drug on neuronal excitability. One of the approaches that might strengthen the conclusion that a pharmacological manipulation of MCT indeed affects neuronal excitability is a use of other classes of MCT inhibitors. As described above, d-lactate, an inactive MCT ligand, reduced the eEPSC amplitude and IAMPA with a similar time course to that with 4-CIN. The effect on eEPSC was also reproduced by phloretin. In addition, as described below, distinct inhibitory effects on eEPSC at distinct membrane potential was similarly observed with 4-CIN and d-lactate (Fig. 11below). Such similarity of the effects shared by distinct classes of MCT inhibitors supports a notion that the reduction of eEPSC amplitude is a commonly observed consequence of MCT inhibition. An involvement of the direct inhibitory effect on AMPA-R of 4-CIN would be, if any, limited at least for these effects at the present experimental conditions in slices.
Figure 11.
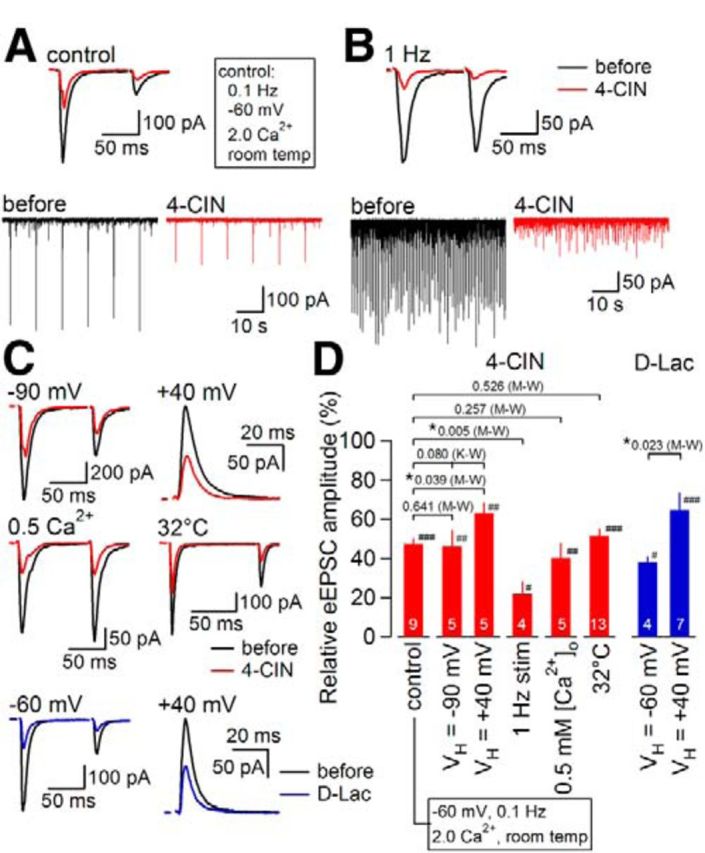
Effects of 4-CIN on eEPSC amplitude under various experimental conditions. A, Top, Averaged eEPSC waveforms (n = 8) before (black) and during (red) 4-CIN (1 mm) application under “control” conditions (i.e., 0.1 Hz stimulation, −60 mV holding potential, 2 mm Ca2+ and room temperature). Bottom, The original traces with slower sweeps. B, Top, Averaged eEPSC waveforms (n = 50) before (black) and during (red) 4-CIN (1 mm) at 1 Hz stimulation. Bottom, The original traces with slower sweeps. C, Averaged eEPSC waveforms (n = 8) before (black) and during 4-CIN (1 mm; red) and d-Lactate (30 mm; blue) under various conditions (see text for each condition). D, Summary of the effects of 4-CIN and d-Lactate on eEPSC amplitude under various conditions. Numbers in bars indicate the number of neurons. Values above brackets indicate p values given by Mann–Whitney U test (M-W; used for comparison between control and each condition) or Kruskal–Wallis multiple-comparison test (K-W; used for comparison of the inhibition at 3 different holding potentials). *p < 0.05, ###p < 0.001, ##p < 0.01, #p < 0.05 versus pre-inhibitor (Mann–Whitney U test). Data are presented as the mean values ± SEM.
Another approach that would further strengthen this conclusion is to examine whether the effect depends on the energetic state of the cell. Then, to examine whether the postsynaptic effect of 4-CIN on eEPSC amplitude depends on the ATP concentration of the neuron, we compared the effect of 4-CIN on the eEPSC amplitude under whole-cell recordings with distinct internal ATP concentration and phosphocreatine (PCr) by taking advantage of the whole-cell recording. In the recordings with an internal solution with no-added ATP and PCr, 4-CIN exerted more profound reduction in eEPSC amplitude (to 26.8 ± 3.9% of pre-4-CIN; Fig. 6A) compared with that with ATP and PCr (p = 0.007; Mann–Whitney U test between the values obtained with internal solutions with no-added ATP and PCr and the values shown in Fig. 1C at 1 mm; n = 8 and 9, respectively; Fig. 6A, right). This strong inhibition in the absence of ATP and PCr was significantly attenuated by addition of lactate (5 mm) to the internal solution to a level almost similar to that with 2 mm ATP and 12 mm PCr in the internal solution (51.5 ± 4.5% of pre-4-CIN; Fig. 6B, left, C; p = 0.013, pairwise Scheffé comparison after Kruskal–Wallis multiple-comparison test). Interestingly, the inhibitions by 4-CIN were almost similar and were not significantly different between the recordings using internal solutions with 2 mm ATP, 4 mm ATP, and 2 mm ATP + 5 mm lactate (Fig. 6B,C; p > 0.05, pairwise Scheffé comparison after Kruskal–Wallis multiple-comparison test). 4-CIN did not significantly affect PPR in any of these recording conditions except in the recording with 2 mm ATP and 12 mm PCr, as stated above (paired t test; Fig. 6D). 4-CIN did not cause significant shift in the holding current even in the internal solution with 0 mm ATP (mean, +4.0 ± 2.4 pA; outward shift in six cells and inward shift in two cells; range, −2.0 to +18.1 pA; n = 8; p = 0.133, paired t test). However, this shift was significantly larger than those with 2 mm ATP (as shown above; p < 0.05 vs 0 mm ATP, ANOVA followed by post hoc Turkey HSD) and 4 mm ATP (mean, −4.7 ± 1.1 pA; inward shift in all cells; range, −9.2 to −1.4 pA; n = 6; p < 0.01 vs 0 mm ATP, ANOVA followed by post hoc Turkey HSD). These data indicate that blockade of MCT exerts more potent inhibitory effect on excitatory synaptic transmission especially when the intracellular ATP or lactate supply is lowered. These results strongly support the idea that the synaptic effect of inhibiting lactate transport is largely dependent on the energy supply level of the cell being recorded. Although an involvement of direct inhibitory effect of 4-CIN on AMPA-Rs cannot be fully ruled out, it is likely that at least the component of the eEPSC suppression by 4-CIN that was counteracted by lactate inclusion depended on lactate transport through MCTs.
Figure 6.
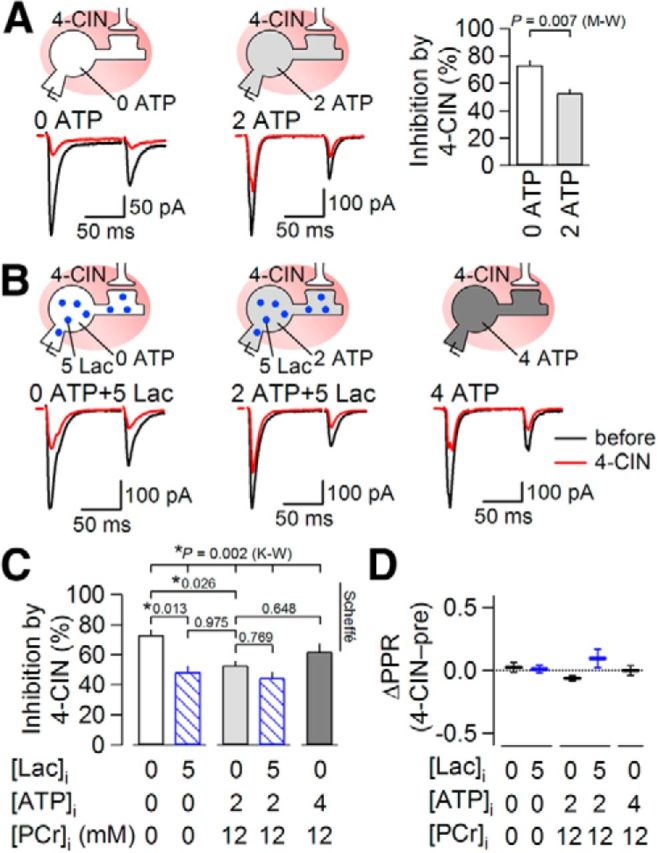
Effects of intracellular energy supply on synaptic suppression by 4-CIN. A, Averaged eEPSC waveforms (n = 8) evoked by paired-pulse stimulation before (black) and during (red) 4-CIN (1 mm) application in the absence (left) and presence (middle) of intrapipette ATP. Right graph shows summary effects of 4-CIN on eEPSC amplitude in the absence (left bar) and presence (right bar) of intrapipette ATP (0 ATP, n = 8; 2 ATP, n = 9). There was a significant difference in the inhibition by 4-CIN of eEPSC amplitude between in the absence and presence of intracellular ATP (Mann–Whitney U test; M-W). B, Averaged eEPSC waveforms (n = 8) before (black) and during (red) 4-CIN (1 mm) application in the absence (left) and presence (middle and right) of intrapipette ATP. Lactate (5 mm) was added into the patch pipette (left and middle). C, Summary of the effects of 4-CIN in the absence and presence of intracellular ATP and lactate on eEPSC amplitude (0 ATP, n = 8; 0 ATP + 5 Lac, n = 6; 2 ATP, n = 9; 2 ATP + 5 Lac, n = 6; 4 ATP, n = 8). The data for 0 ATP and 2 ATP without lactate are the same as in A and duplicated here to show the results of multiple comparisons. K-W, a result of statistical comparisons with Kruskal–Wallis multiple-comparison test, which was followed by pairwise comparison between groups with Scheffé comparison. The values show p values and *p < 0.05. Data are presented as the mean values ± SEM. D, Summary of change in PPR by 4-CIN in the absence and presence of intracellular ATP and lactate. Horizontal and vertical bars indicate the mean values and SEM.
Reduction of eEPSC by 4-CIN is not mediated by postsynaptic mitochondrial MCT inhibition
MCTs are expressed not only on the plasma membrane surface but also on mitochondrial membranes, where they transport pyruvate into mitochondria, a critical process for oxidative ATP production. Because these mitochondrial MCTs are also coded by the nuclear genome that codes plasma membrane MCTs, the strategy to genetically ablate MCT expression is not easily applicable to the identification of specific roles of MCTs at the synaptic membrane. This is the primary reason why we used pharmacological approaches to address this issue. However, it is also known that such mitochondrial MCTs are also sensitive to 4-CIN (Halestrap and Denton, 1975; McKenna et al., 2001). To determine whether the postsynaptic effect of 4-CIN described above involves an effect on mitochondrial MCTs, we examined the effect of intracellular application of 4-CIN in postsynaptic neurons, in which the intracellular milieu was perfused with an internal solution containing the same concentration of 4-CIN. We began measuring eEPSC amplitude immediately after establishing a whole-cell configuration with the patch pipette containing 1 mm 4-CIN (Fig. 7A). In the 25 min immediately following membrane rupture, there was no sign of eEPSC amplitude decline (n = 6; p = 1.000, Friedman test for repeated measurements; Fig. 7), indicating that intracellular perfusion of 1 mm 4-CIN does not affect eEPSC amplitude. However, addition of 1 mm 4-CIN to the extracellular solution immediately decreased the eEPSC amplitude (to 51.0 ± 6.1% of pre-4-CIN; n = 6; p = 0.022, Friedman test for repeated measurements; Fig. 7) in a very similar manner to the effects observed without intracellular 4-CIN perfusion (compare Figs. 1, 7). The extent to which 4-CIN reduced eEPSC amplitude did not significantly differ, despite the absence or presence of 4-CIN in the intracellular solution (p = 0.814, Mann–Whitney U test; Figs. 1C, 7D). Therefore, it is unlikely that 4-CIN decreased eEPSC amplitude through the inhibition of mitochondrial MCTs; rather, the postsynaptic effect of 4-CIN likely resulted from its suppression of plasma membrane MCTs. It should be noted however that this interpretation assumes that 4-CIN does not block MCT from the inside of the cell, unlike many other inhibitors of transporters; the exact binding site of 4-CIN on the MCT molecule remains unidentified.
Figure 7.
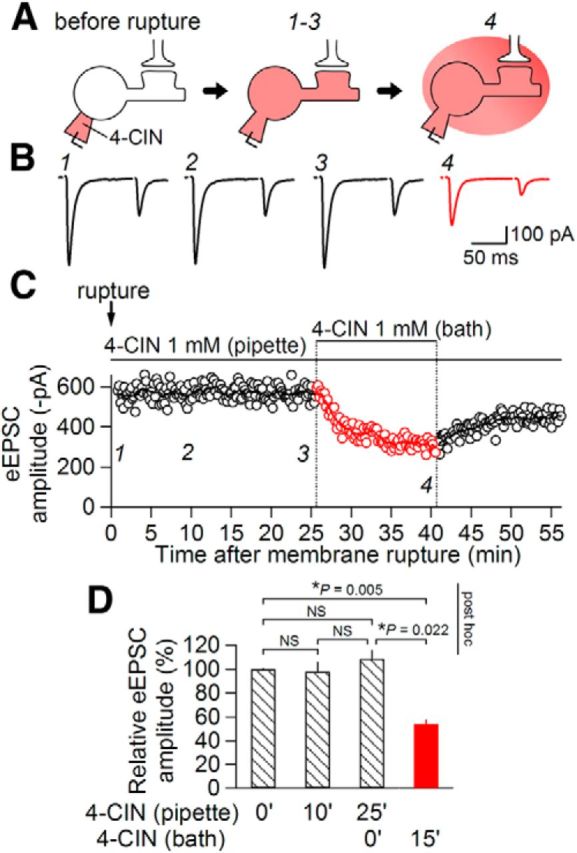
Extracellular site of action of 4-CIN. A, A schematic of the experimental protocol. B, Averaged eEPSC waveforms (n = 8) evoked by paired-pulse stimulation after membrane rupture at 0 (1), 10 (2), and 25 min (3) and during (4) bath application of 4-CIN (1 mm); 4-CIN was intracellularly applied by adding 4-CIN (1 mm) to the internal solution. C, Time course of eEPSC amplitudes (open circles, the amplitude of each eEPSC1; line, moving average over nine consecutive responses). D, Summary of the effects of pipette and bath application of 4-CIN on eEPSC amplitude. Values and “NS” indicate the results of Friedman test for repeated measurements. There was a significant difference (p = 0.004) among groups. p values above the graph show the results of post hoc pairwise comparison between pairs indicated with brackets. NS, not significantly different; n = 6. Data are presented as the mean values ± SEM.
Lactate counteracts synaptic depression by glucose deprivation in a MCT-dependent manner
The results presented above indicate that blockade of membrane MCT suppresses synaptic transmission even in the presence of extracellular glucose in a manner that was dependent on intracellular ATP level. To examine whether this mechanism becomes operational in maintaining the synaptic integrity during cerebral hypoglycemia, we next examined the relative contribution of glucose and lactate to the maintenance of excitatory transmission and analyzed the effect of 4-CIN on this contribution. This series of experiments was performed at 32°C to ensure that glucose deprivation exerted rapid and unequivocal effects on synaptic transmission (Taylor and Weber, 1993). The deprivation of glucose only slightly affected the eEPSC amplitude within the first ∼5 min (to 96.5 ± 2.1 of pre-glucose deprivation; p = 0.040; n = 6; Mann–Whitney U test vs pre-glucose deprivation; Fig. 8A,B; Table 1 shows the summary of measured amplitude values), suggesting that synaptic transmission can be maintained without an extracellular glucose supply, at least for the first 5 min. However, this early phase without any apparent changes was followed by an abrupt decrease in eEPSC amplitude, which, within 15 min, became smaller than 15% of the amplitude measured before glucose-free condition (p = 0.002; n = 6; Mann–Whitney U test vs pre-glucose deprivation; Fig. 8A,B, Table 1). This result suggests that glucose deprivation provokes two-phase responses in the excitatory transmission: an early phase, in which synaptic transmission is resistant to glucose deprivation, and a late phase, in which prominent synaptic suppression occurs. The time required to achieve a 70% decrease in eEPSC amplitude (T70) was 481.9 ± 47.3 s (Fig. 8D).
Figure 8.
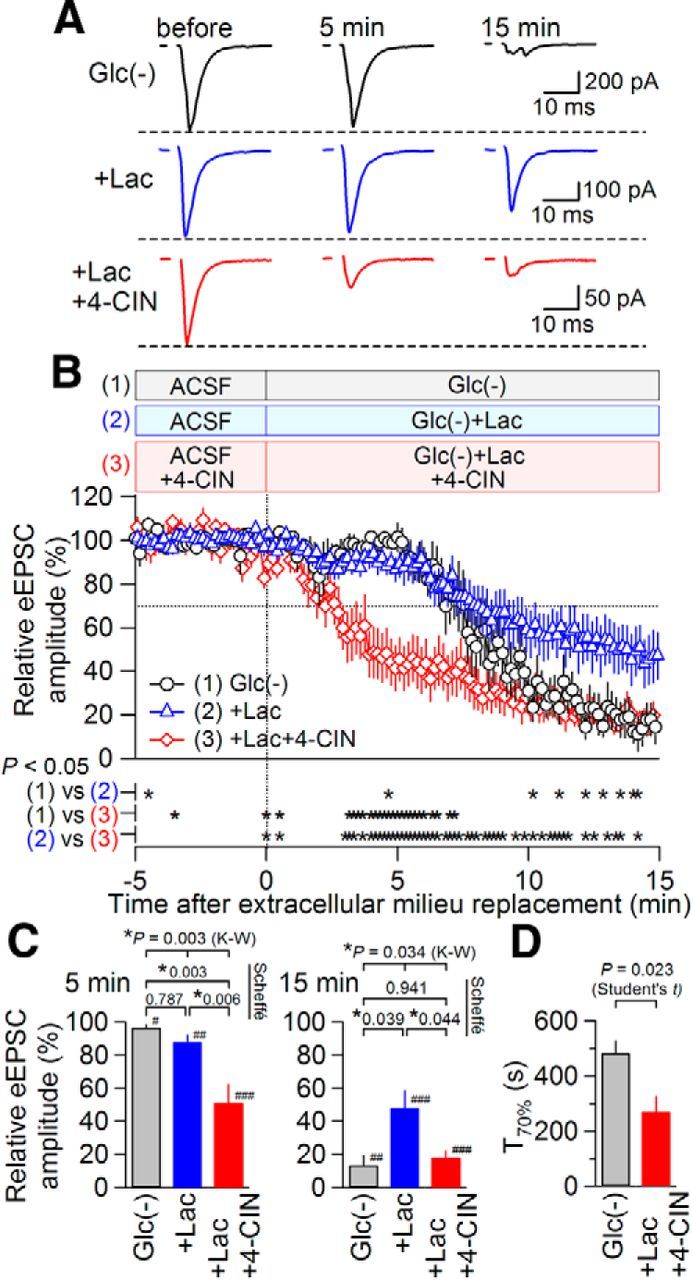
Extracellular perfusion of lactate can partially rescue the synaptic suppression by glucose deprivation in a 4-CIN-sensitive manner. A, Averaged eEPSC waveforms (n = 8) before (left) and during (middle, at 5 min; right, at 15 min) each manipulation (from top to bottom: glucose deprivation; replacement of glucose with 20 mm lactate; replacement of glucose with 20 mm lactate in the presence of 1 mm 4-CIN) at 32°C. B, Summary of the time courses of eEPSC amplitudes (black circles, glucose deprivation; n = 6; blue triangles, replacement of glucose with 20 mm lactate; n = 10; red diamonds, replacement of glucose with 20 mm lactate in the presence of 1 mm 4-CIN; n = 9). The eEPSC amplitude was significantly different (p < 0.05; Mann–Whitney U test) at the times marked with “*” at the bottom of plots. Data are presented as the mean values ± SEM. C, Summary of the effects of extracellular milieu replacement on eEPSC amplitude at 5 (left) and 15 min (right) after replacement. K-W, results of statistical comparison with Kruskal–Wallis multiple-comparison test among three groups. The values below the top brackets indicate the p values obtained by pairwise Scheffé comparisons between each group (pairs are shown with brackets). *p < 0.05, ###p < 0.001, ##p < 0.01, #p < 0.05 versus pre-replacement (Mann–Whitney U test). Data are presented as the mean values ± SEM. D, Summary of the time required to achieve a 70% decrease in eEPSC amplitude (T70) by glucose deprivation in the absence and presence of 4-CIN. A Student's t test between two groups resulted in p < 0.05.
Table 1.
Effects of glucose deprivation on eEPSC amplitude and those of lactate and 4-CIN thereon
| Before | At 5 min | At 15 min | n | |
|---|---|---|---|---|
| Glc(−) | −502.8 ± 86.1 pA | −480.0 ± 76.8 pA | −55.6 ± 22.1 pA | 6 |
| Glc(−)+Lac | −628.7 ± 22.1 pA | −539.9 ± 69.9 pA | −323.1 ± 91.4 pA | 10 |
| Glc(−)+Lac + 4-CIN | −357.7 ± 68.2 pA | −154.6 ± 38.8 pA | −54.8 ± 12.1 pA | 9 |
Mean values and SEM of the amplitude of eEPSC before and during each manipulation.
We then examined whether the addition of lactate could rescue this synaptic suppression by glucose deprivation. Replacement of the normal extracellular solution with an extracellular solution containing 0 mm glucose and 20 mm lactate again only slightly affected eEPSC amplitude for the first ∼5 min (to 87.7 ± 4.6% of pre-replacement; p = 0.001; n = 10; Mann–Whitney U test vs pre-replacement), in the same manner observed after glucose deprivation (Fig. 8A,B, Table 1). After this period, eEPSC amplitude gradually decreased to approximately half of the pre-replacement values (p < 0.001; n = 10; Mann–Whitney U test vs pre-replacement; Fig. 8A,B, Table 1), even 15 min after application of this glucose-free, lactate-rich solution. This value at 15 min post application was significantly larger than that of the glucose-free solution without lactate (Fig. 8C; p = 0.039, pairwise Scheffé comparison after Kruskal–Wallis multiple-comparison test). This result indicates that the addition of lactate alleviates the potent late-phase synaptic suppression induced with glucose deprivation and maintains eEPSC amplitude at a significantly higher level than the glucose deprivation without lactate.
To examine whether MCTs are involved in this “rescue” effect of lactate, we performed the same replacement experiment with glucose-free and lactate-rich (20 mm) solution, this time in the presence of 4-CIN. First, the slices received 4-CIN (1 mm) for 15 mm. It is hypothesized that the synaptic transmission under study no more depended on lactate transport but rather depended mostly on other sources of energy, such as direct glucose uptake by the neurons. Application of the glucose-free and lactate-rich solution in the presence of 4-CIN markedly and rapidly decreased eEPSC amplitude to 18.0 ± 4.4% of the pre-replacement amplitude after 15 min (p < 0.001; n = 9; Mann–Whitney U test vs pre-replacement; Fig. 8,“+Lac+4-CIN”; Table 1), suggesting that integrity of MCT function is necessary for such rescue effect of lactate against glucose deprivation. The inhibition of eEPSC amplitude by 15 min glucose deprivation in the presence of lactate was significantly larger in the presence of 4-CIN than that in the absence of 4-CIN (p = 0.044; pairwise Scheffé comparison after Kruskal–Wallis multiple-comparison test; Fig. 8C, right). Unlike the results observed in the absence of 4-CIN, glucose deprivation abruptly decreased eEPSC amplitude immediately after solution replacement without early latent phase (Fig. 8B, red line; Table 1). In the presence of 4-CIN, T70 was 269.6 ± 59.0 s, which was, on average, 212 s shorter than that observed in the absence of 4-CIN (481.9 ± 47.3 s; as described above; p < 0.05; Student's t test; Fig. 8D). This result strongly supports the notion that the transport of lactate plays a predominant role in the maintained excitatory transmission in the early phase after glucose deprivation.
The effects of glucose deprivation on the holding current varied among the neurons. Glucose deprivation for 15 min induced large shifts in the inward holding current in three of six neurons (range, −74.5 to −123.5 pA; mean, −98.4 ± 14.2 pA) and exerted only a limited shift in the other three neurons (range, −1.3 to −15.2 pA; mean, −8.6 ± 4.0 pA). The mean shift for all six neurons was −53.5 ± 21.1 pA. In contrast, in the presence of 20 mm lactate, the shift in holding current was consistently smaller in amplitude than −60 pA in all 10 neurons examined (holding current shift at 15 min of glucose deprivation and lactate addition, −18.8 ± 5.4 pA). However, this effect of lactate was not inhibited by 4-CIN in eight of nine neurons examined, in which the shift in holding current was consistently smaller in amplitude than −26.9 pA at 15 min (mean, −9.9 ± 3.8 pA; n = 8). One remaining neuron out of nine presented an exceptionally larger shift in holding current (−328.0 pA) following glucose deprivation and lactate addition in the presence of 4-CIN.
Inhibition of MCT affects intracleft glutamate level
Our preliminary electron microscopic observation of the NTS synapse suggests that a large majority of both presynaptic and postsynaptic elements have mitochondria within them (M. Nagase et al., unpublished observation), which is in agreement with many previous electron microscope studies in the various area of brain (Sheng and Cai, 2012). This common feature would suggest that not only the postsynaptic responses but also presynaptic elements demand efficient energy supply to maintain full expression of synaptic transmission. As shown above, it is unlikely that the presynaptic mechanism underlying regulation of release probability was profoundly affected by 4-CIN to contribute to the decrease in eEPSC amplitude. Another process that would require ATP is the presynaptic fulfilling of the vesicles by vesicular glutamate transporters (Schäfer et al., 2002; Lachamp et al., 2006) that use plasma-vesicular H+ gradient generated by vesicular H-ATPase (Fremeau et al., 2004). To examine whether inhibition of MCT also affects this ATP-dependent process and reduces the amount of glutamate released, we evaluated the effect of 4-CIN on the intracleft glutamate concentration by analyzing the blockade by γ-d-glutamylglycine (γDGG), a low-affinity competitive antagonist of AMPA-Rs (Liu et al., 1999). The normalized degree of reduction of eEPSC amplitude with γDGG allows indirect evaluation of the intracleft (near-receptors) concentration of glutamate (Liu et al., 1999). The degree of reduction in eEPSC amplitude with γDGG was significantly larger for the eEPSCs recorded in the presence of 4-CIN (49.7 ± 6.2%) than those recorded in the absence of 4-CIN (37.3 ± 6.7%; p < 0.05, Wilcoxon sign tests; n = 6; Fig. 9), suggesting that the intracleft glutamate concentration was reduced with 4-CIN. There was no significant difference in the degree of suppression of eEPSC amplitude between the first and second applications of γDGG, separated by an interval of 30 min, when 4-CIN was not added (first, 35.3 ± 2.2%; second, 41.7 ± 4.7; n = 6; p = 0.25, Wilcoxon sign test). These results strongly suggest that an inhibition of lactate transport might also reduce vesicular glutamate content with limited effect on the release probability. However, whether this presynaptic effect of 4-CIN depends on suppression of MCT-mediated transport of lactate or that of mitochondrial pyruvate transport remains undetermined, because the experiments in Figure 7 only describe the limited involvement of mitochondrial effect in postsynaptic neuron.
Figure 9.
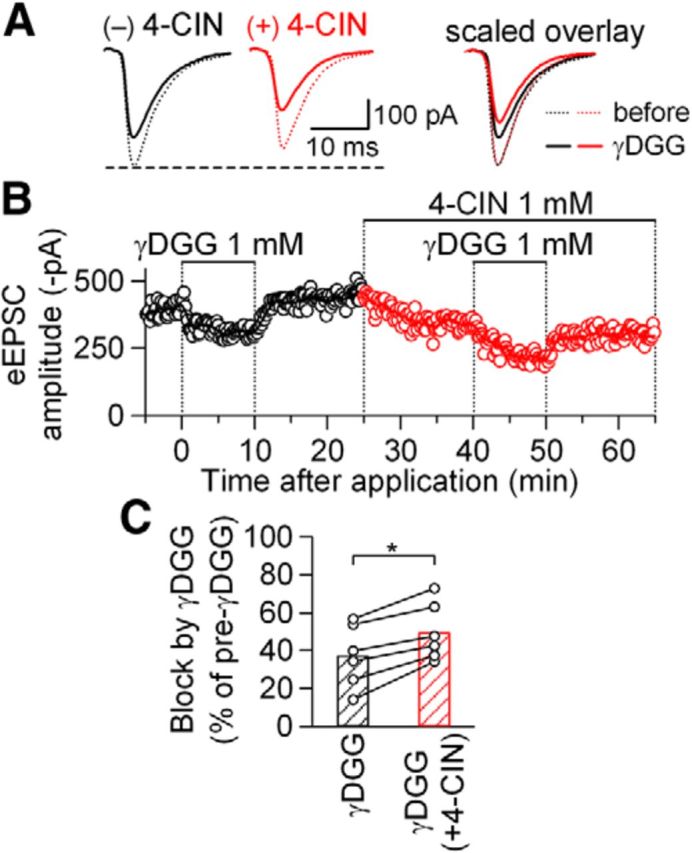
4-CIN enhanced the inhibitory effects of γDGG on eEPSC amplitude. A, Averaged eEPSC waveforms (n = 8) before (dotted lines) and during (solid lines) γDGG (1 mm) application in the absence (black) and presence (red) of 4-CIN (1 mm). Right, An overlay of these four traces scaled to the eEPSC before γDGG application. B, Time course of eEPSC amplitudes (open circles, the amplitude of each eEPSC1; line, moving average over nine consecutive responses). C, Summary of the effects of γDGG on eEPSC amplitude in the absence of and presence of 4-CIN. *p < 0.05 (Wilcoxon sign test); n = 6. Open circles represent the values from each neuron.
MCT inhibition also reduced NMDA-R-mediated EPSCs and, to a lesser extent, the IPSCs
Next, we analyzed the effect of 4-CIN on the postsynaptic currents mediated by NMDA-Rs (EPSCNMDA) and those by GABAA-Rs (IPSCs).
The eEPSCNMDA was recorded at a holding potential of +40 mV in the presence of CNQX and 1.3 mm Mg2+. An addition of 1 mm 4-CIN significantly reduced the amplitude of eEPSCNMDA by 36.2 ± 5.1% (from +58.3 ± 10.7 to +37.8 ± 8.1 pA; Fig. 10A), which was significantly weaker than the reduction of eEPSC recorded at −60 mV (Fig. 1; p < 0.05, Mann–Whitney U test). However, this comparison does not only involve the difference between AMPA-R and NMDA-R but also the following three kinds of differences: (1) difference in the driving force at −60 and +40 mV (∼3:2 as the reversal potential is ∼0 mV for both NMDA-Rs and AMPA-Rs), and (2) differences in the current carrier ion and flow direction. At +40 mV, the driving force for the Na+ is almost negligible and the current is mostly composed of outward flow of K+. (3) Difference in the driving force of H+: because the lactate transport by MCT depends on H+ gradient, the outward transport of lactate is more favored at +40 mV than the inward transport at the present condition, where the equilibrium potential of H+ is approximately within ±10 mV. Therefore, to isolate the difference in the type of receptor channels, we compared the effect on eEPSCNMDA and eEPSCAMPA, both being recorded at a holding potential of +40 mV as an outward current. At +40 mV, there was no significant difference between eEPSCNMDA and eEPSCAMPA (Fig. 10A3; the data for eEPSCAMPA at +40 mV plotted here is the same as in Fig. 11D and plotted for direct comparison; there was a significant difference (p < 0.05) between the effect of 4-CIN on eEPSCAMPA at +40 mV and that on eEPSC recorded at −60 mV, which is described more in detail in Fig. 11). These data suggest that blockade of MCTs affects both AMPA-R- and NMDA-R-mediated excitatory transmissions to a similar degree, when the direction of the current flow is almost the same.
Figure 10.

Comparisons of the effects of 4-CIN on postsynaptic responses mediated by AMPA-Rs, NMDA-Rs, and GABAA-Rs. A1, Averaged eEPSCNMDA waveforms (n = 8) before (black) and during (red) 4-CIN (1 mm) application. The holding potential was at +40 mV. A2, Time courses of eEPSCNMDA amplitudes (open circles, the amplitude of each eEPSCNMDA; line, moving average over nine consecutive responses). A3, Summary of the effects of 4-CIN on the amplitudes of eEPSCAMPA (at +40 mV; n = 5) and eEPSCNMDA (at +40 mV; n = 7); eEPSCNMDA was abolished by MK-801 (black bar; n = 6). ##p < 0.01 versus pre-4-CIN; NS, not significantly different (Mann–Whitney U test). Data are presented as the mean values ± SEM. B1, Averaged eIPSC waveforms (n = 8) before (black) and during (red) 4-CIN (1 mm) application. The holding potential was −60 mV (estimated Cl− reversal potential was ∼0 mV). B2, Time course of eIPSC amplitude (open circles, the amplitude of each eIPSC1; line, moving average over nine consecutive responses). B3, Summary of the effects of 4-CIN on the amplitudes of eEPSC (at −60 mV; n = 9) and eIPSC (at −60 mV; n = 6). *p < 0.05, ###p < 0.001, ##p < 0.01 versus pre-4-CIN (Mann–Whitney U test).
We then analyzed the effects of 4-CIN on inhibitory transmission. For this purpose, stimulation electrodes were placed in the dorsomedial NTS, where GABAergic interneurons are densely located (Negishi and Kawai, 2011), to activate monosynaptic IPSCs. This time, the eIPSCs were recorded at a holding current of −60 mV as an inward current in the presence of kynurenic acid (3 mm), using a KCl-containing patch electrode to allow direct comparison with eEPSC (Fig. 10B). 4-CIN significantly decreased the amplitude of eIPSCs by 20.1 ± 7.0% (from −280.0 ± 37.2 to −215.2 ± 20.2 pA; Fig. 10B). This reduction in amplitude by 4-CIN was significantly smaller than that for eEPSC also recorded at −60 mV (Fig. 10B3; data for the eEPSC amplitude in this graph are the same as plotted in Fig. 1C at 1 mm and plotted here for direct comparison). We have also analyzed the amplitude of mIPSC recorded in the presence of TTX. 4-CIN reduced the mIPSC amplitude to 83.6 ± 7.5% of pre-4-CIN value (n = 4; p < 0.05, Mann–Whitney U test; from −32.1 ± 3.7 to −27.3 ± 5.2 pA), which is very similar to the reduction in eIPSC amplitude by 4-CIN described above. The mIPSC frequency was much smaller than that of mEPSC and the change by 4-CIN was not significant (from 0.28 ± 0.17 to 0.41 ± 0.22 events/s; n = 4; p = 0.199, paired t test). Together, excitatory transmission, whichever mediated by AMPA-Rs or NMDA-Rs, is more sensitive to MCT blockade than the inhibitory transmission in the NTS.
Frequency and ionic current direction of synaptic current affects the MCT dependence of synaptic transmission
To further characterize how MCT inhibition affects synaptic transmission, we compared the effects of 4-CIN on synaptic currents recorded under experimental conditions different from the standard condition used above (i.e., at a frequency of 0.1 Hz, at a holding potential of −60 mV, at extracellular Ca2+ concentration of 2 mm, and at room temperature; Fig. 11A,D; these “control” data in Fig. 11A and D are the same as plotted in Fig. 1A and C at 1 mm and plotted here for direct comparison). Figure 11 illustrates the effects of 4-CIN on the eEPSCs that were (1) evoked at a higher frequency (1 Hz; Fig. 11B), (2) generated with larger inward driving force (Fig. 11C), (3) mainly carried by outward K+ flow at a holding potential (+40 mV) close to the equilibrium potential of Na+ (+38 mV; Fig. 11C), (4) recorded at a lowered release probability by reducing [Ca2+]o to 0.5 mm (Fig. 11C), and (5) recorded at a temperature of 32°C (Fig. 11C). 4-CIN significantly reduced eEPSC amplitude in all of these conditions (Fig. 11D). However, the degree of inhibition by 4-CIN was significantly larger when synaptic transmission was evoked at a higher frequency (p = 0.005; Mann–Whitney U test; Fig. 11D, “1 Hz stim”) and significantly smaller when the eEPSC was recorded as an outward K+ current (p = 0.039; Mann–Whitney U test; Fig. 11D, “+40 mV”). However, as we failed to detect significant differences among the effects of 4-CIN at −90 mV, −60 mV, and +40 mV holding potential conditions (p = 0.08; Kruskal–Wallis multiple-comparison test), the hypothesis that the degree of inhibition by 4-CIN depends on the holding potential should be retained at this moment. Furthermore, in a quite similar manner to 4-CIN, the reduction in eEPSC amplitude with d-lactate was significantly smaller at +40 mV than at −60 mV (Fig. 11C,D, blue traces and bars, respectively), supporting further that insufficient energy supply for maintaining the EPSC-related subsynaptic ionic balance might primarily underlie this eEPSC suppression. Such dependence of 4-CIN effect on the frequency and current carrier/direction makes it rather unlikely that this inhibition resulted only from the direct competitive inhibition of AMPA-Rs by 4-CIN under the present experimental conditions. These results would further support the notion that local spatially delimited activity and energy supply determines MCT dependence at each synapse in different situations.
Discussion
Neurons are equipped with the following four mechanisms for ATP production with distinct degree of efficiency and contribution: (1) glycolysis (ATP production from the glycolysis of neuronal glucose), (2) glycolysis-Krebs cycle (oxidative phosphorylation in mitochondria using pyruvate produced by intraneuronal glycolysis), (3) lactate-Krebs cycle (ATP production in mitochondria using pyruvate produced from lactate of astrocyte origin after cell-to-cell transfer), and (4) creatine shuttle (ATP production through a creatine-phosphocreatine interaction). Additionally, in whole-cell recordings, ATP molecules are supplied directly through the internal solution, as performed in this study; this ATP supply is not physiological and may be referred to as (5) experimental supply.
The potent effect of MCT inhibition on the EPSC amplitude and its dependence on intracellular ATP/lactate and extracellular glucose/lactate states, as well as that on the frequency of transmission and direction of ionic flow, indicate that the excitatory synaptic transmission, whichever mediated by AMPA-Rs or NMDA-Rs, is largely supported by the lactate-Krebs cycle mechanism. Thus it is concluded that the astrocyte-to-neuron energy supply mediated by lactate transport through MCTs is necessary for maintaining excitatory synaptic transmission. In contrast, the maintenance of resting membrane potentials, the generation of action potentials, the regulation of transmitter release probability, and inhibitory synaptic transmission did not rely as heavily on the ATP produced by the lactate-Krebs cycle. These conclusions depend on the results with pharmacological inhibition of MCTs in various experimental situations by 4-CIN and partially by d-lactate and phloretin. It is important to note that this study is also the first to show a direct competitive inhibitory effect of 4-CIN on AMPA-R-mediated currents at higher concentrations. Thus, interpretations of the effects of 4-CIN should be made with consideration to such direct inhibition for the data in this study and also in other studies.
The mechanisms of synaptic inhibition
Alle et al. (2009) estimated the transmembrane flow of ions and enzymatic activity (including pumps and exchangers) during various neuronal activities in the mammalian brain and concluded that the generation of EPSCs requires the largest number of ATP molecules of all neuronal activities. The decrease in EPSC amplitude by MCT inhibition as observed in this study would indicate that reduced ATP production by inhibiting lactate transfer impairs postsynaptic function. It remains, however, undetermined at this moment how a decrease in local supply of ATP decreased EPSC amplitude. Neuronal Na+-K+-ATPase (NKA) are expressed within dendritic spines through interaction with PSD-95 (Blom et al., 2011) and colocalizes with GluR2 subunit (Zhang et al., 2009). MCT2 is a component of the postsynaptic density through interacting with GluR2/3 (Bergersen et al., 2005; Pierre et al., 2009) or delta-GluR (Bergersen et al., 2001). These lines of evidence support a notion that NKA and MCT2 closely colocalize in the postsynaptic compartment and contribute to an effective “on-site” homeostatic maintenance of the Na+ and K+ gradient (Rose and Konnerth, 2001). Thus, it is expected that inhibition of MCT would lead to a spatially delimited postsynaptic depolarization, despite the somatic voltage clamp, and momentary accumulation of Na+ below synaptic membrane, thus reducing driving force for EPSC. This mechanism might partly underlie the reduced EPSC amplitude by MCT inhibition. The more potent inhibition by 4-CIN and d-lactate at a condition where the Na+ is the main inward current carrier and that by 4-CIN at a higher synaptic transmission frequency (Fig. 11) supports this interpretation. The mechanism underlying the eEPSC inhibition at +40 mV remains undetermined, but it would be attributed to non-NKA-mediated effect of these inhibitors.
In contrast, it is less likely that the decreased postsynaptic responses resulted from direct influences of reduced ATP on AMPA-Rs, such as through changes in their phosphorylation state (Zivkovic and Buck, 2010) or membrane surface expression (Maekawa et al., 2009) because of the similar suppression of EPSCAMPA and EPSCNMDA by 4-CIN (Fig. 10A). In addition, the following observations cannot be attributed to a simple competitive inhibition of AMPA-Rs: (1) the significantly larger reduction by 4-CIN as well as by d-lactate in EPSCAMPA amplitude at −60 mV than at +40 mV (Fig. 11); (2) the similar reduction by 4-CIN at distinct release probability at 2 and 0.5 mm [Ca2+]o, thus at distinct intracleft glutamate concentrations (Fig. 11); (3) the significant reduction in IPSC amplitude, albeit to a lesser degree than EPSC, by the same concentration of 4-CIN (Fig. 10B); (4) dependence of 4-CIN effect on intracellular ATP concentration (Fig. 6); and (5) distinct onset latency for the glucose deprivation-induced reduction in EPSC amplitude in the presence and absence of 4-CIN (Fig. 8). Further evaluation of the involvement of MCT-mediated energy supply in maintenance of excitatory synaptic transmission in isolation from the direct effects on AMPA-Rs should await development of more selective drugs. Also, it would be a challenging but important future subject to visualize local concentrations of ATP and lactate as well as changes in [Na+]i in the very vicinity of the functioning synapses, which is technically so demanding at this moment, to understand the relationship between MCT and AMPA-R function.
Small but significant contribution of presynaptic mechanisms
The present data also suggest a decrease in released amount of glutamate by 4-CIN without reducing release probability (Figs. 1, 9). Both the vesicular glutamate transporter and the vesicular GABA transporter uses the H+-gradient generated by vacuolar H+-ATPase to accumulate glutamate and GABA, respectively, in the synaptic vesicles. Thus, the vesicular accumulation is a process highly dependent on available ATP at the presynaptic terminal. Though we have no evidence for the reduction in released GABA by MCT inhibition, it is possible that inhibition of such ATP-dependent vesicular transport would have played at least a role in the decrease in EPSC and IPSC amplitude after 4-CIN. However, the observed change in the EPSC blockade by γDGG was relatively small compared with the robust and potent inhibition of the postsynaptic responses, in agreement with the essential role of glycolysis in maintaining presynaptic vesicle filling at glutamatergic terminals (Ikemoto et al., 2003). Because it is technically demanding to manipulate ATP and/or lactate concentration specifically in the presynaptic terminal and to apply MCT inhibitors selectively to the presynaptic terminals, it remains to be an open question for the future studies whether MCT-dependent lactate transport from astrocytes and/or pyruvate transport to mitochondria are constitutively essential in the transmitter release processes.
Excitatory versus inhibitory synaptic transmission
The present results also indicate that the involvement of MCT-mediated energy in inhibitory transmission is smaller than that in excitatory transmission. The simplest interpretation for this observation is that the machinery to support the lactate-Krebs cycle mechanism is not predominant at the inhibitory synapses, which rather depends on other mechanisms (Laschet et al., 2004). This interpretation seems reasonable because the equilibrium potential of Cl− is closer to the resting membrane potential in physiological situations, implying that the net movement of Cl− during inhibitory transmission is much smaller than that for Na+ during excitatory transmission. Indeed, in the hippocampus and cerebellum, MCT2 expression at the inhibitory synapses is scarce (Bergersen et al., 2005). Altogether, the present observations confirm the notion that the inhibitory synaptic transmission is much more of “low cost” than excitatory transmission (Attwell and Gibb, 2005).
Synaptic symbiosis between astrocytes and neurons as an autonomous local energy supply system
Most of the central synapses are formed of three components: presynaptic elements, postsynaptic elements, and astrocytic fine processes (Halassa and Haydon, 2009; Hamilton and Attwell, 2010; Nedergaard and Verkhratsky, 2012). In addition to the glutamate clearance (Rothstein et al., 1996) and the intercellular signaling using “gliotransmitters” (Hamilton and Attwell, 2010; Inoue et al., 2010), the results of this study provide support for an energetic interaction between neurons and astrocytes at the synapses. The inhibitory effect of 4-CIN on eEPSC amplitude even at raised [ATP]i (Fig. 6C) suggests that there must be very localized compartments of [ATP]i in the cell. This interaction at the excitatory synapses might therefore be regarded as an example of “synaptic symbiosis” (Fig. 12), in which presynaptic and postsynaptic activities depend on the energy provided by adjacent non-neuronal cells (Nedergaard and Verkhratsky, 2012). This finding also implies that the subcellular sites for ATP production and consumption are highly compartmentalized in the neurons.
Figure 12.

Schema depicting “synaptic symbiosis” between astrocytes and neurons. See text for details.
Such localized synaptic symbiosis would account for the following well known but unexplained particularities of synapses: whereas the presynaptic and/or postsynaptic structures contain mitochondria, but do not contain glycogen (Brown and Ransom, 2007; Kann and Kovacs, 2007), the astrocytic fine processes contain glycogen, but few, if any, mitochondria (Brown and Ransom, 2007; Hertz et al., 2007). In this regard, the present observation that 4-CIN abolished the ∼5 min latent phase of the inhibitory effect of glucose deprivation is interesting because this suggests lactate transport from astrocytes through MCTs would indeed be a source of energy supply for emergency fall of energy in neurons. Whether this depends on glycogen phosphorylation would be an important future subject. Such noncell autonomous and self-supplying energetic autonomy would be of importance for maintenance of synaptic transmission as well as expression of its plasticity during adaptive reorganization of the central network (Suzuki et al., 2011).
Footnotes
This work was supported by Grant-in-Aid for Scientific Research on Innovative Areas from the Ministry of Education, Culture, Sports, Science, and Technology to F.K. (No. 24111544) and Grants from The Naito Foundation to M.N., M.N. is a recipient of the Ishizu Shun Memorial Scholarship. We thank Yoshinori Kawai for invaluable discussions during the preparation of this manuscript and Dr. Haruo Okado for providing us with cRNAs for AMPA receptor subunits. Invaluable support from Kimiko Ishihara and Takako Tarumi-Matsuo during experiments and preparation of this manuscript is acknowledged.
The authors declare no competing financial interests.
References
- Alle H, Roth A, Geiger JR. Energy-efficient action potentials in hippocampal mossy fibers. Science. 2009;325:1405–1408. doi: 10.1126/science.1174331. [DOI] [PubMed] [Google Scholar]
- Attwell D, Gibb A. Neuroenergetics and the kinetic design of excitatory synapses. Nat Rev Neurosci. 2005;6:841–849. doi: 10.1038/nrn1784. [DOI] [PubMed] [Google Scholar]
- Attwell D, Laughlin SB. An energy budget for signaling in the grey matter of the brain. J Cereb Blood Flow Metab. 2001;21:1133–1145. doi: 10.1097/00004647-200110000-00001. [DOI] [PubMed] [Google Scholar]
- Atwood HL, Karunanithi S. Diversification of synaptic strength: presynaptic elements. Nat Rev Neurosci. 2002;3:497–516. doi: 10.1038/nrn876. [DOI] [PubMed] [Google Scholar]
- Barros LF, Deitmer JW. Glucose and lactate supply to the synapse. Brain Res Rev. 2010;63:149–159. doi: 10.1016/j.brainresrev.2009.10.002. [DOI] [PubMed] [Google Scholar]
- Bélanger M, Allaman I, Magistretti PJ. Brain energy metabolism: focus on astrocyte-neuron metabolic cooperation. Cell Metab. 2011;14:724–738. doi: 10.1016/j.cmet.2011.08.016. [DOI] [PubMed] [Google Scholar]
- Bergersen LH, Magistretti PJ, Pellerin L. Selective postsynaptic co-localization of MCT2 with AMPA receptor GluR2/3 subunits at excitatory synapses exhibiting AMPA receptor trafficking. Cereb Cortex. 2005;15:361–370. doi: 10.1093/cercor/bhh138. [DOI] [PubMed] [Google Scholar]
- Bergersen L, Waerhaug O, Helm J, Thomas M, Laake P, Davies AJ, Wilson MC, Halestrap AP, Ottersen OP. A novel postsynaptic density protein: the monocarboxylate transporter MCT2 is co-localized with delta-glutamate receptors in postsynaptic densities of parallel fiber-Purkinje cell synapses. Exp Brain Res. 2001;136:523–534. doi: 10.1007/s002210000600. [DOI] [PubMed] [Google Scholar]
- Blom H, Rönnlund D, Scott L, Spicarova Z, Widengren J, Bondar A, Aperia A, Brismar H. Spatial distribution of Na+-K+-ATPase in dendritic spines dissected by nanoscale superresolution STED microscopy. BMC Neurosci. 2011;12:16. doi: 10.1186/1471-2202-12-16. [DOI] [PMC free article] [PubMed] [Google Scholar]
- Briski KP, Cherian AK, Genabai NK, Vavaiya KV. In situ coexpression of glucose and monocarboxylate transporter mRNAs in metabolic-sensitive caudal dorsal vagal complex catecholaminergic neurons: transcriptional reactivity to insulin-induced hypoglycemia and caudal hindbrain glucose or lactate repletion during insulin-induced hypoglycemia. Neuroscience. 2009;164:1152–1160. doi: 10.1016/j.neuroscience.2009.08.074. [DOI] [PubMed] [Google Scholar]
- Brown AM, Ransom BR. Astrocyte glycogen and brain energy metabolism. Glia. 2007;55:1263–1271. doi: 10.1002/glia.20557. [DOI] [PubMed] [Google Scholar]
- Cataldo AM, Broadwell RD. Cytochemical identification of cerebral glycogen and glucose-6-phosphatase activity under normal and experimental conditions. II. Choroid plexus and ependymal epithelia, endothelia and pericytes. J Neurocytol. 1986;15:511–524. doi: 10.1007/BF01611733. [DOI] [PubMed] [Google Scholar]
- Erlichman JS, Hewitt A, Damon TL, Hart M, Kurascz J, Li A, Leiter JC. Inhibition of monocarboxylate transporter 2 in the retrotrapezoid nucleus in rats: a test of the astrocyte-neuron lactate-shuttle hypothesis. J Neurosci. 2008;28:4888–4896. doi: 10.1523/JNEUROSCI.5430-07.2008. [DOI] [PMC free article] [PubMed] [Google Scholar]
- Flick MJ, Konieczny SF. Identification of putative mammalian D-lactate dehydrogenase enzymes. Biochem Biophys Res Commun. 2002;295:910–916. doi: 10.1016/S0006-291X(02)00768-4. [DOI] [PubMed] [Google Scholar]
- Fremeau RT, Jr, Voglmaier S, Seal RP, Edwards RH. VGLUTs define subsets of excitatory neurons and suggest novel roles for glutamate. Trends Neurosci. 2004;27:98–103. doi: 10.1016/j.tins.2003.11.005. [DOI] [PubMed] [Google Scholar]
- Fujiwara Y, Kubo Y. Regulation of the desensitization and ion selectivity of ATP-gated P2X2 channels by phosphoinositides. J Physiol. 2006;576:135–149. doi: 10.1113/jphysiol.2006.115246. [DOI] [PMC free article] [PubMed] [Google Scholar]
- Halassa MM, Haydon PG. The tripartite synapse. In: Parpura V, Haydon PG, editors. Astrocytes in (patho)physiology of the nervous system. New York: Springer; 2009. pp. 407–415. [Google Scholar]
- Halestrap AP, Denton RM. The specificity and metabolic implications of the inhibition of pyruvate transport in isolated mitochondria and intact tissue preparations by alpha-Cyano-4-hydroxycinnamate and related compounds. Biochem J. 1975;148:97–106. doi: 10.1042/bj1480097. [DOI] [PMC free article] [PubMed] [Google Scholar]
- Halestrap AP, Price NT. The proton-linked monocarboxylate transporter (MCT) family: structure, function and regulation. Biochem J. 1999;343:281–299. doi: 10.1042/0264-6021:3430281. [DOI] [PMC free article] [PubMed] [Google Scholar]
- Hamilton NB, Attwell D. Do astrocytes really exocytose neurotransmitters? Nat Rev Neurosci. 2010;11:227–238. doi: 10.1038/nrn2803. [DOI] [PubMed] [Google Scholar]
- Hertz L, Peng L, Dienel GA. Energy metabolism in astrocytes: high rate of oxidative metabolism and spatiotemporal dependence on glycolysis/glycogenolysis. J Cereb Blood Flow Metab. 2007;27:219–249. doi: 10.1038/sj.jcbfm.9600343. [DOI] [PubMed] [Google Scholar]
- Himmi T, Perrin J, Dallaporta M, Orsini JC. Effects of lactate on glucose-sensing neurons in the solitary tract nucleus. Physiol Behav. 2001;74:391–397. doi: 10.1016/S0031-9384(01)00573-X. [DOI] [PubMed] [Google Scholar]
- Ikemoto A, Bole DG, Ueda T. Glycolysis and glutamate accumulation into synaptic vesicles. Role of glyceraldehyde phosphate dehydrogenase and 3-phosphoglycerate kinase. J Biol Chem. 2003;278:5929–5940. doi: 10.1074/jbc.M211617200. [DOI] [PubMed] [Google Scholar]
- Inoue K, Kato F, Tsuda M. The modulation of synaptic transmission by the glial purinergic system. Open Neurosci J. 2010;4:84–92. [Google Scholar]
- Ishii H, Nakajo K, Yanagawa Y, Kubo Y. Identification and characterization of Cs+-permeable K+ channel current in mouse cerebellar Purkinje cells in lobules 9 and 10 evoked by molecular layer stimulation. Eur J Neurosci. 2010;32:736–748. doi: 10.1111/j.1460-9568.2010.07336.x. [DOI] [PubMed] [Google Scholar]
- Izumi Y, Benz AM, Katsuki H, Zorumski CF. Endogenous monocarboxylates sustain hippocampal synaptic function and morphological integrity during energy deprivation. J Neurosci. 1997;17:9448–9457. doi: 10.1523/JNEUROSCI.17-24-09448.1997. [DOI] [PMC free article] [PubMed] [Google Scholar]
- Kann O, Kovács R. Mitochondria and neuronal activity. Am J Physiol Cell Physiol. 2007;292:C641–657. doi: 10.1152/ajpcell.00222.2006. [DOI] [PubMed] [Google Scholar]
- Kato F, Shigetomi E. Distinct modulation of evoked and spontaneous EPSCs by purinoceptors in the nucleus tractus solitarii of the rat. J Physiol. 2001;530:469–486. doi: 10.1111/j.1469-7793.2001.0469k.x. [DOI] [PMC free article] [PubMed] [Google Scholar]
- Keceli B, Kubo Y. Functional and structural identification of amino acid residues of the P2X2 receptor channel critical for the voltage- and [ATP]-dependent gating. J Physiol. 2009;587:5801–5818. doi: 10.1113/jphysiol.2009.182824. [DOI] [PMC free article] [PubMed] [Google Scholar]
- Lachamp P, Crest M, Kessler JP. Vesicular glutamate transporters type 1 and 2 expression in axon terminals of the rat nucleus of the solitary tract. Neuroscience. 2006;137:73–81. doi: 10.1016/j.neuroscience.2005.08.048. [DOI] [PubMed] [Google Scholar]
- Laschet JJ, Minier F, Kurcewicz I, Bureau MH, Trottier S, Jeanneteau F, Griffon N, Samyn B, Van Beeumen J, Louvel J, Sokoloff P, Pumain R. Glyceraldehyde-3-phosphate dehydrogenase is a GABAA receptor kinase linking glycolysis to neuronal inhibition. J Neurosci. 2004;24:7614–7622. doi: 10.1523/JNEUROSCI.0868-04.2004. [DOI] [PMC free article] [PubMed] [Google Scholar]
- Liu G, Choi S, Tsien RW. Variability of neurotransmitter concentration and nonsaturation of postsynaptic AMPA receptors at synapses in hippocampal cultures and slices. Neuron. 1999;22:395–409. doi: 10.1016/S0896-6273(00)81099-5. [DOI] [PubMed] [Google Scholar]
- Maekawa F, Tsuboi T, Fukuda M, Pellerin L. Regulation of the intracellular distribution, cell surface expression, and protein levels of AMPA receptor GluR2 subunits by the monocarboxylate transporter MCT2 in neuronal cells. J Neurochem. 2009;109:1767–1778. doi: 10.1111/j.1471-4159.2009.06100.x. [DOI] [PubMed] [Google Scholar]
- Matsuyama S, Ohkura S, Iwata K, Uenoyama Y, Tsukamura H, Maeda K, Kimura K. Food deprivation induces monocarboxylate transporter 2 expression in the brainstem of female rat. J Reprod Dev. 2009;55:256–261. doi: 10.1262/jrd.20214. [DOI] [PubMed] [Google Scholar]
- McKenna MC, Hopkins IB, Carey A. Alpha-cyano-4-hydroxycinnamate decreases both glucose and lactate metabolism in neurons and astrocytes: implications for lactate as an energy substrate for neurons. J Neurosci Res. 2001;66:747–754. doi: 10.1002/jnr.10084. [DOI] [PubMed] [Google Scholar]
- Nedergaard M, Verkhratsky A. Artifact versus reality–how astrocytes contribute to synaptic events. Glia. 2012;60:1013–1023. doi: 10.1002/glia.22288. [DOI] [PMC free article] [PubMed] [Google Scholar]
- Negishi Y, Kawai Y. Geometric and functional architecture of visceral sensory microcircuitry. Brain Struct Funct. 2011;216:17–30. doi: 10.1007/s00429-010-0294-5. [DOI] [PMC free article] [PubMed] [Google Scholar]
- Parsons MP, Hirasawa M. ATP-sensitive potassium channel-mediated lactate effect on orexin neurons: implications for brain energetics during arousal. J Neurosci. 2010;30:8061–8070. doi: 10.1523/JNEUROSCI.5741-09.2010. [DOI] [PMC free article] [PubMed] [Google Scholar]
- Patil GD, Briski KP. Lactate is a critical “sensed” variable in caudal hindbrain monitoring of CNS metabolic stasis. Am J Physiol Regul Integr Comp Physiol. 2005;289:R1777–R1786. doi: 10.1152/ajpregu.00177.2004. [DOI] [PubMed] [Google Scholar]
- Pellerin L, Bouzier-Sore AK, Aubert A, Serres S, Merle M, Costalat R, Magistretti PJ. Activity-dependent regulation of energy metabolism by astrocytes: an update. Glia. 2007;55:1251–1262. doi: 10.1002/glia.20528. [DOI] [PubMed] [Google Scholar]
- Pierre K, Pellerin L. Monocarboxylate transporters in the central nervous system: distribution, regulation and function. J Neurochem. 2005;94:1–14. doi: 10.1111/j.1471-4159.2005.03168.x. [DOI] [PubMed] [Google Scholar]
- Pierre K, Chatton JY, Parent A, Repond C, Gardoni F, Di Luca M, Pellerin L. Linking supply to demand: the neuronal monocarboxylate transporter MCT2 and the alpha-amino-3-hydroxyl-5-methyl-4-isoxazole-propionic acid receptor GluR2/3 subunit are associated in a common trafficking process. Eur J Neurosci. 2009;29:1951–1963. doi: 10.1111/j.1460-9568.2009.06756.x. [DOI] [PubMed] [Google Scholar]
- Randle JC, Guet T, Cordi A, Lepagnol JM. Competitive inhibition by NBQX of kainate/AMPA receptor currents and excitatory synaptic potentials: importance of 6-nitro substitution. Eur J Pharmacol. 1992;215:237–244. doi: 10.1016/0014-2999(92)90033-Z. [DOI] [PubMed] [Google Scholar]
- Rose CR, Konnerth A. NMDA receptor-mediated Na+ signals in spines and dendrites. J Neurosci. 2001;21:4207–4214. doi: 10.1523/JNEUROSCI.21-12-04207.2001. [DOI] [PMC free article] [PubMed] [Google Scholar]
- Rothstein JD, Dykes-Hoberg M, Pardo CA, Bristol LA, Jin L, Kuncl RW, Kanai Y, Hediger MA, Wang Y, Schielke JP, Welty DF. Knockout of glutamate transporters reveals a major role for astroglial transport in excitotoxicity and clearance of glutamate. Neuron. 1996;16:675–686. doi: 10.1016/S0896-6273(00)80086-0. [DOI] [PubMed] [Google Scholar]
- Rouach N, Koulakoff A, Abudara V, Willecke K, Giaume C. Astroglial metabolic networks sustain hippocampal synaptic transmission. Science. 2008;322:1551–1555. doi: 10.1126/science.1164022. [DOI] [PubMed] [Google Scholar]
- Sakurai T, Yang B, Takata T, Yokono K. Synaptic adaptation to repeated hypoglycemia depends on the utilization of monocarboxylates in Guinea pig hippocampal slices. Diabetes. 2002;51:430–438. doi: 10.2337/diabetes.51.2.430. [DOI] [PubMed] [Google Scholar]
- Schäfer MK, Varoqui H, Defamie N, Weihe E, Erickson JD. Molecular cloning and functional identification of mouse vesicular glutamate transporter 3 and its expression in subsets of novel excitatory neurons. J Biol Chem. 2002;277:50734–50748. doi: 10.1074/jbc.M206738200. [DOI] [PubMed] [Google Scholar]
- Sheng ZH, Cai Q. Mitochondrial transport in neurons: impact on synaptic homeostasis and neurodegeneration. Nat Rev Neurosci. 2012;13:77–93. doi: 10.1038/nrg3141. [DOI] [PMC free article] [PubMed] [Google Scholar]
- Shigetomi E, Kato F. Action potential-independent release of glutamate by Ca2+ entry through presynaptic P2X receptors elicits postsynaptic firing in the brainstem autonomic network. J Neurosci. 2004;24:3125–3135. doi: 10.1523/JNEUROSCI.0090-04.2004. [DOI] [PMC free article] [PubMed] [Google Scholar]
- Suzuki A, Stern SA, Bozdagi O, Huntley GW, Walker RH, Magistretti PJ, Alberini CM. Astrocyte-neuron lactate transport is required for long-term memory formation. Cell. 2011;144:810–823. doi: 10.1016/j.cell.2011.02.018. [DOI] [PMC free article] [PubMed] [Google Scholar]
- Taylor CP, Weber ML. Effect of temperature on synaptic function after reduced oxygen and glucose in hippocampal slices. Neuroscience. 1993;52:555–562. doi: 10.1016/0306-4522(93)90405-5. [DOI] [PubMed] [Google Scholar]
- Tekkök SB, Brown AM, Westenbroek R, Pellerin L, Ransom BR. Transfer of glycogen-derived lactate from astrocytes to axons via specific monocarboxylate transporters supports mouse optic nerve activity. J Neurosci Res. 2005;81:644–652. doi: 10.1002/jnr.20573. [DOI] [PubMed] [Google Scholar]
- Vilchez D, Ros S, Cifuentes D, Pujadas L, Vallès J, García-Fojeda B, Criado-García O, Fernández-Sánchez E, Medraño-Fernández I, Domínguez J, García-Rocha M, Soriano E, Rodríguez de Córdoba S, Guinovart JJ. Mechanism suppressing glycogen synthesis in neurons and its demise in progressive myoclonus epilepsy. Nat Neurosci. 2007;10:1407–1413. doi: 10.1038/nn1998. [DOI] [PubMed] [Google Scholar]
- Yamamoto K, Noguchi J, Yamada C, Watabe AM, Kato F. Distinct target cell-dependent forms of short-term plasticity of the central visceral afferent synapses of the rat. BMC Neurosci. 2010;11:134. doi: 10.1186/1471-2202-11-134. [DOI] [PMC free article] [PubMed] [Google Scholar]
- Yamazaki K, Shigetomi E, Ikeda R, Nishida M, Kiyonaka S, Mori Y, Kato F. Blocker-resistant presynaptic voltage-dependent Ca2+ channels underlying glutamate release in mice nucleus tractus solitarii. Brain Res. 2006;1104:103–113. doi: 10.1016/j.brainres.2006.05.077. [DOI] [PubMed] [Google Scholar]
- Zhang D, Hou Q, Wang M, Lin A, Jarzylo L, Navis A, Raissi A, Liu F, Man HY. Na,K-ATPase activity regulates AMPA receptor turnover through proteasome-mediated proteolysis. J Neurosci. 2009;29:4498–4511. doi: 10.1523/JNEUROSCI.6094-08.2009. [DOI] [PMC free article] [PubMed] [Google Scholar]
- Zivkovic G, Buck LT. Regulation of AMPA receptor currents by mitochondrial ATP-sensitive K+ channels in anoxic turtle neurons. J Neurophysiol. 2010;104:1913–1922. doi: 10.1152/jn.00506.2010. [DOI] [PubMed] [Google Scholar]
- Zucker RS, Regehr WG. Short-term synaptic plasticity. Annu Rev Physiol. 2002;64:355–405. doi: 10.1146/annurev.physiol.64.092501.114547. [DOI] [PubMed] [Google Scholar]