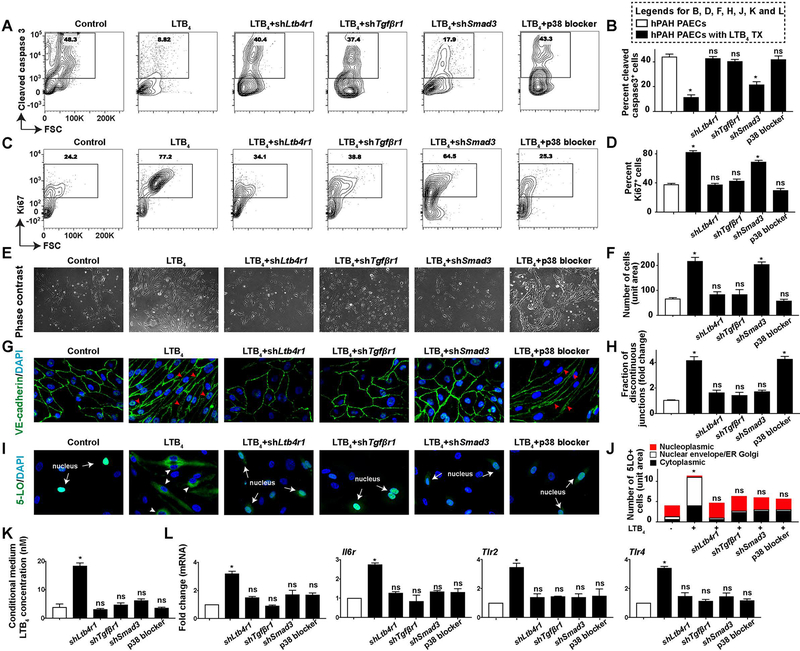
Figure 6. The transformation of BMPR2-defective PAECs requires LTB4-induced canonical and noncanonical TGF-β signaling.
PAECs from a hPAH patient were either infected with lentivirus of shLtb4r1 (shRNA targeting LTB4 receptor 1, LTB4RI), shTgfβr1 (shRNA silencing TGF-β receptor 1, TGFβR1), shSmad3, or were treated with a p38 blocker (SB203580, 1uM). All measurements were carried out 7 days post-treatment. (A and B) Representative flow cytometry contour plots and quantification of hPAH-PAECs stained for cleaved Caspase 3. n=6. (C and D) Representative flow cytometry contour plots and quantification of cells stained for Ki67. n=6. (E and F) Representative phase-contrast light microscopy images and quantification. n=6. Scale bar, 100μm. (G and H) Representative confocal images and quantification of cells stained with VE-cadherin (green). DAPI (blue) identifies nuclei. Red arrow heads point to the discontinuous cellular junctions in G. n=6. Scale bar, 100μm. (I and J) Representative confocal staining and quantification of 5-LO (green). DAPI (blue) identifies nuclei. White arrows point to endogenous 5-LO expression in the nucleus in I; white arrow heads indicate the nuclear envelope and ER and Golgi membrane localized 5-LO in I. n=6. Scale bar, 100μm. (K) Measurements of LTB4 in the culture medium. n=6. (L) Transcripts of Illr1, Il6r, Tlr2 and Tlr4. n=6. All data are presented as mean and SEM; Kruskal-Wallis test between inhibitor treatment groups versus vehicle control groups (white bar); ns, not significant, *p<0.05.

