Abstract
In single-molecule force spectroscopy experiments, a biomolecule is attached to a force probe via polymer linkers and the total extension of the molecule plus apparatus is monitored as a function of time. In a typical unfolding experiment at constant force, the total extension jumps between two values that correspond to the folded and unfolded states of the molecule. For several biomolecular systems, the committor, which is the probability to fold starting from a given extension, has been used to extract the molecular activation barrier (a technique known as “committor inversion”). In this work, we study the influence of the force probe, which is much larger than the molecule being measured, on the activation barrier obtained by committor inversion. We use a two-dimensional framework in which the diffusion coefficient of the molecule and of the pulling device can differ. We systematically study the free energy profile along the total extension obtained from the committor by numerically solving the Onsager equation and using Brownian dynamics simulations. We analyze the dependence of the extracted barrier on the linker stiffness, molecular barrier height, and diffusion anisotropy and, thus, establish the range of validity of committor inversion. Along the way, we showcase the committor of 2-dimensional diffusive models and illustrate how it is affected by barrier asymmetry and diffusion anisotropy.
I. INTRODUCTION
In single-molecule pulling experiments, mechanical force is used to induce conformational transitions in biomolecules.1,2 Suppose that the molecule of interest undergoes repeated folding and unfolding transitions under constant force. The molecular extension, i.e., the end-to-end distance of the molecule, would then jump between smaller and larger values. The interpretation of the resulting time series would be simple if the molecular extension could be directly monitored experimentally. In this hypothetical case, the folding and unfolding force-dependent transition rates of the molecule could be directly obtained by counting the number of transitions per unit time. In addition, by binning this trajectory, one could determine the probability density of the extension, the logarithm of which is the free energy profile of the molecule, a procedure known as Boltzmann inversion. Alternatively, from the trajectory, one could determine the probability that a molecule with a specific extension folds before it unfolds. This quantity describes the most probable “fate” of the system at any given point of the trajectory and is known as committor, splitting probability, or pfold.3 Assuming that the dynamics is diffusive, the height and shape of the free energy barrier could be found by differentiation of the committor, a procedure known as committor inversion.4,5
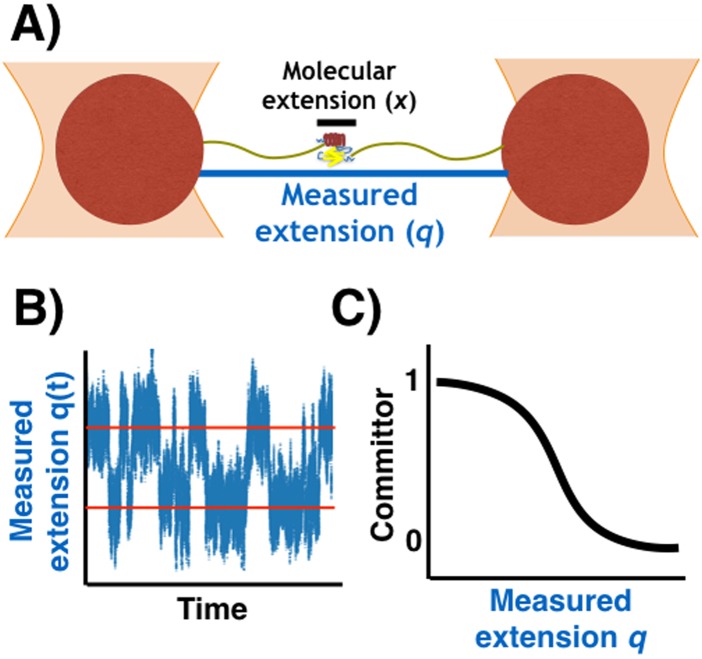
In reality, one cannot directly monitor the molecular extension itself because the experimental observable is actually the position of the force probe attached to the molecule by long polymer linkers. In the case of optical trapping measurements [Fig. 1(a)], the measured extension (q) is the extension of the molecule (x) plus that of the linkers attaching the molecule to mesoscopic beads trapped by laser beams. What one measures is the time dependence of the interbead distance, yielding a trajectory of the total extension of molecule and linkers [Fig. 1(b)]. The free energy profile obtained by Boltzmann inversion of the observed trajectory of the total extension is a convolution of the molecule and linker profiles. If the properties of the linkers are known, one can obtain the free energy profile of the molecule by deconvolution.6,7 This methodology requires large amounts of data and works best with low molecular barriers, and it can thus be challenging to use in practice.
FIG. 1.
Schematic of a single-molecule pulling experiment. (a) Example of the experimental setup in force spectroscopy using optical tweezers. A small biomolecule is attached via polymer linkers to two beads trapped by laser beams. The molecular extension x is hidden within the observed extension q. (b) Trajectory of the measured extension q(t) as a function of time. (c) The committor estimated from the observed trajectory of the measured extension q(t) in the interval between the red lines.
As a viable alternative, the group of one of us investigated the free energy profile obtained by committor inversion of the measured trajectory.5 If the dynamics of the total extension could be described as diffusion of the free energy profile obtained by Boltzmann inversion, then both the committor and Boltzmann inversion would give the same result. Consequently, one would still have to use deconvolution to obtain the molecular profile. However, unless the response of the apparatus is much faster than that of the molecule, the dynamics of the total extension cannot necessarily be described as a one-dimensional diffusive process.8 Committor inversion may, therefore, lead to a different free energy profile than Boltzmann inversion. Experimentally, committor inversion has been applied to DNA hairpin folding, successfully recovering the free energy profile obtained from deconvolution of the Boltzmann inverted one.5 It has also been used to extract free energy barriers encountered when bacteriorhodopsin is pulled out of a membrane.9 This procedure has the potential to become widely used as a viable alternative to deconvolution of the profile obtained by Boltzmann inversion. However, the range of validity of committor inversion in light of the limitations imposed by probe/linker attachments to the molecule has not been investigated.
Committor inversion yields the exact molecular free energy profile in the limit of very stiff polymer linkers (i.e., when the linker force constant is much larger than those of the molecular extrema). However, for such linkers, the free energy profile obtained from Boltzmann inversion is already quite close to the molecular one. Moreover, in this limit, the measured transition or hopping rates become proportional to the diffusion coefficient not of the molecule but of the probe (e.g., mesoscopic beads) attached to the molecule.10 Consequently, here, we shall primarily consider soft linkers for which the measured rates are meaningful. As first pointed out by Thirumalai and co-workers, free energy profiles are most easily found using stiff linkers, but reliable estimates of the hopping rates can only be made by using flexible handles.11
We will investigate whether transition path theory can aid in the reconstruction of molecular free energy profiles from the information encoded in the committor estimated from observed trajectories. This will be done in the framework of a simple model where the molecular and total extensions diffuse anisotropically on a two-dimensional free energy surface. We previously used such surfaces to determine the influence of the mesoscopic pulling device on the observed rates and transition paths.12,13 Here, we obtain the committor both by analyzing Brownian dynamics trajectories of the total extension—as in experiments—and by numerically solving the Onsager equation.3 Additionally, we derive and validate analytic expressions for the committor obtained in the high-barrier limit. We then investigate how the extracted barriers depend on the stiffness of the linker, the shape of the molecular free energy profile, and the diffusion anisotropy. We find that although in some realistic cases this procedure yields useful estimates of the heights of molecular barriers, it is challenging to establish its validity in many other cases of practical interest.
II. THEORY
Let x be the molecular (hidden) extension and q be the total (observable) extension [Fig. 1(a)]. Let a constant force be exerted on the system so that the resulting free energy surface has the form
| (1) |
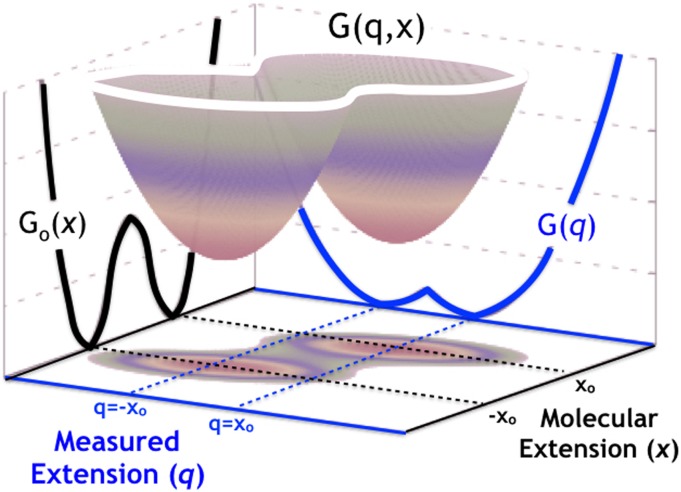
Here, the first term on the rhs is the molecular free energy in the presence of force and the second describes the coupling due to a harmonic linker with spring constant κl. For the sake of simplicity, we will assume the constant force to be subsumed in Go(x), which is symmetric about its maximum at x = 0 and has two minima, corresponding to metastable states, at x1 = −x0 and x2 = x0 (Fig. 2). It is straightforward to generalize the results presented below to an asymmetric Go(x) and to anharmonic (e.g., wormlike chain) linkers, albeit at the expense of complicating the analytical expressions.
FIG. 2.
Two-dimensional potential surface G(q, x). We assume that Go(x) (black solid line) is symmetric about its maximum at x = 0 and has minima at −x0 and x0. The potential of mean force along q, G(q), is shown as the blue solid line. The extensions are shifted by constants so that the barrier occurs at zero.
We assume that the dynamics on the surface in Eq. (1) is diffusive with position-independent diffusion coefficients Dx and Dq along the x and q coordinates, respectively. The value of Dq is essentially determined by the Stokes-Einstein diffusion coefficient of the beads in a laser tweezer experiment and for large beads may thus be slower than Dx. By simulating Brownian dynamics, one can obtain long trajectories describing the evolution of the system on the two-dimensional surface in Eq. (1). The system will spend most of the time in one of the two metastable states, rarely but rapidly jumping from one to the other. We can now mimic the typical situation of force spectroscopy experiments and assume that only the component q(t) of the simulated trajectory is observable [see Fig. 1(b) for an example trajectory]. From such trajectories, one can then calculate the “observed” committor ϕ(q) [Fig. 1(c)], defined as the probability of reaching the folded minimum before the unfolded minimum, starting from a given value of q.
Alternatively, one can obtain the exact ϕ(q) as a conditional equilibrium average of the two-dimensional committor, ϕ(q, x), which can be accurately obtained by solving the two-dimensional Onsager equation3 on a grid with the appropriate boundary conditions (see Sec. III). Specifically, the observed committor ϕ(q) is given by
| (2) |
where β = 1/kBT, kB is Boltzmann’s constant, and T is the absolute temperature. The denominator in Eq. (2) is the exponential of the negative of the free energy profile G(q) along q, given within a constant by
| (3) |
G(q) can be obtained from the observed trajectory by Boltzmann inversion. If the linker spring-constant is known, then Go(x) can, in principle, be obtained from G(q) by deconvolution,6 which amounts to a numerically challenging inverse Weierstrass transform.8
For a one-dimensional diffusive process on Go(x) with position-independent diffusion coefficient, the committor ϕo(x) is given by
| (4) |
Thus, by differentiating both sides with respect to x, one can obtain the following inversion formula:5
| (5) |
which expresses the molecular free energy profile in the interval −xo ≤ x ≤ xo in terms of the derivatives of the committor, denoted as primes. Note that ϕo(−x0) = 1 and ϕo(x0) = 0 by definition.
For multidimensional diffusive dynamics, there is no analytic relation between the free energy surface and the committor analogous to Eq. (5). Nevertheless, one can formally use this relation to define a new free energy profile GCI(q) (CI = committor inversion) using the committor ϕ(q) obtained from the experimental trajectory in the interval −xo ≤ q ≤ xo,
| (6) |
Since the dynamics along q cannot be, in general, described by one-dimensional diffusion,8,12 then in general,4 GCI(q) ≠ G(q). In other words, the committor-inverted and Boltzmann-inverted profiles are not necessarily the same. It has been conjectured5 that, in fact, GCI(q) is very similar to the hidden molecular free energy profile Go in the barrier region. This assumption does not have any obvious theoretical justification, and in the following, we will systematically explore its validity.
We shall now derive approximate analytic expressions for ϕ(q) and GCI(q) when the molecular free energy is symmetric and has a high barrier. We begin with the calculation of G(q). When the barrier of Go(x) is high, the major contribution to the integral in Eq. (3) comes when x is near to the minima of Go(x), which are located at x = ±xo. Thus, one can approximate the integral from −∞ to ∞ as a sum of two integrals, one around x1 = −xo and the other around x2 = xo. Then, we expand G(q, x) in Eq. (2) around xi (i = 1, 2) to the second order as , where the primes denote derivatives with respect to x. By extending the range of integration in both integrals to (−∞, ∞) and evaluating the resulting Gaussian integrals, we find (to within a constant)
| (7) |
where and . If we choose the constant in the definition of G(q) so that G(q = ±xo) = 0, then
| (8) |
Let us now evaluate the integral in Eq. (2) that determines ϕ(q) in an analogous way. We break the integral into two parts, one around −xo and the other around xo, and expand G(q, x) about these points to the second order as before. We then approximate the committor around −xo as ϕ(q, x) = 1 and set ϕ(q, x) = 0 in the integral around xo. Evaluating the resulting Gaussian integrals, we find that
| (9) |
for −xo ≤ q ≤ xo. This approximate expression is valid for high molecular barriers. In this regime, does not depend on the diffusion anisotropy and, more importantly, it has no direct dependence on the molecular barrier height or shape (although indirect effects from correlations between the well curvature and barrier height may occur).
Using Eqs. (9) and (6) and requiring that GCI(q = ±xo) = 0, we find that
| (10) |
which using Eq. (8) for G(q) can be rewritten as
| (11) |
These approximate expressions are valid for sufficiently large molecular barriers. In this regime, GCI(q) contains no explicit information about the molecular barrier height and shape, as determined by G0(x).
III. METHODS
A. Free energy surfaces
We model force spectroscopy experiments at constant force as a diffusive process on the two-dimensional free energy surface G(q, x), given by Eq. (1) [Fig. 2], where q and x are the total and molecular extension, respectively, Go(x) is the molecular free energy in the presence of force, and κl is the linker stiffness. We used two analytic forms of the molecular free energy. A symmetric potential is given by a bistable matched-harmonic with , where
| (12) |
and and x‡ are the activation barrier and the distance to the transition state, respectively, in the presence of force. An asymmetric potential is given by the negative logarithm of a linear combination of two Gaussian distributions,
| (13) |
where s1, s2, and ±x0 are the Gaussian widths and centers, respectively. In particular, we considered a potential displaying a small barrier by using s1 = 0.15, s2 = 1, and = 0.4 and a potential displaying a larger barrier by using s1 = 0.2, s2 = 0.6, and = 0.5. In both cases, the minima are located at ±x0, with x0 = 1.5.
B. Two-dimensional committor using the Onsager equation
The Onsager equation3 for a n-dimensional diffusive process z is
| (14) |
where is a position-dependent diffusion tensor. If we assume a two-dimensional diffusion on the free energy surface , with a diagonal and position-independent diffusion tensor, then the Onsager equation becomes
| (15) |
After discretizing this equation, an iterative relaxation method can provide an accurate numerical solution . We thus consider a mesh on the plane such that both continuous variables take N + 1 and M + 1 discrete values, respectively, qi ≡ iΔq and xj ≡ jΔx, with and . We evaluate the committor on the mesh, , by solving the (central) finite difference version of Eq. (15),
| (16) |
where ∂qβGij and ∂xβGij are the gradients of the potential evaluated on the mesh. We set boundary conditions ϕij = 1 for all points (q < −x0, x < −x0) and ϕij = 0 for all points (q > x0, x > x0). This definition of the boundaries assumes that an experienced practitioner will be able to separate true transitions from mere recrossing events by looking at the entire trajectory. Additionally, we set reflective boundary conditions on all remaining points on the border of the mesh, i.e., ϕi,j = ϕi+1,j for i = 0 or i = N − 1 and ϕi,j = ϕi,j+1 for j = 0 or j = M − 1. We then solve Eq. (16) iteratively by initially setting all ϕi,j on the rhs of the equation inside the boundaries equal to 1/2. Figure 3(a) shows an example of the numerical solution ϕ(q, x) of Eq. (16).
FIG. 3.
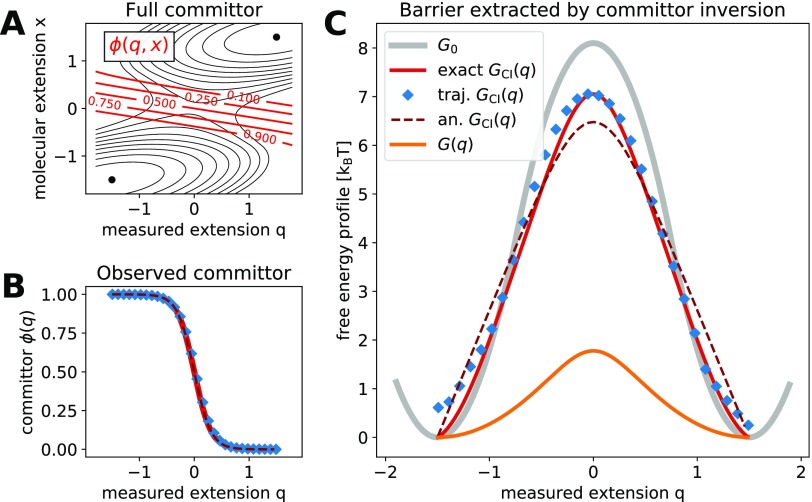
Molecular free energy profile from committor inversion. (a) Full two-dimensional committor for the free energy surface G(q, x) and Dq/Dx = 1. Isolines of the free energy surface are shown as black solid lines separated by 1 kBT. Isolines of the committor are shown as red solid lines. (b) The observed committor ϕ(q) is obtained in two independent ways: from a numerical solution of Onsager’s equation (exact, red solid line) and from Brownian dynamics trajectories (blue diamonds). The analytic prediction from Eq. (9) is shown as a dark red dashed line. (c) The free energy barrier extracted by committor inversion, GCI(q), from the exact and trajectory-estimated committor (red solid line and blue diamonds, respectively). Both barriers are compared to the hidden molecular profile Go (gray solid line), to the analytic prediction from Eq. (11) (dark red dashed line), and to the Boltzmann-inverted free energy profile G(q) (orange solid line). The free energy surface G(q, x) has parameters similar to those obtained for the 20TS06/T4 DNA hairpin,19 , Δx‡ = 1.5 [x], and κl = 2.6 kBT/[q]2, where [q] = [x] denotes units of length for the extension.
C. Brownian dynamics simulations
We generated trajectories along q and x using
| (17) |
where Rq(t), Rx(t) are independent Gaussian random numbers with zero mean and unit variance, respectively, and Δt is the time step. The diffusion coefficient Dx of the molecule is kept constant, and that of the apparatus Dq is varied such that Dq/Dx ranges from 10 to 10−2. We chose the time step such that DxΔt = 5 × 10⁻⁴. Figure 1(b) shows an example of the measured extension as a function of time.
D. Estimating the committor from diffusive trajectories
To calculate the committor directly from a trajectory, we followed the procedure described by Chodera and Pande.4 For a trajectory of duration τ, the committor is estimated by
| (18) |
where the hitting function c(t) keeps track of whether q(t) hits the folded state before the unfolded one immediately following time t and assumes a value of unity if so, and zero otherwise. This implies that c(t) uses q only and does not make use of any indirect information about the hidden variable x. In practice, we discretized the trajectory in space and time and considered the resulting discrete chain , where k = 0, …, N is the time index and j = 0, …, M labels the bins along the extension q. The discretized committor estimated from the trajectory is, therefore, given by
| (19) |
where δij is the Kronecker delta. Thus, for each bin i (along q), ϕtraj(i) is the ratio between the population committed to the folded state and the total population. In order to calculate GCI(q) with Eq. (6), we discretized the observed trajectory in 30 bins between q = −x0 and q = x0, numerically evaluated the gradient, and smoothened it with a Savitzky–Golay filter.
E. Code
We generated, analyzed, and visualized data with custom code based on Numpy,14 Scipy,15 Ipython,16 Numba,17 and Matplotlib.18
IV. RESULTS AND DISCUSSION
We first verified that the observed committor ϕ(q) is an equilibrium conditional average of the full two-dimensional committor . In order to model a typical force spectroscopy experiment, we performed Brownian dynamics simulations on the two-dimensional potential G(x, q) with Dq/Dx = 1 [see Eq. (2)]. For , we used the matched-harmonic potential of Eq. (12) and parameters similar to those experimentally obtained for the 20TS06/T4 DNA hairpin.19 We estimated the observed committor by using Eq. (19) from the Brownian dynamics trajectories, which contained 54 transitions between the minima q = −xo and q = xo. Following a completely independent route, we calculated ϕ(q, x) by numerically solving the Onsager equation [Eqs. (15) and (16), Fig. 3(a)] and obtained ϕ(q) as the conditional average in Eq. (2). Figure 3(b) shows these two independent ways to estimate ϕ(q) and compares them to the analytic prediction from Eq. (9) (dashed line). We find that the results from the Brownian dynamics simulations, accurate numerical calculations, and the analytic prediction are in excellent agreement.
We used Eq. (6) to invert the mean committor ϕ(q) and extracted a free energy profile GCI(q), both from the accurate numerical solution and the one estimated from simulated trajectories. Figure 3(c) reports the results for the 20TS06/T4 DNA hairpin parameters and shows a good agreement between the two independent ways for extracting GCI(q). We compared these results to the potential obtained from Boltzmann inversion G(q) without deconvolution (orange solid line). As reported in Ref. 5, the Boltzmann profile has a much lower barrier and the two profiles differ significantly. This difference indicates that the dynamics along the observed extension q cannot be described as one-dimensional diffusion on G(q).4,8 Interestingly, GCI(q) is very similar to the hidden molecular profile Go (gray solid line) and the values of their barriers differ only by approximately 10%, consistent with the results found in Ref. 5. However, Fig. 3(c) also shows that is in good agreement with the analytic approximation from Eq. (11) (red dashed line). As shown in Eq. (11), the analytic expression does not explicitly depend on Go(x) but only on G(q) and the stiffnesses of the molecule and linker. This raises the possibility that the agreement is fortuitous, which motivated us to further assess the validity of the committor inversion to extract the hidden molecular profile for a large number of scenarios.
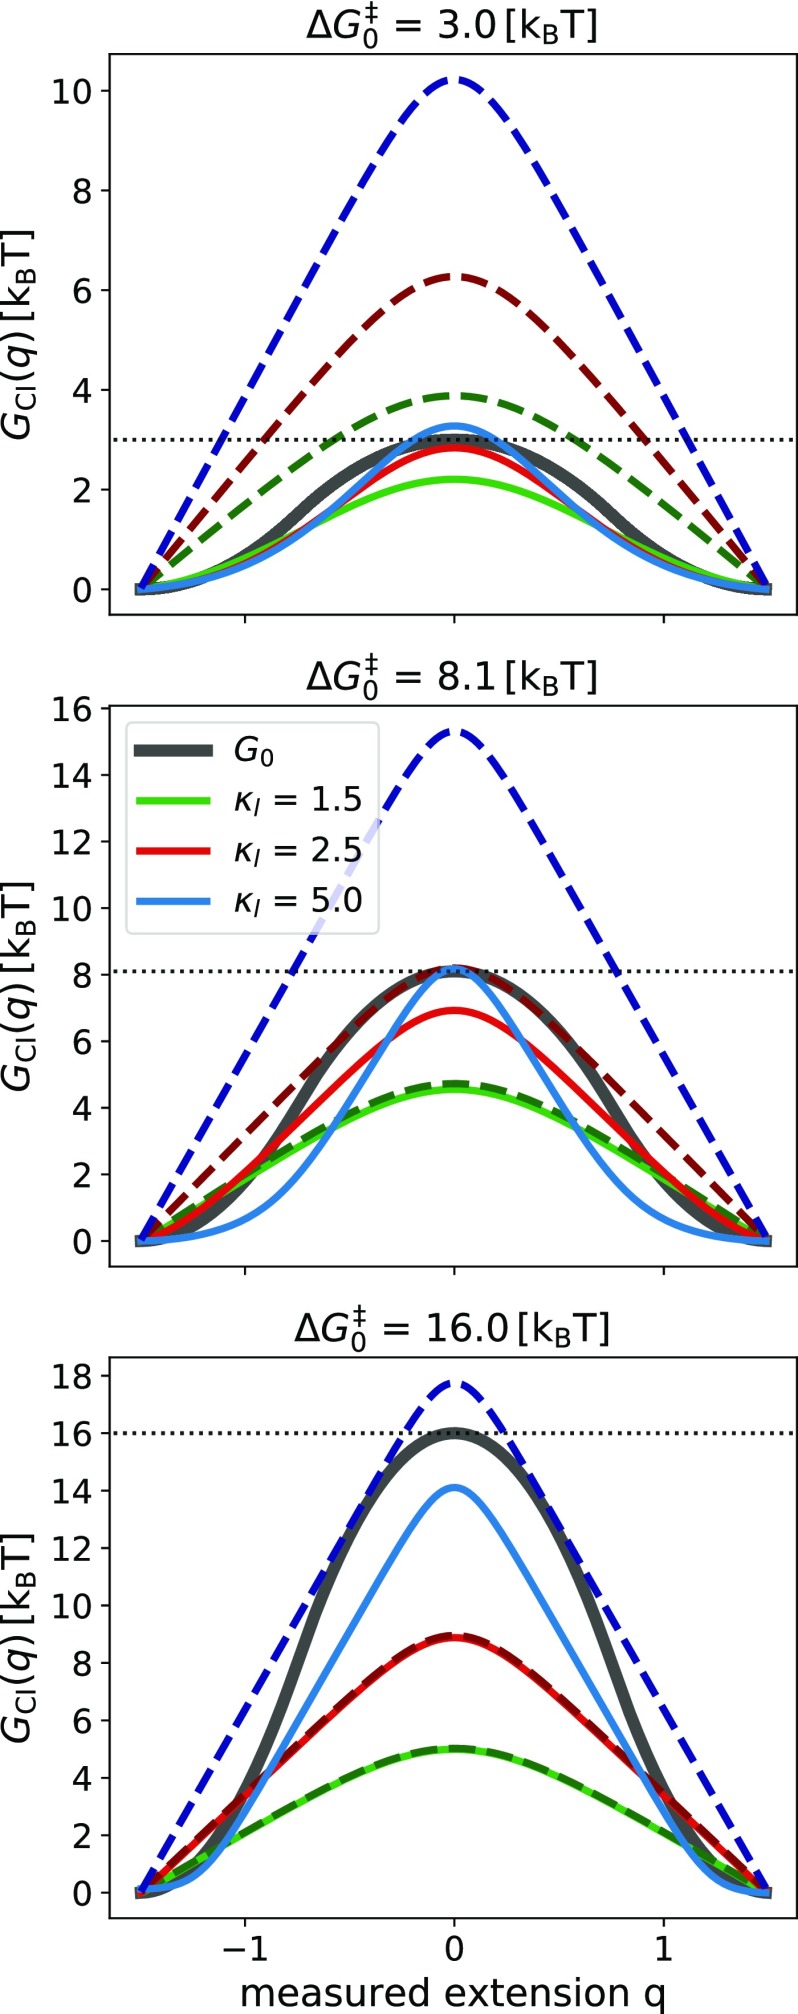
We investigated how well the free energy profile obtained by inversion of the observed committor, GCI(q), reproduces the hidden molecular profile, Go, for a number of cases of practical interest. Having shown that the observed committor is accurately reproduced by numerical solutions of Onsager’s equation, we used the latter to systematically investigate the influence of parameters of our model. In Fig. 4, we report the dependence of the exact GCI(q) on the linker stiffness (solid lines) and on the height of the hidden molecular barrier. The results show that the accuracy of predicting G0 depends on all the examined parameters. For instance, using the linker stiffness κl = 1.5 kBT/[q]2, where [x] = [q] indicates the units of extension, guarantees acceptable results for but works rather poorly for larger barriers, as can be seen for . For , only a very stiff linker gives an acceptable reconstruction.
FIG. 4.
Free energy barrier extracted by committor inversion, GCI(q), using the observed committor (solid lines) and the analytic approximation of Eq. (11) (dashed lines and darker shade of color). We varied the height of the hidden molecular barrier (, 8.1, and 16 kBT, from top to bottom) and the linker stiffness (κl = 1.5, 2.5, and 5 kBT/[q]2, green, red, and blue lines, respectively). We used the matched-harmonic free energy function from Eq. (12) with Δx‡ = 1.5 [x]. For reference, each panel shows the respective hidden molecular profile Go (gray solid line).
We tested the validity of the analytic approximation [Eq. (11)] (dashed lines in Fig. 4). We found that Eq. (11) reproduces accurately the exact solutions for sufficiently large molecular barriers (≥5 kBT) and for soft linkers. The lowest barrier considered, 3 kBT, is outside the range where the analytic approximation can be applied with confidence. Since the analytic formula does not contain explicit information about the hidden molecular profile (only information about the potential wells), whenever this approximation accurately reproduces GCI(q) the reconstruction of Go by committor inversion is likely to be invalid. Notably, in these cases, the barrier height obtained by committor inversion is systematically lower than the molecular barrier.
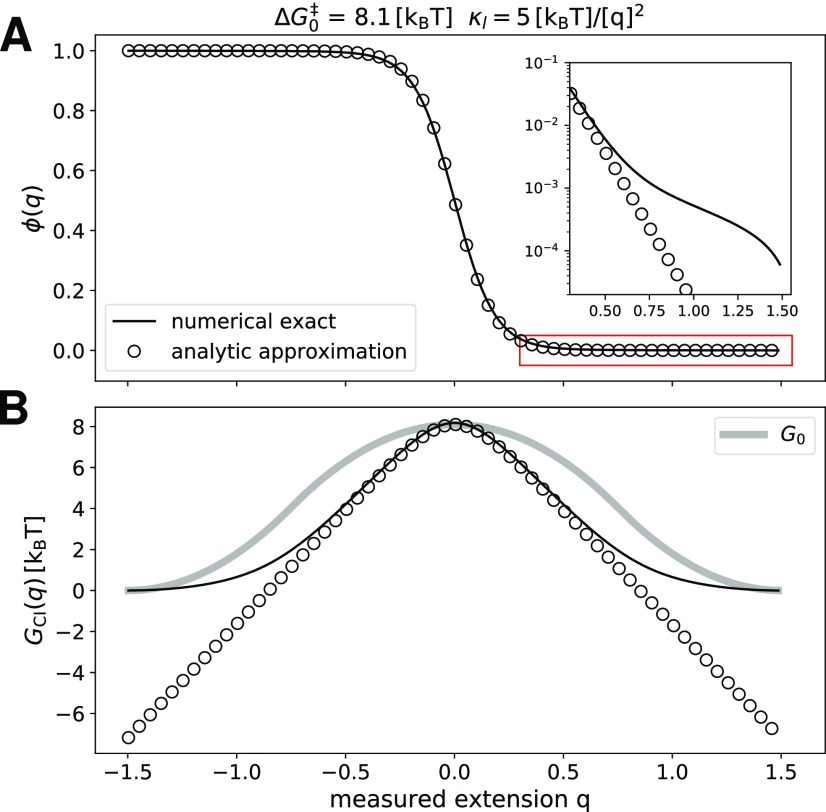
We then investigated the cases in which the analytic approximation does not correctly reproduce the free energy profile obtained by the exact numerical solution of the committor inversion, even when the barrier seems sufficiently high. This can be seen, for instance, in Fig. 4 for and κl = 5 kBT/[q]2. We compared the exact ϕ(q) to the analytic prediction from Eq. (9) (Fig. 5). These two quantities are in striking agreement over most of the reaction coordinate range and deviate only close to the minima by exponentially small amounts, which causes the slopes, ϕ′(q), of the two curves to be different [Fig. 5(a), inset]. These differences in ϕ′(q) are amplified by the logarithm in Eq. (6), causing large errors in the inverted free energy barrier GCI(q) at the well bottom [Fig. 5(b)] that lead to systematic underestimation of the barrier height. In fact, Eq. (9) accurately reproduces the exact GCI(q) around the top of the barrier but poorly describes how GCI(q) approaches its minima. Figure 5 indicates that the mean committor close to the stable states encodes crucial information about the height of the extracted barrier and must be estimated with very high precision. This requirement poses a major challenge for practical attempts to reconstruct barriers by committor inversion.
FIG. 5.
(a) Observed committor ϕ(q) and (b) barrier GCI(q) obtained by committor inversion for the exact numerical solution (solid line) and the analytic approximation of Eq. (11) (empty circles—to highlight agreement with exact solution). We used parameters and κl = 5 kBT/[q]2. The inset is the zoomed-in view of ϕ(q) in the range highlighted by the red square box. For reference, Go is shown in Fig. 5(b) as a gray solid line. All curves in Fig. 5(b) are aligned on the barrier top. A seemingly insignificant difference in the committors shown in Fig. 5(a) leads to an overestimation of the barrier height by a factor of 2.
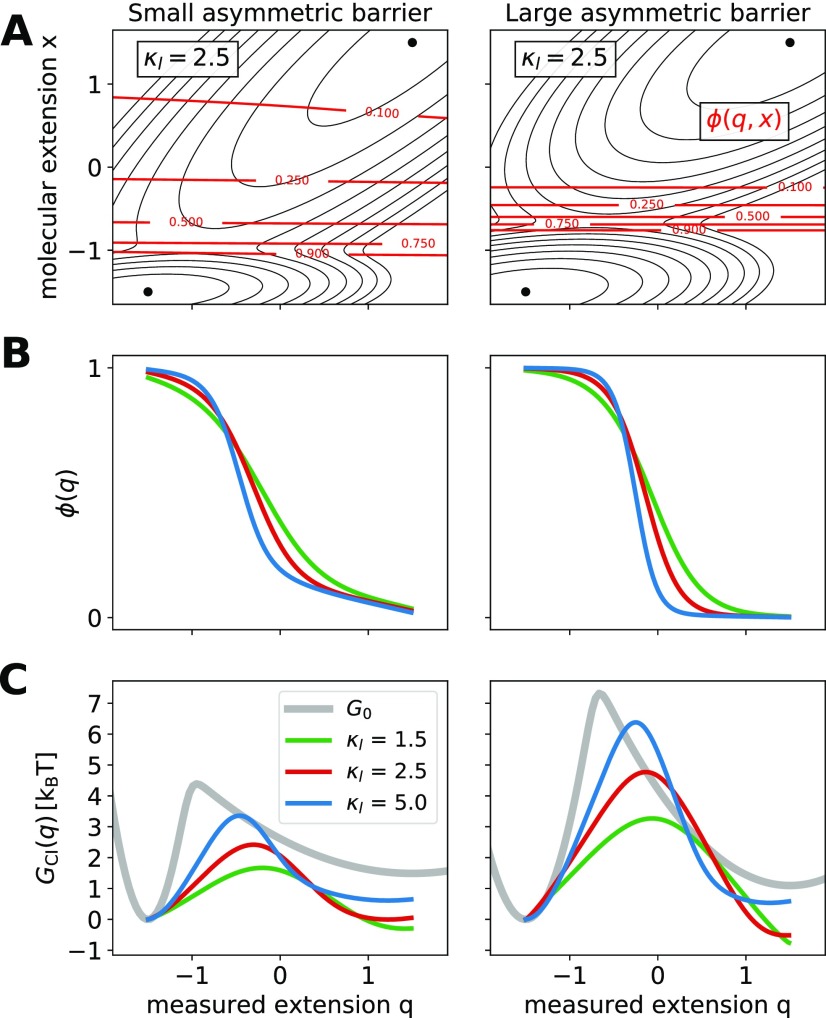
We also investigated how well committor inversion allows one to estimate the shape of the hidden molecular barrier for asymmetric molecular energy profiles. In Fig. 6(a), we show the two-dimensional free energy surface G(q, x) and two-dimensional committor for small (left) and large (right) asymmetric barriers. On both free energy surfaces, the well to the left of the barrier is narrower and deeper than that to the right of the barrier. The asymmetry of the barrier is reflected in the full two-dimensional committor. In fact, the committor isoline of 0.5 is not located at the barrier-top but displaced toward the shallower state, whereas points on the top of the barrier are actually highly committed. ϕ(q) obtained by solving Onsager’s equation and the profiles extracted by committor inversion are shown in Figs. 6(b) and 6(c), respectively, for different linker stiffnesses. The comparison to the hidden molecular free energy (gray line) shows that the asymmetry of the molecular free energy can be captured only qualitatively under the conditions used here. Indeed, the accuracy in determining both the location of the barrier top and the relative stability of the two states depends on the stiffness of the linker and improves with increasingly stiffer linkers. For low linker stiffness, the barrier from committor inversion is systematically lower and closer to q = 0 than in .
FIG. 6.
Asymmetric molecular barriers and free energy profiles extracted by committor inversion. (a) Full two-dimensional committor for the free energy surfaces G(q, x) with an asymmetric molecular free energy [Eq. (13)], κl = 2.5 kBT/[q]2, and Dq/Dx = 1. Isolines of the free energy surfaces are shown as black solid lines separated by 1 kBT. Isolines of the committor are shown as red solid lines. We considered free energy surfaces with a small and a large barrier, left and right, respectively. (b) The observed committor ϕ(q) is obtained by numerically solving Onsager’s equation. ϕ(q) is shown for different linker stiffnesses (1.5, 2.5, and 5.0 kBT/[q]2). (c) Free energy profiles GCI(q) extracted by committor inversion. The respective hidden molecular profiles are shown as gray solid lines.
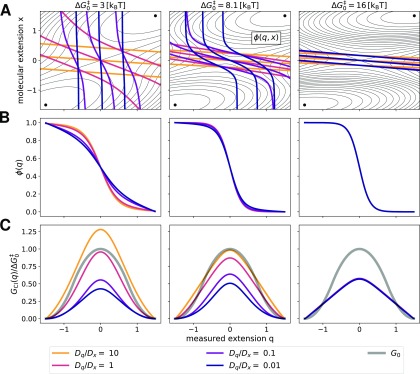
Finally, we studied the effects of diffusion anisotropy on , ϕ(q), and GCI(q) by numerically obtaining the solutions of Eq. (15) as a function of the ratio Dq/Dx over four orders of magnitude using different molecular barrier heights (Fig. 7). For small molecular barriers, reducing Dq (corresponding to slower diffusion of the force probe attached to the molecule) induces a “rotation” of the full committor around the barrier [Fig. 7(a)]. For Dq/Dx = 10, the isolines of the committor are almost parallel to the q-axis, indicating transitions that are dominated by the dynamics along x [Fig. 7(a), orange lines]. As Dq decreases, the isolines rotate, until they are perpendicular to the q-axis for very small Dq, indicating that transitions are dominated by the much slower dynamics along q (blue lines). This phenomenon is most clearly observed for . For , larger values of diffusion anisotropy are required to induce rotations of the isolines of the full committor, which are mostly suppressed on the barrier. For the largest barrier, , diffusion anisotropy has no sizable effect on the committor, which is completely determined by the free energy surface.
FIG. 7.
Effect of diffusion anisotropy on committors and free energy barriers extracted by committor inversion. (a) Free energy surfaces and corresponding full committor calculated for different diffusion anisotropies Dq/Dx and increasing values of the molecular barrier height ( 3, 8.1, and 16 kBT, from left to right) with κl = 2.6 kBT/[q]2 in each case. Isolines of the free energy surfaces are shown as black solid lines separated by 1 kBT. Isolines of the committor corresponding to 0.2, 0.5, and 0.8 (from top-right to bottom-left) are shown as colored solid lines. (b) Corresponding observed committor as a function of diffusion anisotropy Dq/Dx. (c) Barrier GCI(q) obtained by inversion of the observed committors shown in (b). The hidden molecular barrier G0 is reported as a gray solid line. In each panel of (c), free energies are measured in units of the corresponding value of . Color code for diffusion anisotropy Dq/Dx: 10 orange, 1 red, 0.1 purple, and 0.01 blue. In the rightmost panel, the curves for GCI(q) are superimposed.
Consequently, diffusion anisotropy has a significant impact on ϕ(q) and GCI(q) for low and medium barrier heights, but no effect for very large ones. For such high barriers, the 2-dimensional committor function depends only weakly on diffusion anisotropy because crossing the barrier effectively commits trajectories. For decreasing values of Dq/Dx, the barrier reconstructed by committor inversion tends to increasingly underestimate the hidden molecular barrier . We note, however, that the relevant parameters are constrained by the molecular system and the experimental apparatus. This represents a further challenge for practical applications of the committor inversion method to experiments, since the probe diffusion may well be much slower than the molecular diffusion (depending on the molecule being studied and the design of the probe). As shown already in Fig. 5, small variations in the observed committor arising from diffusion anisotropy can have dramatic effects on the barrier height estimated by inversion [Figs. 7(b) and 7(c), middle panel].
V. CONCLUDING REMARKS
We have assessed the validity of committor inversion to extract molecular free energy profiles from single-molecule force spectroscopy experiments. Within the framework of a two-dimensional model for the coupled dynamics of the molecular and measured extensions, we obtained approximate analytic expressions for the measured committor and the extracted free energy profile from its inversion. We compared these analytic results with those obtained from Brownian dynamics simulations and accurate numerical solutions of the Onsager equation for various linker stiffness values and molecular barrier heights. We found that for isotropic diffusion, the committor inversion gives reasonable results for small and medium-high barriers and that the accuracy depends on the stiffness of the linker. When the apparatus diffuses much more slowly than the molecule, or when the barrier is high, the reconstruction is far less accurate. We have also shown that due to the logarithms in the inversion formula, even exponentially small inaccuracies in the observed committor lead to large errors in the barrier height of the reconstructed molecular free energy profile. This may represent a serious challenge for practical applications of the committor inversion approach. Although in some situations molecular free energy profiles estimated by committor inversion from single-molecule experiments can be informative, systematically ascertaining their validity is challenging and they should, in general, be regarded with caution.
ACKNOWLEDGMENTS
R.C., G.H., and P.C. acknowledge the support of the Max Planck Society. P.C. was also supported by Colciencias, University of Antioquia, and Ruta N, Colombia. A.S. was supported by the Intramural Research Program of the National Institute of Diabetes and Digestive and Kidney Diseases of the National Institutes of Health. M.T.W. acknowledges support from the John Simon Guggenheim Foundation. The authors acknowledge Dr. John Chodera for useful discussion.
Note: This paper is part of the JCP Emerging Investigators Special Collection.
Contributor Information
Roberto Covino, Email: .
Pilar Cossio, Email: .
REFERENCES
- 1.Greenleaf W. J., Woodside M. T., and Block S. M., Annu. Rev. Biophys. Biomol. Struct. 36, 171 (2007). 10.1146/annurev.biophys.36.101106.101451 [DOI] [PMC free article] [PubMed] [Google Scholar]
- 2.Neuman K. C. and Nagy A., Nat. Methods 5, 491 (2008). 10.1038/nmeth.1218 [DOI] [PMC free article] [PubMed] [Google Scholar]
- 3.Onsager L., Phys. Rev. 54, 554 (1938). 10.1103/PhysRev.54.554 [DOI] [Google Scholar]
- 4.Chodera J. D. and Pande V. S., Phys. Rev. Lett. 107, 098102 (2011). 10.1103/PhysRevLett.107.098102 [DOI] [PMC free article] [PubMed] [Google Scholar]
- 5.Manuel A. P., Lambert J., and Woodside M. T., Proc. Natl. Acad. Sci. U. S. A. 112, 7183 (2015). 10.1073/pnas.1419490112 [DOI] [PMC free article] [PubMed] [Google Scholar]
- 6.Woodside M. T., Anthony P. C., Behnke-Parks W. M., Larizadeh K., Herschlag D., and Block S. M., Science 314, 1001 (2006). 10.1126/science.1133601 [DOI] [PMC free article] [PubMed] [Google Scholar]
- 7.Hinczewski M., von Hansen Y., and Netz R. R., Proc. Natl. Acad. Sci. U. S. A. 107, 21493 (2010). 10.1073/pnas.1010476107 [DOI] [PMC free article] [PubMed] [Google Scholar]
- 8.Hummer G. and Szabo A., Proc. Natl. Acad. Sci. U. S. A. 107, 21441 (2010). 10.1073/pnas.1015661107 [DOI] [PMC free article] [PubMed] [Google Scholar]
- 9.Yu H., Siewny M. G. W., Edwards D. T., Sanders A. W., and Perkins T. T., Science 355, 945 (2017). 10.1126/science.aah7124 [DOI] [PMC free article] [PubMed] [Google Scholar]
- 10.Makarov D. E., J. Chem. Phys. 141, 241103 (2014). 10.1063/1.4904895 [DOI] [PubMed] [Google Scholar]
- 11.Hyeon C., Morrison G., and Thirumalai D., Proc. Natl. Acad. Sci. U. S. A. 105, 9604 (2008). 10.1073/pnas.0802484105 [DOI] [PMC free article] [PubMed] [Google Scholar]
- 12.Cossio P., Hummer G., and Szabo A., Proc. Natl. Acad. Sci. U. S. A. 112, 14248 (2015). 10.1073/pnas.1519633112 [DOI] [PMC free article] [PubMed] [Google Scholar]
- 13.Cossio P., Hummer G., and Szabo A., J. Chem. Phys. 148, 123309 (2018). 10.1063/1.5004767 [DOI] [PMC free article] [PubMed] [Google Scholar]
- 14.Oliphant T. E., Guide to NumPy, 2nd ed. (Create Space Independent Publishing Platform, USA, 2015), ISBN: 151730007X; 9781517300074. [Google Scholar]
- 15.Jones E., Oliphant T., Peterson P. et al. , SciPy: Open source scientific tools for Python, URL: http://www.scipy.org/.
- 16.Perez F. and Granger B. E., Comput. Sci. Eng. 9, 21 (2007). 10.1109/mcse.2007.53 [DOI] [Google Scholar]
- 17.Lam S. K., Pitrou A., and Seibert S., in Proceedings of Second Workshop on the LLVM Compiler Infrastructure HPC–LLVM’15 (ACM Press, New York, New York, USA, 2015), pp. 1–6, ISBN: 9781450340052. [Google Scholar]
- 18.Hunter J. D., Comput. Sci. Eng. 9, 90 (2007). 10.1109/mcse.2007.55 [DOI] [Google Scholar]
- 19.Neupane K. and Woodside M. T., Biophys. J. 111, 283 (2016). 10.1016/j.bpj.2016.06.011 [DOI] [PMC free article] [PubMed] [Google Scholar]


