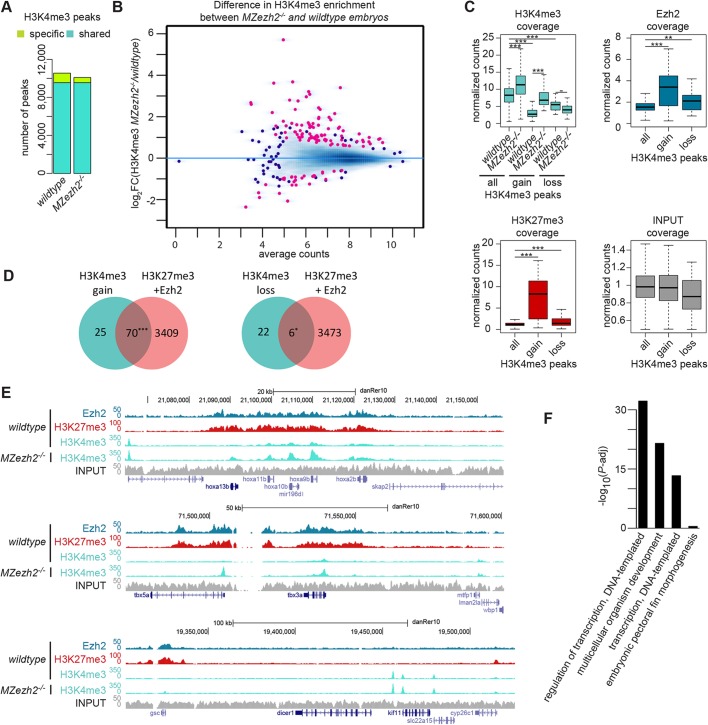
Fig. 2.
MZezh2 mutant (MZezh2−/−) embryos show an increase in H3K4me3 preferentially on H3K27me3 targets. (A) Number of peaks called after H3K4me3 ChIP-seq in wild-type and MZezh2 mutant (MZezh2−/−) embryos at 24 hpf. Turquoise and green represent peaks shared by the two conditions and peaks specific for one condition, respectively. Each peak set was obtained by the intersection of three independent biological replicates. (B) MA plot showing the fold change (log2-transformed) in H3K4me3 peak coverages in 24 hpf MZezh2−/− and wild-type embryos as a function of the normalized average count between the two conditions (log10-transformed) as calculated using DiffBind on the union of H3K4me3 peaks detected in both wild-type and MZezh2 mutant conditions. Red, log2FC≥1 or ≤−1 and P-adj<0.05; blue, P-adj≥0.05. When dot concentration is too high, dots are replaced by density for better visualization. (C) Box plots of subsampled counts after ChIP-seq for H3K4me3 in wild-type and MZezh2−/− embryos and for Ezh2 and H3K27me3 in wild-type embryos at 24 hpf. Box plots display union of all H3K4me3 peaks detected in MZezh2−/− or wild-type embryos (all) and H3K4me3 peaks enriched (gain) or decreased (loss) in MZezh2−/− embryos compared with wild type as detected by DiffBind. Coverages are average of normalized counts between the triplicates for H3K4me3 and duplicates for Ezh2 and H3K27me3. The input track obtained from 24 hpf wild-type embryos was used as a control. ***P<0.001, **P<0.01 (one-way ANOVA with post-hoc tests). The box represents the first quartile, median and third quartile. The whiskers below and above the box represent the minimum and maximum values. (D) Venn diagrams presenting the overlap between peaks with increased or decreased H3K4me3 levels (gain or loss), as detected by DiffBind with the presence of Ezh2 or H3K27me3 peaks within a ±1 kb window. ***P<0.001, *P<0.05 (χ2 test). (E) UCSC browser snapshots of three genomic loci in wild-type and MZezh2−/− embryos at 24 hpf. In C and E, blue, red, turquoise and gray represent ChIP-seq for Ezh2, H3K27me3, H3K4me3 and input control, respectively. (F) Gene ontology analysis of the closest genes restricted to two regions 2 kb upstream or downstream from H3K4me3 peaks enriched in MZezh2−/−.

