Fig. 3.
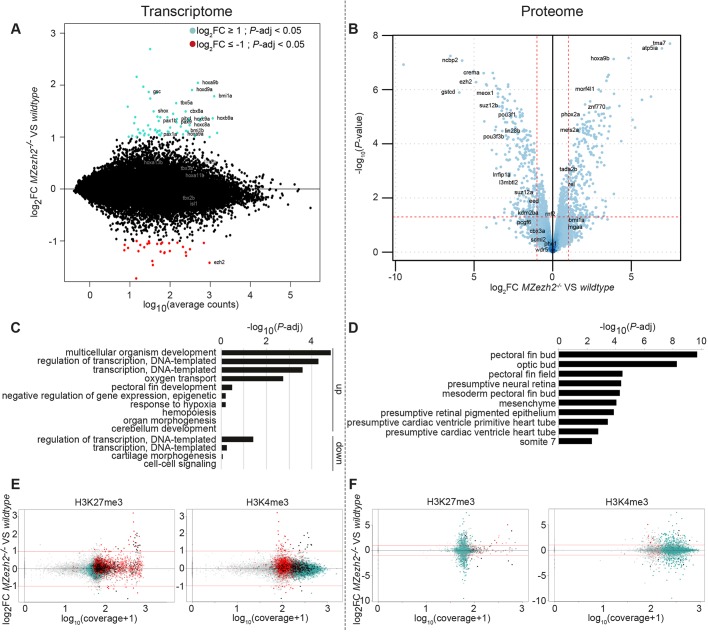
Loss of maternal zygotic ezh2 results in overexpression of specific developmental genes. (A) MA plot showing the fold change (log2-transformed) between gene expression in 24 hpf MZezh2 mutant (MZezh2−/−) and wild-type embryos as a function of the normalized average count between the two conditions (log10-transformed), as calculated with DEseq2. Log2FC≥1 and P-adj<0.05, turquoise; log2FC≤−1 and P-adj<0.05, red. For wild-type and MZezh2−/− embryos, six and seven biological replicates were used, respectively. (B) Volcano plot showing the P-value (-log10-transformed) as a function of the fold-change (log2-transformed) between protein expression level in MZezh2−/− compared with wild-type embryos at 24 hpf. Data were obtained from biological triplicates for each condition. (C) Gene ontology of biological processes associated with genes upregulated (up) or downregulated (down) in MZezh2−/− embryos compared with wild-type embryos at 24 hpf. (D) Analysis of anatomical terms associated with proteins upregulated and downregulated in MZezh2−/− embryos compared with wild-type embryos at 24 hpf. (E,F) Dot plots showing the fold change (log2-transformed) between gene expression in 24 hpf MZezh2−/− and wild-type embryos detected by RNA-seq (E) or proteome analysis (F) as a function of the H3K27me3 (left panel) or H3K4me3 (right panel) coverage [log10(coverage+1) transformed]. Red, turquoise, black and gray dots represent genes associated with MACS2-detected peaks for H3K27me3, H3K4me3, both marks or none, respectively.

