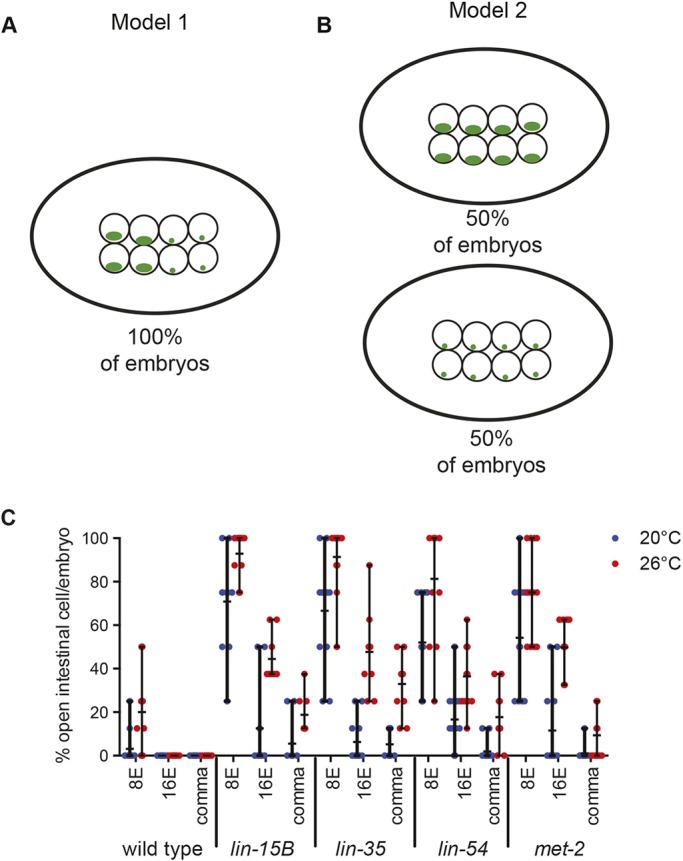
Fig. 3.

The number of intestinal cells with open chromatin varies within a single nucleus. (A,B) Models that explain a variance in compaction of intestinal cells within an embryo (A) or a variance in compaction of intestinal cells between different embryos (B). Green represents LacO::GFP bound to extra-chromomal arrays. (C) The percentage of intestinal cells with an array in an open configuration per embryo was determined for 8E-, 16E- and comma-stage embryos at 20°C and 26°C. Each dot represents an embryo and the horizontal black line represents the mean percentage of open cells per embryo. Vertical black line indicates the range.
