Abstract
Introduction
Prediabetes (preDM) is a state of disordered glucose metabolism rather than a distinctive clinical entity representing an interim condition and a risk factor for the development of diabetes. Diagnosis of asymptomatic people to assess the risk for development of DM should be done in overweight or obese adults (BMI ≥ 25 kg/m2) of any age along with person having one or more additional risk factors like physical inactivity, first degree relative with DM, high risk race/ethnicity, hypertension etc.
Objectives
To correlate glycated hemoglobin (HbA1c) levels with body mass index (BMI) and waist hip ratio (WHR) in prediabetic patients.
Materials & methods
The present case control study was performed at Pt. B. D. Sharma PGIMS, Rohtak includes thirty prediabetic patients of age group 20-40 years diagnosed on the basis of HbA1c (5.7-6.4%). Thirty healthy and age matched control were taken. After taking written consent, they were subjected to physical examination and anthropometric measurements as per protocol and findings were noted. Venous blood sample was withdrawn for estimation of HbA1c levels.
Results
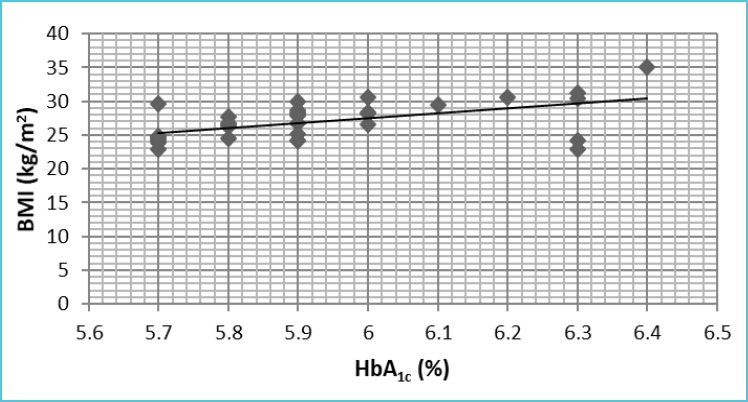
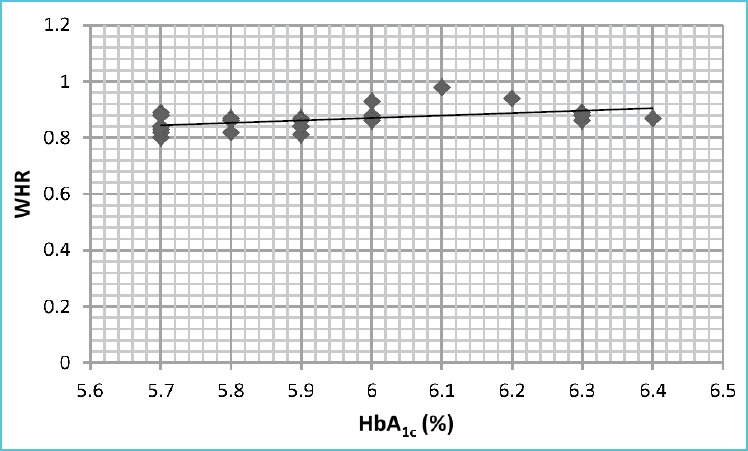
The correlation coefficient between BMI (27.01 ± 2.91 kg/m2) and HbA1c (5.94 ± 0.21%) is r = 0.583 with p value = 0.001 and between WHR (0.87 ± 0.38) & HbA1c is r = 0.495 with p value = 0.005. Both BMI & WHR are positively correlated with HbA1c.
Conclusion
Obesity is a risk factor for glycation of hemoglobin & hence, it is an effective measure for prevention of prediabetes and diabetes.
Key words: prediabetes, body mass index, waist hip ratio, HbA1c
INTRODUCTION
Prediabetes (preDM) is a stage of disordered glucose metabolism rather than a distinct clinical entity and a risk factor for the development of diabetes along with an increase in cardiovascular and microvascular complications. The transition from preDM to diabetes may take years but may also be rapid. It is estimated that most individuals (up to 70%) with preDM eventually develop diabetes. The incidence is highest in individuals with combined impaired fasting glucose (IFG) & impaired glucose tolerance (IGT) and similar in those with isolated IFG (i-IFG) or isolated IGT (i-IGT) [1].
BMI ≥ 25 kg/m2 is a major risk factor for development of prediabetes along with other risk factors like physical inactivity, first degree relative with DM, high risk race/ethnicity, women who delivered a baby weighing 9 lb or diagnosed with gestational DM, hypertension (HTN), HDL cholesterol (HDL-C) level of 35 mg/dL and a triglyceride (TG) level of 250 mg/dL, women with polycystic ovarian syndrome (PCOS), etc [2].
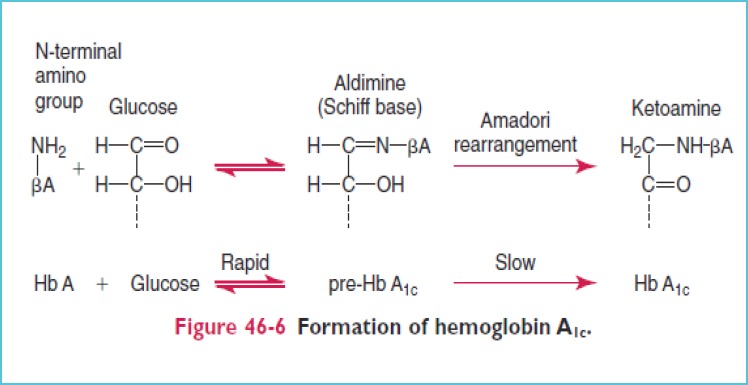
HbA1c results from the nonenzymatic, irreversible concentration dependent covalent bonding of glucose to hemoglobin within the erythrocytes. Glycation occurs in a two step Maillard reaction. It involves the initial formation of a labile Schiff base which undergoes a subsequent Amadori rearrangement leading to formation of an Amadori product i.e., HbA1c. Driven by the nucleophilic nature of the NH2-terminal, amino group of hemoglobin condenses with glucose found in the erythrocyte. The cumulative amount of HbA1c in an erythrocyte is directly proportional to the time dependant concentration of glucose within the erythrocyte [3,4] (Figure 1).
Figure 1.

Formation of HbA1c [5]
The concentration of HbA1c correlates with the average blood glucose levels over the preceding three months. As a consequence of relationship between glycemia and HbA1c, it is clear that there is a significant association between HbA1c and various clinical outcomes. Moreover, HbA1c is related to the risk of microvascular (in both type 1 and type 2 diabetes) as well as macro-vascular (in type 1 diabetes) complications [6].
Thus, it is concluded that development of preDM is linked to environmental factors such as physical inactivity but the subsequent development of diabetes is affected by combination of genetic and environmental factors. Therefore efforts to prevent diabetes should be initiated prior to the development of preDM in order to obtain the maximum benefit [7].
MATERIALS & METHODS
The present study was conducted in the Department of Biochemistry, in collaboration with the Department of Medicine, Pt. B. D. Sharma PGIMS, Rohtak.
In the present study, 30 prediabetic patients diagnosed on the basis of HbA1c levels were enrolled as cases. 30 healthy- and age-matched individuals were enrolled as controls.
Inclusion criteria
Patients of age group between 20-40 years satisfying the criteria of prediabetes based on HbA1c were included in the study.
Criteria of prediabetes according to ADA is [8]
Impaired fasting glucose (IFG) with fasting plasma glucose levels of 100 to 125 mg/dL (5.6 to 6.9 mmol/L).
Impaired glucose tolerance (IGT) with plasma glucose levels of 140 to 199 mg/dL (7.8 to 11.0 mmol/L) 2-hour postprandial.
HbA1c of 5.7 to 6.4%.
Exclusion criteria
Patients with hemoglobin <9g/dL and any history suggestive of hemoglobinopathies.
Patients with history suggestive of endocrine disorders like thyroid, adrenal and pituitary glands disorders.
Patients with history suggestive of any drug intake affecting glucose metabolism.
Methodology
After getting written consent from the cases and controls, detailed history was taken and recorded in their respective proforma. They were subjected to physical examination and anthropometric measurements as per protocol and the findings were noted. Waist circumference (WC) was measured midway between the lowest point of rib cage and the superior border of iliac crest at the end of normal expiration with a stretch resistant measuring tape. Hip circumference (HC) was measured around the widest portion of the buttocks with the tape parallel to the floor. Waist hip circumference ratio (W/H Ratio) was calculated as WC in cm divided by HC in cm. Cut off values for WHR is 0.90 for men and 0.80 for women [9]. The weight and standing height of all study subjects were measured by using calibrated weighing scale and stadiometer with a fixed vertical backboard and an adjustable head piece respectively. BMI can be calculated by the present weight in kg divided by height2 in metre. BMI can be expressed in the units of kg/m2 (Table 1).
Table 1.
WHO classification of BMI grading [10]
| BMI (kg/m2) | Classification |
|---|---|
| < 18.5 | Underweight |
| 18.5-24.9 | Normal Weight |
| 25.0-29.9 | Overweight |
| 30.0-34.9 | Class I Obesity |
| 35.0-39.9 | Class II Obesity |
| ≥ 40.0 | Class III Obesity |
SAMPLE COLLECTION
For estimation of HbA1c 2 mL of blood was collected in EDTA anticoagulant vacutainer. Samples were processed & analysed on the same day. HbA1c was determined by turbidimetric inhibition immunoassay (TINIA) for hemolyzed whole blood. Glycohemoglobin (HbA1c) in the sample reacts with anti HbA1c antibody to form soluble antigen antibody complexes. Since the specific HbA1c antibody site is present only once on the HbA1c molecule, complex formation does not take place. The polyhaptens react with excess anti HbA1c antibodies to form an insoluble antibody polyhapten complex that can be measured turbidimetrically. [11]
STATISTICAL ANALYSIS
Primary outcome were calculated by applying Unpaired ‘t’ test and secondary outcome were obtained by using two-tailed Pearson correlation between variables of prediabetic cases and controls by using the statistical package (IBM SPSS 20). Data were considered to be significant if p < 0.05 and highly significant with p < 0.001.
RESULTS & OBSERVATIONS
In the present study, out of 30 cases, 11 (37%) were normal, 13 (43%) were overweight and 6 (20%) were obese. Out of 30 controls, 20 (67%) were normal while 10 (33%) were overweight. 63% of cases had increased BMI that is much higher than 33% of controls having increased BMI (Table 2).
Table 2.
Data of study group
| S. no. | Data | Cases (n = 30) mean ± SD | Control (n = 30) mean ± SD | p value |
|---|---|---|---|---|
| 1. | BMI (kg/m2) | 27.01 ± 2.91 | 24.16 ± 1.25 | 0.001 |
| 2. | WHR | 0.87 ± 0.38 | 0.80 ± 0.38 | 0.001 |
| 3. | HbA1c (%) | 5.94 ± 0.21 | 5.24 ± 0.32 | 0.001 |
WHR showed statistical significant difference between cases (mean 0.87 ± 0.38) and controls (mean 0.80 ± 0.38) with p value = 0.001. Out of 30 cases, 27 (90%) had increase WHR while 3 (10%) had normal WHR. Out of 30 controls, 13 (43%) had increase WHR while 17 (57%) had normal WHR. So, 90% of cases had increase WHR in comparison to 43% of controls.
TWO-TAILED PEARSON’S CORRELATION BETWEEN PARAMETERS
In the present study, it was found that HbA1c had positive correlation with BMI as well as WHR (Table 3, Figure 2A and 2B).
Table 3.
Correlation of HbA1c with different parameters
| S. no. | Parameters | Correlation coefficient (r) | p value |
|---|---|---|---|
| 1. | HbA1c Vs BMI | 0.583 | 0.001 |
| 2. | HbA1c Vs WHR | 0.495 | 0.005 |
Figure 2A.

Graph showing the correlation between HbA1c and BMI
Figure 2B.

Graph showing the correlation between HbA1c and WHR
DISCUSSION
Development of preDM is linked to environmental factors such as physical inactivity but the subsequent development of diabetes is affected by combination of genetic and environmental factors [7]. Adverse environmental factors or disease can cause cells to fail to respond to insulin leading to insulin resistance (IR). Once IR develops, the body cells fail to respond to insulin and are unable to use it effectively leading to development of IGT. When the condition develops further, apoptosis of islet cells occurs and glucose metabolism is disrupted leading to clinical DM [2].
In the present study, 63% of cases had increased BMI in comparison to 33% of controls having increased BMI. HbA1c had significant positive correlation with BMI and WHR. Our observation is supported by study done by Li et al and Abtahi et al.
Li et al reported a positive correlation between HbA1c and BMI in preDM. It is found that oxidative stress is a key determinant of glycation of hemoglobin leading to increase HbA1c levels with elevated oxidative stress in nondiabetic subjects. Oxidative stress affects HbA1c level through two ways. Firstly, the glycation of hemoglobin is a two step Maillard reaction involving the initial formation of a labile Schiff base and a subsequent Amadori rearrangement. Oxidative stress facilitates the autoxidation of glucose to dicarbonyl intermediates in an early step of the Maillard reaction and thus enhancing the glycation of proteins. Secondly, oxidative stress results in insulin resistance within adipose and skeletal muscle tissues and subsequent development of hyperglycemia which will further increase the oxidative stress [12].
Lipid peroxidation also affects glycation of hemoglobin independent of glucose concentration. Therefore, oxidative stress may partly explain the discordance between HbA1c levels and blood glucose diagnosing diabetes and preDM.
Obesity has been reported as a strong independent predictor of systemic oxidative stress. Thus the association between BMI and HbA1c is mediated by oxidative stress.
Obesity can induce systemic oxidative stress leading to increased glycation of hemoglobin independent of glucose levels. Thus HbA1c concentration may be disproportionately elevated at a given glycemic level in obese subjects. So, HbA1c cannot reflect the real concentration of glucose in obese subjects [13,14].
Abtahi et al observed that the prevalence of preDM was higher in obese person having higher range of waist circumference, WHR and BMI. Body weight is determined by many factors such as genetic, behavioral, cultural, socio-economic, physical inactivity, diet and psychosocial factors. Excess body weight is a risk factor for a variety of health hazards like DM, preDM and cardiovascular disease. It was concluded that people with lower BMI are less susceptible for development of DM & preDM and obese people have higher prevalence of abnormal blood glucose levels [15].
Various studies have shown that one to three quarters of subjects with IGT develop diabetes within a decade of discovery of IGT and annual progression rates from IGT to diabetes range from 1 to 10%. Thus by slowing the progression, the incidence of diabetes would be reduced and the onset of its complications would be prevented or delayed [16-19]. Early intervention is required to improve the progression of the complications and reduce the cost of disease in the long term. A sedentary lifestyle increases the risk for development of IR. Energy expenditure of 500 kcal/week decreases risk of developing type 2 DM by 6%. According to one study, vigorous exercise at least once a week reduces the risk of type 2 DM in women by 33% [2].
According to the Da Qing study exercise advice (with or without dietary advice) appears more effective than dietary advice alone. Exercise increases insulin mediated glucose disposal in muscles. Although in humans low dietary fat content does not influence insulin mediated glucose disposal but hypocaloric diet leading to weight loss is associated with improved insulin mediated glucose disposal and reduction of glycemia. Thus, these interventions lead to reduce IR, slows the progression of glucose intolerance and arrests or delays β cell deterioration [20].
CONCLUSION
BMI and WHR has a role in glycation of hemoglobin and obesity is a preventable risk factor for the development of prediabetes and its further consequences.
REFERENCES
- 1.Buysschaert M, Bergman M. Definition of prediabetes. Med Clin N Am 2011;95:289-297. [DOI] [PubMed] [Google Scholar]
- 2.Tang Q, Li X, Song P, Xu L. Optimal cut-off values for the homeostasis model assessment of insulin resistance (HOMA-IR) and pre-diabetes screening: Developments in research and prospects for the future. Drug Discov Ther 2015;9:380-385. [DOI] [PubMed] [Google Scholar]
- 3.Hare MJL, Shaw JE, Zimmet PZ. Current controversies in the use of haemoglobin A1c. J Intern Med 2012;271:227-236. [DOI] [PubMed] [Google Scholar]
- 4.Derr R, Garrett E, Stacy GA, Saudek CD. Is HbA1c affected by glycemic instability. Diabetes Care 2003;26:2728-2733. [DOI] [PubMed] [Google Scholar]
- 5.Sacks DB. Diabetes Mellitus. Burtis CA, Ashwood ER, Bruns DE, editors. Teitz textbook of clinical chemistry and molecular diagnostics. 5th ed. Philadelphia: Elsevier; 2012. p.1442. [Google Scholar]
- 6.Zafon C, Ciudin A, Valladares S, Mesa J, Simo R. Variables involved in the discordance between HbA1c and fructosamine: the glycation gap revisited. PLos One 2013;8:e66696. [DOI] [PMC free article] [PubMed] [Google Scholar]
- 7.Anjana RM, Rani CSS, Deepa M, Pradeepa R, Sudha V, Nair HD, et al. Incidence of diabetes and prediabetes and predictors of progression among asian Indians: 10 year follow up of the Chennai Urban Rural Epidemiology Study. Diabetes care 2015;38:1441-1448. [DOI] [PubMed] [Google Scholar]
- 8.American Diabetes Association. Diagnosis and classification of diabetes mellitus. Diabetes Care 2014;37:81-90.23959568 [Google Scholar]
- 9.Zheng Y, Sun Q, Chen K, Yan W, Pan C, Lu J, et al. Waist to hip ratio, dyslipidemia, glycemic levels, blood pressure and depressive symptoms among diabetic and non diabetic Chinese women: A cross sectional study. PLos One 2014;9:e109765. [DOI] [PMC free article] [PubMed] [Google Scholar]
- 10.The world health report 2000 - Health systems: improving performance. p.9. [PubMed] [Google Scholar]
- 11.Gene S, Omer B, Ustyol EA, Ince N, Bal F, Gurdol F. Evaluation of Turbidimetric Inhibition Immunoassay (TINIA) and HPLC methods for glycated haemoglobin determination. J Clin Lab Anal 2012;26:481-485. [DOI] [PMC free article] [PubMed] [Google Scholar]
- 12.Li J, Ma H, Na L, Jiang S, Lu L, Li G, et al. Increased hemoglobin A1c threshold for prediabetes remarkably improving the agreement between A1c and oral glucose tolerance test criteria in obese population. J Clin Endocrinol Metab 2015;100:1997-2005. [DOI] [PubMed] [Google Scholar]
- 13.Selvaraj N, Bobby Z, Sathiyapriya V. Effect of lipid peroxides and antioxidants on glycation of hemoglobin: an in vitro study on human erythrocytes. Clin Chim Acta 2006;366:190-195. [DOI] [PubMed] [Google Scholar]
- 14.Sathiyapriya V, Selvaraj N, Nandeesha H, Bobby Z, Agrawal A, Sridhar MG, et al. Increased glycation of hemoglobin and plasma proteins in normotensive, nondiabetic obese Indian subjects: putative role of lipid peroxides. Clin Chem Lab Med 2007;45:996-999. [DOI] [PubMed] [Google Scholar]
- 15.Abtahi F, Naghshzan A, Zibaeenezhad MJ, Heydari ST, Khosropanah SH, Zamirian M, et al. The relationship between body mass index and prediabetes in teachers residing in Shiraz-Iran 2009. Iran Cardiovasc Res J 2010;4:112-117. [Google Scholar]
- 16.Saad MF, Knowler WC, Pettitt DJ, Nelson RG, Bennett PH. The natural history of impaired glucose tolerance in Pima Indians. N Engl J Med 1988;319:1500-1506. [DOI] [PubMed] [Google Scholar]
- 17.Sartor G, Schersten B, Carlstrom S, Melander A, Norden A, Persson G. Tenyear follow up of subjects with impaired glucose tolerance: prevention of diabetes by tolbutamide and diet regulation. Diabetes 1980;29:41-49. [DOI] [PubMed] [Google Scholar]
- 18.Keen H, Jarrett RJ, McCartney P. The ten year follow up of the Bedford Survey (1962-1972): glucose tolerance and diabetes. Diabetologia 1982;22:73-78. [DOI] [PubMed] [Google Scholar]
- 19.Lillioja S, Mott DM, Spraul M, Ferraro R, Foley JE, Ravussin E, et al. Insulin resistance and insulin secretory dysfunction as precursors of non insulin dependent diabetes mellitus: prospective studies of Pima Indians. N Engl J Med 1993;329:1988-1992. [DOI] [PubMed] [Google Scholar]
- 20.Pan XR, Li GW, Hu YH, Wang JX, Yang WY, An ZX, et al. Effects of diet and exercise in preventing NIDDM in people with impaired glucose tolerance: The Da Qing IGT and Diabetes Study. Diabetes Care 1997;20:537-544. [DOI] [PubMed] [Google Scholar]


