

Abstract
Aim:
The aim of this in vivo study was to evaluate and compare the soft and hard tissue changes in implant supported mandibular overdenture with three different attachment system.
Settings and Design:
In vivo – observation study.
Materials and Methods:
After evaluation of prosthetic space, fifteen edentulous subjects received two implants in the inter-foramina region of the mandible and were divided into 3 groups with 5 subjects each, delayed loading protocol was followed in all the patients. The crestal bone loss, modified sulcular bleeding index, plaque index values were evaluate with the attachments at baseline and after 6 months was measured in a standardised way.
Statistical Analysis Used:
Oneway ANOVA test and post hoc Bonferroni multiple test.
Results:
At the end of six months modified sulcular bleeding index and plaque index values was higher in Group 2 (bar and clip attachment) as compared to Group 1 (ball and socket attachment) and Group 3 (Kerator attachment) and crestal bone loss was equal in groups 1, 2 and 3. Analysis of variance with repeated measures showed significant differences in modified sulcular bleeding index and plaque index among the three attachment types.
Conclusion:
(1) Group 2 (bar-and-clip attachment) exhibited higher Modified Sulcular Bleeding Index and Plaque Index values than Group 1 (ball-and-socket attachment) and Group 3 (kerator attachment). (2) Crestal bone loss was equal in Group 1 (ball-and-socket attachment), Group 2 (bar-and-clip attachment), and Group 3 (kerator attachment).
Keywords: Ball attachment, bar attachment, crestal bone loss, implant-supported overdenture, kerator attachment, modified sulcular bleeding index, plaque index
INTRODUCTION
Completely removable maxillary and mandibular dentures or the conventional dentures have been the treatment of choice for edentulous patients for a long time. However, patients usually have complaints of mandibular denture with problems such as lack of stability and retention. One therapeutic approach directed at improving oral function in the elderly is the use of implant-supported overdenture (ISOD).[1]
The continued loss of alveolar bone represents one of the most significant biologic conditions that negatively influence the success of mandibular complete denture. It has been reported that more than 50% of those with mandibular complete dentures have problems with stability and retention due to resorbed ridges.
These problems can be successfully addressed using a dental prosthesis employed in conjunction with dental implants. A number of treatment strategies have been employed in the edentulous mandible; these strategies include fixed prosthesis, mucosa-implant-supported overdentures, and ISOD.[2]
Any successful overdenture treatment begins with the understanding of full-denture fabrication protocols. This includes ideal border adaptation, extension, and occlusion. A try-in of the proposed tooth setup will allow evaluation of esthetics, phonetics, and support, as well as the critical determination of ridge position relative to the proposed prosthesis before surgery. The setup is then used to guide ideal implant position because the most critical factor in ISOD is that implants emerge well within the confines of the denture.[3]
Radiographic analysis has shown that the largest amount of bone loss occurs following implant placement and abutment connection. Typically, there are no significant marginal bone changes during functional loading. Criteria for a successful implant therapy include a median marginal bone loss of 0.5 mm during healing, followed by an annual rate of vertical bone loss of <0.2 mm.[4]
For a successful ISOD treatment, evaluation of prosthetic space analysis is critical. For bar-supported overdentures, at least 13–14 mm interocclusal space is required. The minimum space requirement for ball attachment is 10–12 mm and for locators is 8.5 mm. Inadequate space for prosthetic components can result in an overcontoured prosthesis, excessive occlusal vertical dimension, fractured teeth adjacent to the attachments, attachments separating from the denture, fracture of the prosthesis, and overall patient dissatisfaction.[5]
This study was, therefore, undertaken to evaluate and compare the marginal bone loss, Modified Sulcular Bleeding Index, and Plaque Index in implant-supported mandibular overdentures and their satisfaction level with three different attachment systems, i.e., ball-socket, bar-clip, and kerator attachments.
MATERIALS AND METHODS
Patient populations
Fifteen mandibular completely edentulous healthy patients in the age group of 35–65 years were selected for the study. The patients were explained about the treatment plan before starting the procedure. A written informed consent was obtained from the patients.
Ethical committee approval was obtained from the institutional ethical committee reference no. SDC/CER/2016/716. All procedures performed in the study were conducted in accordance with the ethical standards given in 1964 Declaration of Helsinki, as revised in 2013.
Inclusion criteria
Age: 35–65 years
Medically fit patients
Completely edentulous mandibular arch
Patients willing to follow the recommended follow-up regimen.
Exclusion criteria
Patients with a history of smoking and unwilling to quit the habit
Patients who were unable to perform routine oral hygiene procedures
Active infection and any pathological condition at the site of implant placement
Patients subjected to irradiation in the head-and-neck region.
After careful analysis of prosthetic space, the patients were divided into the following three groups, with five patients in each group:
Group 1 – Ball-and-socket attachment group
Group 2 – Bar-and-clip attachment group
Group 3 – Kerator attachment group.
Follow-up was done at baseline (at implant placement), after 3 months (during prosthetic loading), and after 6 months (after prosthetic loading).
Surgical protocol
All patients were prescribed with oral antibiotic (Augmentin 625 mg TDS) prior to the implant surgery, for 5 days. The radiographic template [Figure 1], which was fabricated while making the orthopantomogram (OPG) [Figure 2] for diagnostic purpose, was converted and utilized as a surgical template [Figure 3]. Implants were placed at B and D sites [Figure 4] under local anesthesia articaine (4%) with epinephrine (1:100,000). OPGs were obtained to confirm the implant placement [Figure 5].
Figure 1.
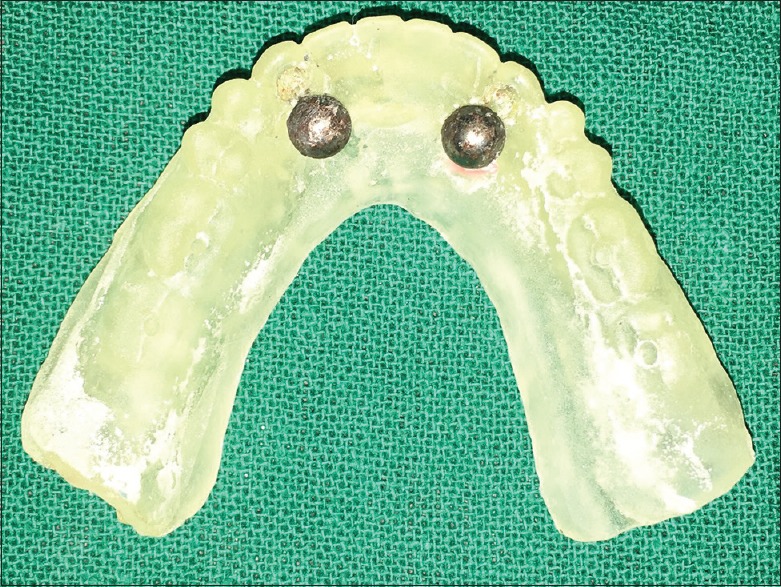
Radiographic stent
Figure 2.
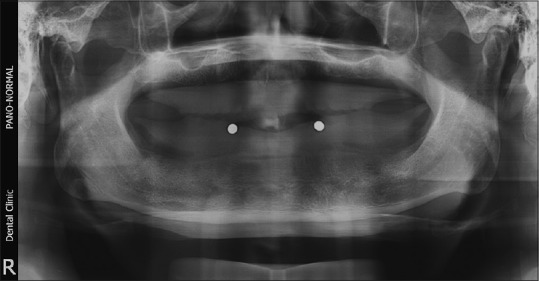
Digital pantomogram with radiographic stent
Figure 3.
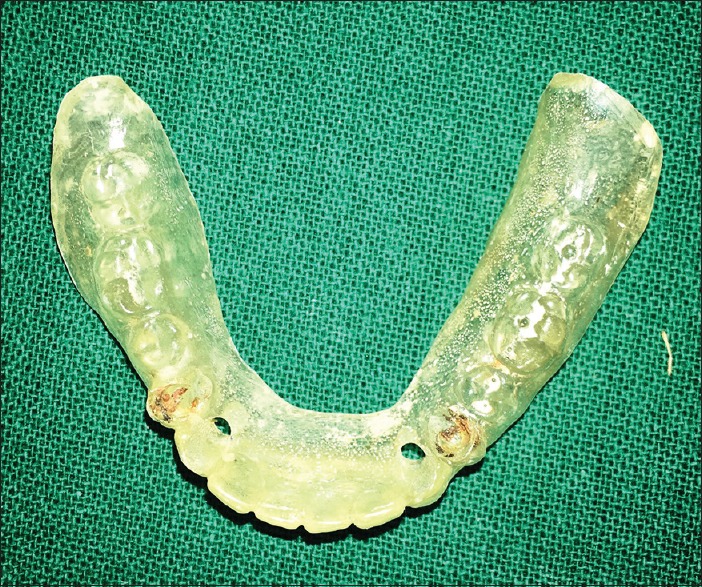
Surgical stent
Figure 4.
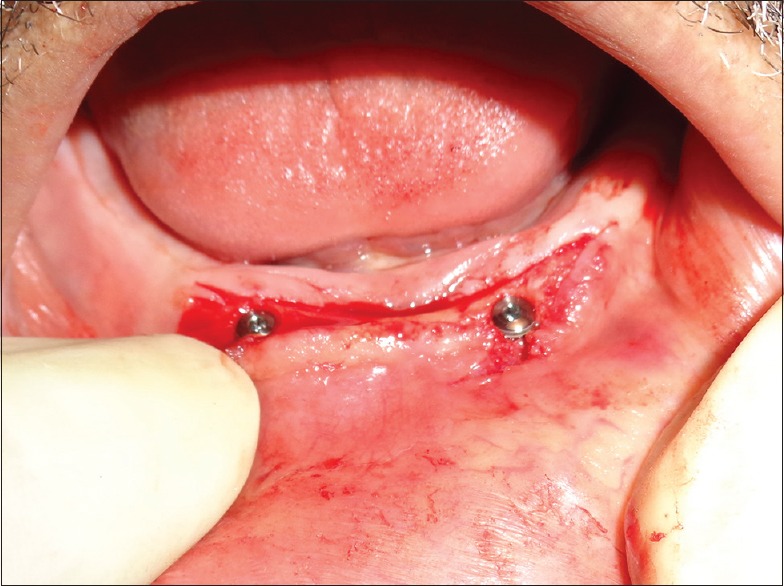
Implants with cover screw
Figure 5.
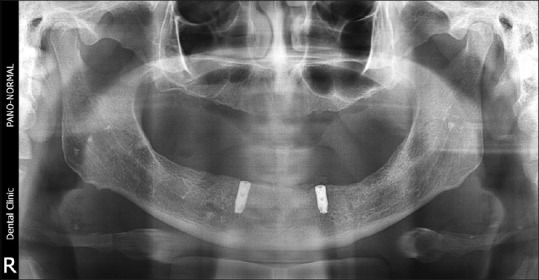
Digital pantomogram with implants in interforaminal region
Prosthetic procedure
Prosthetic procedure was started 3 months after first-stage surgery; delayed loading protocol was followed and healing abutment was placed for 15 days [Figure 6]. The patients were divided into the following three groups:
Figure 6.
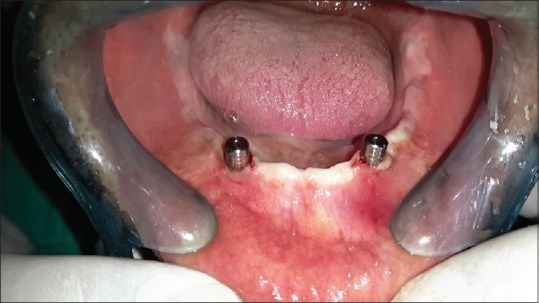
Healing abutments
Group I: Five patients were rehabilitated using ball-and-socket attachments (ADIN Dental Implant System Ltd, Northern Israel) [Figure 7]. After removal of healing abutment, the ball abutments [Figure 8a] were tightened by a hand torque and a torque wrench (30 Ncm). A separator was placed over the head of each ball abutment as a block out. Metal housings with nylon cap were inserted on the abutment, and recess was prepared in the denture. Vent hole was prepared on the lingual aspect to express resin. Autopolymerizing resin was mixed and placed in the recess of the denture and the denture was placed in position. After the resin had cured, the denture was removed from the patient's mouth, the excess material was trimmed, and the denture was finished and polished [Figure 8b]
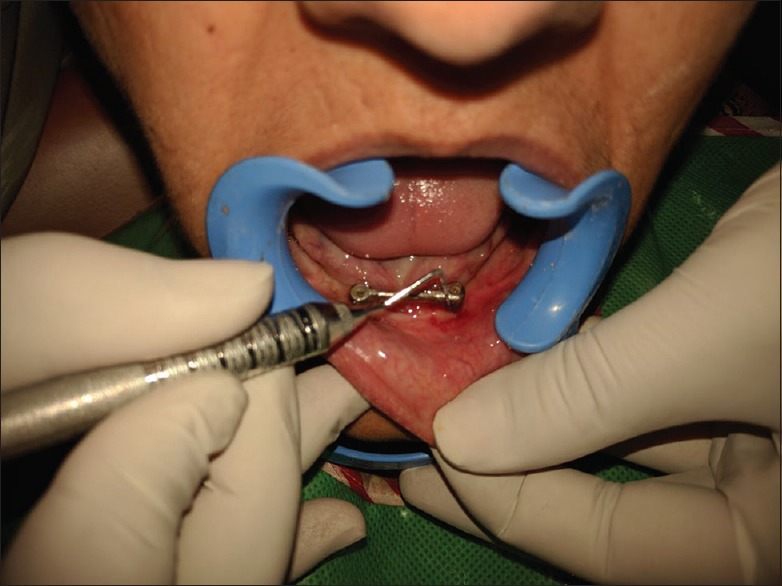
Group II: Five patients were rehabilitated using bar–clip attachments (CEKA PRECI-LINE, Belgium) [Figure 9]. After removal of healing collars, pick-up impression posts were placed at the implant level. An open-tray impression was made [Figure 10a], and master cast was poured. On this master cast, nonengaging castable abutments were placed and were connected with a prefabricated plastic bar of 2 mm thickness and 3 mm height [Figure 10b]. The pattern was casted in a Co-Cr alloy using standard technique. Casting was then retrieved, finished, and highly polished to avoid any plaque accumulation along the bar. After verifying the passive fit, a metal framework was fitted intraorally [Figure 10c], and abutments were tightened by a hand torque and a torque wrench (30 Ncm). The undersurface was blocked with modeling wax on the mid-surface of the bar and a plastic clip–metal housing assembly was placed. Recess was prepared in the denture. Autopolymerizing resin was mixed and placed in the recess of the denture, and the denture was placed in position. After the resin had cured, the denture was removed from the patient's mouth, excesses material was trimmed, and the denture was finished and polished [Figure 10d]
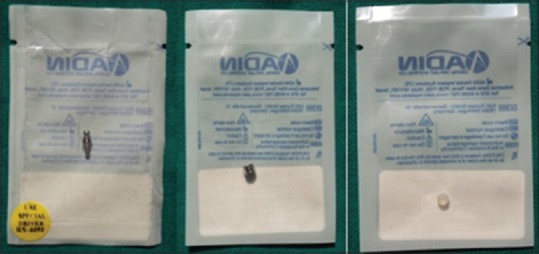
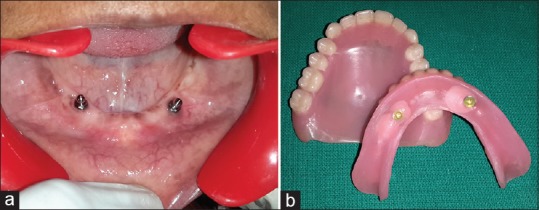
Group III: Five patients were rehabilitated using kerator attachments [Figure 11] (Hubermed, U.K). After removal of healing abutments, kerator abutment was engaged into the implant using a carrier. The abutment was tightened by a hand torque and a wrench (30 Ncm) [Figure 12a]. A white block-out spacer was placed over the head of each kerator abutment. Metal housing was inserted with a black cap on the abutment, and recess was prepared in the denture. Vent hole was prepared on the lingual aspect to express excess resin. Autopolymerizing resin was mixed and placed in the recess of the denture and the denture was placed in position. After the resin had cured, the denture was removed, and the white spacer was discarded. The black cap was removed from the metal housing and a blue-colored final cap was pushed into the metal housing using Kerator Magic Tool. The denture was then finished and polished [Figure 12b].
Figure 7.
Ball and socket attachment
Figure 8.
(a) Ball attachment. (b) Metal housing after incorporation in denture
Figure 9.
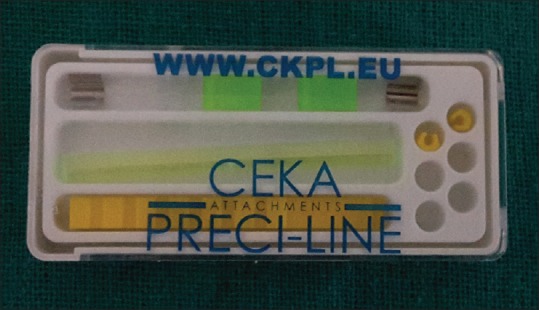
Bar and clip attachment
Figure 10.
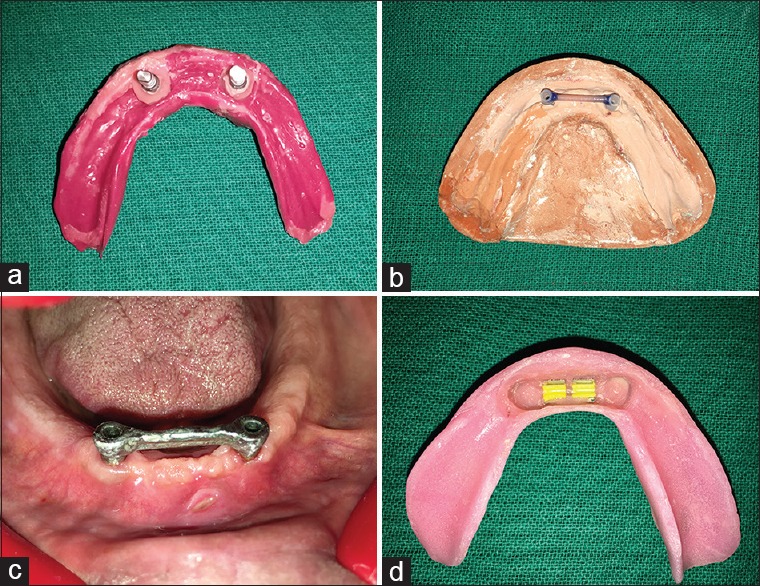
(a) Open tray implant impression. (b) Master cast with wax pattern. (c) Finished metal framework. (d) Final denture with metal housing and plastic clips
Figure 11.
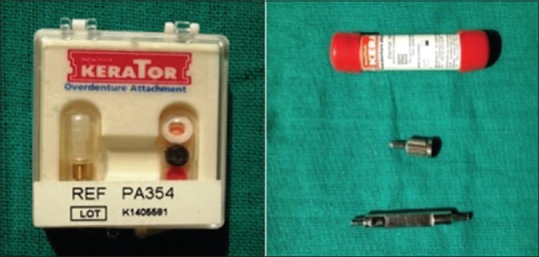
Kerator attachment
Figure 12.
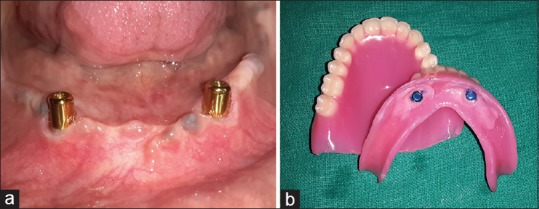
(a) Kerator attachment. (b) Metal housing after incorporation into denture base
Assessment of crestal bone loss
Proximal marginal bone loss was assessed using a dental X-ray machine, a radiovisiograph sensor, a patient positioning device, and a 1-mm radiographic grid. For each exposure, the electric potential was kept at 65 kVa with exposure time of 0.14 s. The use of patient positioning device ensured that the long cone paralleling technique with a fixed source film distance of 25 cm was followed for each assessment. The device was attached to the tube head and the sensor was attached [Figure 13]. The radiographic grid was attached to the sensor and become superimposed on the radiograph, thus facilitating measurements of bone loss. All measurements were made on both the mesial and distal aspects of the implant from the implant–abutment junction to the first contact of bone to implant [Figure 14]. The mean bone loss was calculated for each patient based on these readings. Baseline measurements were made at the time of loading followed by 6 months. If the bone was found to be flush with the implant–abutment junction, a value of 0 was recorded.[6,7]
Figure 13.
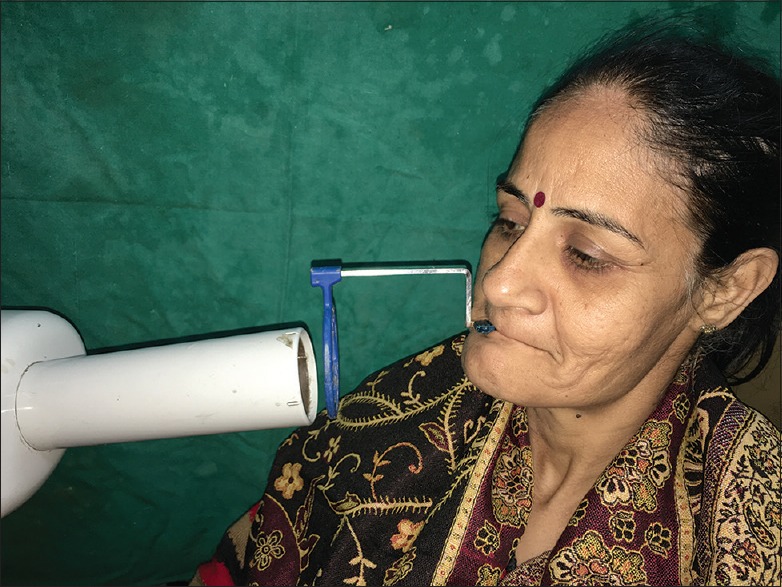
Patient positioning device
Figure 14.
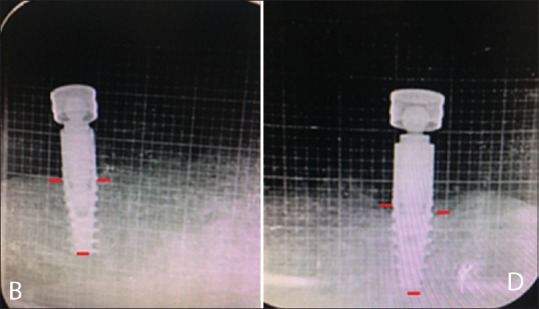
Radiographic grid with implant markings
Assessment of Modified Sulcular Bleeding Index
The Modified Sulcular Bleeding Index was used to determine the gingival health at the time of loading and 6 months after loading. A sterile periodontal probe (University of Michigan “O” probe with Williams’ markings) was passed along the gingival margin [Figure 15], and the scores were given according to Mombelli, Van Oosten, and S. Church criteria.[8,9]
Figure 15.
Williams periodontal probe
Assessment of plaque component of the Oral Hygiene Index
The measurement of the state of oral hygiene by Silness–Loe Plaque Index is based on recording both soft debris and mineralized deposits around the implants. Readings were taken at the time of loading and 6 months after implant placement. Scores were measured at the labial, lingual, mesial, and distal surfaces of the implant abutment in Groups 1 and 2. In bar-and-clip attachment group, plaque was measured on the surface of splinted bar [Figure 16].[8,9]
Figure 16.
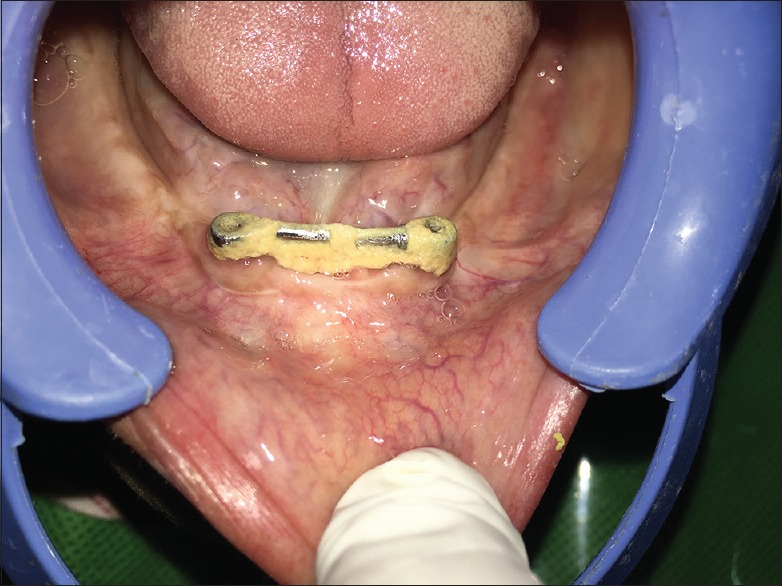
Plaque on bar and clip attachment
RESULTS
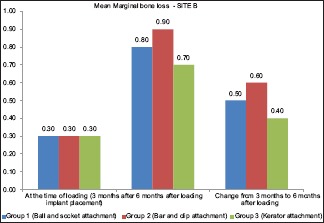
The mean marginal bone loss at site B at the time of loading (3 months after implant placement) and 6 months after loading was evaluated using the one-way analysis of variance (ANOVA) test. There was no significant difference in mean marginal bone loss at site B at the time of loading (3 months after implant placement) and at 6 months after loading and change in marginal bone loss from 3 to 6 months between Group 1 (ball-and-socket attachment), Group 2 (bar-and-clip attachment), and Group 3 (kerator attachment). The intergroup comparison of mean marginal bone loss at site B at 6 months after loading and change in marginal bone loss from 3 to 6 months was done using the post hoc Bonferroni test. There was no significant difference in the mean marginal bone loss at site B at the time of loading (3 months after implant placement) and at 6 months after loading and change in marginal bone loss from 3 to 6 months between Group 1 (ball-and-socket attachment), Group 2 (bar-and-clip attachment), and Group 3 (kerator attachment) [Table 1 and Graph 1].
Table 1.
The mean marginal bone loss - site B
| Marginal bone loss in site B | Mean | SD | F | Pa | Significance | Post hoc comparisonsb |
|---|---|---|---|---|---|---|
| At the time of loading (3 months after implant placement) | ||||||
| Group 1 | 0.30 | 0.27 | 0.000 | 1.000# | NS | N/A |
| Group 2 | 0.30 | 0.27 | ||||
| Group 3 | 0.30 | 0.27 | ||||
| 6 months after loading | ||||||
| Group 1 | 0.80 | 0.27 | 0.462 | 0.641# | NS | N/A |
| Group 2 | 0.90 | 0.22 | ||||
| Group 3 | 0.70 | 0.45 | ||||
| Change from 3 to 6 months | ||||||
| Group 1 | 0.50 | 0.00 | 1.500 | 0.262# | NS | N/A |
| Group 2 | 0.60 | 0.22 | ||||
| Group 3 | 0.40 | 0.22 |
aOne-way ANOVA test, bPost hoc Bonferroni test, #Not significant, *Significant difference. ANOVA: Analysis of variance, N/A: Not available, NS: Not significant, SD: Standard deviation
Graph 1.
Representing the mean marginal bone loss - site B
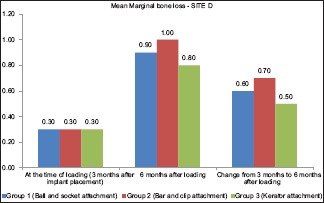
The mean marginal bone loss at site D at the time of loading (3 months after implant placement) and 6 months after loading and change in marginal bone loss from 3 to 6 months were compared between Group 1 (ball-and-socket attachment), Group 2 (bar-and-clip attachment), and Group 3 (kerator attachment) using the one-way ANOVA test. There was no significant difference in mean marginal bone loss at site D at the time of loading (3 months after implant placement) and at 6 months after loading and change in marginal bone loss from 3 to 6 months between Group 1 (ball-and-socket attachment), Group 2 (bar-and-clip attachment), and Group 3 (kerator attachment). The intergroup comparison of mean marginal bone loss at site D at 6 months after loading and change in marginal bone loss from 3 to 6 months was done using the post hoc Bonferroni test. There was no significant difference in the mean marginal bone loss at site D at the time of loading (3 months after implant placement) and at 6 months after loading and change in marginal bone loss from 3 to 6 months between Group 1 (ball-and-socket attachment), Group 2 (bar-and-clip attachment), and Group 3 (kerator attachment) [Table 2 and Graph 2].
Table 2.
The mean marginal bone loss - site D
| Marginal bone loss at site D | Mean | SD | F | Pa | Significance | Post hoc comparisonsb |
|---|---|---|---|---|---|---|
| At the time of loading (3 months after implant placement) | ||||||
| Group 1 | 0.30 | 0.27 | 0.000 | 1.000# | NS | N/A |
| Group 2 | 0.30 | 0.27 | ||||
| Group 3 | 0.30 | 0.27 | ||||
| 6 months after loading | ||||||
| Group 1 | 0.80 | 0.27 | 0.462 | 0.641# | NS | N/A |
| Group 2 | 0.90 | 0.22 | ||||
| Group 3 | 0.70 | 0.45 | ||||
| Change from 3 to 6 months | ||||||
| Group 1 | 0.50 | 0.00 | 1.500 | 0.262# | NS | N/A |
| Group 2 | 0.60 | 0.22 | ||||
| Group 3 | 0.40 | 0.22 |
aOne-way ANOVA test, bPost hoc Bonferroni test, #Not significant,*Significant difference. ANOVA: Analysis of variance, N/A: Not available, NS: Not significant, SD: Standard deviation
Graph 2.
Representing the mean marginal bone loss - site D
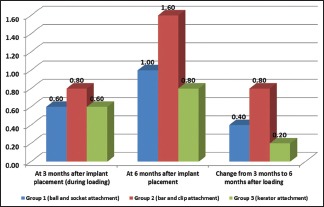
The mean Modified Sulcular Bleeding Index at the time of loading (3 months after implant placement) and 6 months after loading and change in Modified Sulcular Bleeding Index from 3 to 6 months were compared between Group 1 (ball-and-socket attachment), Group 2 (bar-and-clip attachment), and Group 3 (kerator attachment) using the one-way ANOVA test. There was a significant difference between mean Modified Sulcular Bleeding Index 6 months after loading and change in Modified Sulcular Bleeding Index from 3 to 6 months between Group 1 (ball-and-socket attachment), Group 2 (bar-and-clip attachment), and Group 3 (kerator attachment). The intergroup comparison of mean Modified Sulcular Bleeding Index at the time of loading, at 6 months after loading, and change of index from 3 to 6 months was done using the post hoc Bonferroni test. The mean Modified Sulcular Bleeding Index 6 months after loading and change of index from 3 to 6 months were significantly higher in Group 2 (bar-and-clip attachment) in comparison to Group 1 (ball-and-socket attachment), which was significantly high in Group 3 (kerator attachment) [Table 3 and Graph 3].
Table 3.
Representing the mean modified sulcular bleeding index
| Modified sulcular bleeding index | Mean | SD | F | Pa | Significance | Post hoc comparisonsb |
|---|---|---|---|---|---|---|
| At the time of loading (3 month after implant placement) | ||||||
| Group 1 | 0.60 | 0.55 | 3.250 | 0.074 | NS | N/A |
| Group 2 | 0.80 | 0.55 | ||||
| Group 3 | 0.60 | 0.55 | ||||
| 6 months after loading | ||||||
| Group 1 | 1.00 | 0.45 | 16.000 | <0.001* | S | 2>1, 3 |
| Group 2 | 1.60 | 0.45 | ||||
| Group 3 | 0.80 | 0.55 | ||||
| Change from 3 to 6 months | ||||||
| Group 1 | 0.40 | 0.84 | 3.750 | 0.015* | S | 2>1, 3 |
| Group 2 | 0.80 | 0.84 | ||||
| Group 3 | 0.20 | 1.00 |
aOne-way ANOVA test, bPost hoc bonferroni test, *Significant difference. ANOVA: Analysis of variance, N/A: Not available, NS: Not significant, SD: Standard deviation, S: Significant
Graph 3.

Representing the mean modified sulcular bleeding index
The mean Plaque Index at the time of loading (3 months after implant placement), at 6 months after loading, and change in Modified Sulcular Bleeding Index from 3 to 6 months were compared between Group 1 (ball-and-socket attachment), Group 2 (bar-and-clip attachment), and Group 3 (kerator attachment) using the one-way ANOVA test. There was a significant difference in mean Plaque Index at the time of loading (3 months after implant placement) and 6 months after loading between Group 1 (ball-and-socket attachment), Group 2 (bar-and-clip attachment), and Group 3 (kerator attachment). The intergroup comparison of mean Modified Sulcular Bleeding Index at the time of loading, at 6 months after loading, and change in index from 3 to 6 months was done using the post hoc Bonferroni test. The mean Plaque Index 6 months after loading and change in index from 3 to 6 months were significantly higher in Group 2 (bar-and-clip attachment) in comparison to Group 1 (ball-and-socket attachment), which was significantly high in Group 3 (kerator attachment) [Table 4 and Graph 4].
Table 4.
The mean Plaque Index
| Plaque Index | Mean | SD | F | Pa | Significance | Post hoc comparisonsb |
|---|---|---|---|---|---|---|
| At the time of loading (3 months after implant placement) | ||||||
| Group 1 | 0.60 | 0.45 | 1.615 | 0.112 | NS | N/A |
| Group 2 | 0.60 | 0.84 | ||||
| Group 3 | 0.60 | 0.25 | ||||
| 6 months after loading | ||||||
| Group 1 | 1.00 | 0.71 | 12.182 | 0.001* | S | 2>1, 3 |
| Group 2 | 1.20 | 0.55 | ||||
| Group 3 | 0.80 | 0.55 | ||||
| Change from 3 to 6 months | ||||||
| Group 1 | 0.40 | 1.14 | 4.261 | 0.025* | S | 2>1, 3 |
| Group 2 | 0.60 | 0.89 | ||||
| Group 3 | 0.20 | 0.45 |
aOne-way ANOVA test, bPost hoc Bonferroni test, *Significant difference. SD: Standard deviation, ANOVA: Analysis of variance, N/A: Not available, NS: Not significant, S: Significant
Graph 4.
Representing the mean plaque index
DISCUSSION
Today, a multitude of implant and attachment systems are available for the fabrication of ISOD. Several studies have reported the evaluation of ball and bar attachment systems. On the other hand, there is a lack of clinical study which investigates the kerator attachment system.
The present study evaluated the comparison of three different attachment systems, namely ball-and-socket attachment, bar-and-clip attachment, and kerator attachment system, with regard to marginal bone loss with the help of radiovisiography (RVG), Modified Sulcular Bleeding Index, and Plaque Index, respectively.
Different studies reported data on marginal bone loss of implants supporting an overdenture in the lower jaw. Comparison of the clinical and radiographic parameters among these studies is difficult because of the variation in the clinical and radiographic parameters used. Jemt et al. (1996) reported 0.5 mm of bone loss during the entire 5-year follow-up. Naert et al. (1998) reported 0.6 mm during the 1st year, and thereafter an average annual bone loss of 0.1 mm. Naert et al. (2004) reported 1.2 mm of bone loss for bar-connected Branemark implants during the entire 10-year follow-up. Telleman et al. (2006) reported 2.2 mm of bone loss for bar-connected international team of implantology (ITI) implants after 10 years.[10]
In the present study, proximal crestal bone loss was measured with the long cone paralleling technique, which has been used in many studies previously with minor modifications.[6,7] The radiographic grid helped counter any magnification that might have been produced and also made measurement easier.
A mean marginal bone loss of 0.3 mm within the 1st year at implants with bars and clips or Ceka attachments was recorded. It is believed that the direction of occlusal forces is more important than the connection of the implants. The difference in stress concentration between models with and without bars seems also to be small. It appears that there is no significant difference in mean bone loss between the patients with ball or bar-retained overdentures. However, there is some evidence that mean bone loss values appear to be higher in patients with ball attachments. It was speculated that the reason for this loss could be related to differences in loading patterns or bone conditions.[11]
According to Krennmair et al.,[12] with regard to peri-implant conditions, marginal bone loss, both anchoring elements such as ball–socket and locator attachments, showed no marked differences throughout the follow-up period and thus confirmed the data for other successfully used single attachments. Cune et al.[13] stated that in light of the fact that no major changes in marginal bone levels were observed between baseline and after 10 years of function, measurements at intervening time points would have been interesting but are not missed critically. Oetterli et al.[14] reported a difference in peri-implant health between implants supporting bar–clip- and ball–socket-supported two-implant mandibular overdentures was not noted in several clinical trials lasting 5–10 years.
In the present study, the mean marginal bone loss at the time of loading (3 months after implant placement) at site B was 0.30, 0.30, and 0.30 mm, for Group 1 (ball-and-socket attachment), Group 2 (bar-and-clip attachment), and Group 3 (kerator attachment), respectively, whereas 6 months after loading at site B, the corresponding value was 0.80, 0.90, and 0.70 mm for Group 1 (ball-and-socket attachment), Group 2 (bar-and-clip attachment), and Group 3 (kerator attachment), respectively, and change in marginal bone loss from 3 to 6 months was 0.50, 0.60, and 0.40 mm in Group 1 (ball-and-socket attachment), Group 2 (bar-and-clip attachment), and Group 3 (kerator attachment), respectively. The intergroup comparison of mean marginal bone loss at site B at 6 months after loading and change in marginal bone loss from 3 to 6 months was done using the post hoc Bonferroni test.
There was no significant difference in the mean marginal bone loss at site B at the time of loading (3 months after implant placement) and at 6 months after loading and change in marginal bone loss from 3 to 6 months between Group 1 (ball-and-socket attachment), Group 2 (bar-and-clip attachment), and Group 3 (kerator attachment).
While the mean marginal bone loss at the time of loading (3 months after implant placement) at site D was 0.30, 0.30, and 0.30 mm for Group 1 (ball-and-socket attachment), Group 2 (bar-and-clip attachment), and Group 3 (kerator attachment), respectively, the mean marginal bone loss at 6 months after loading at site D was 0.90, 1.0, and 0.80 mm for Group 1 (ball-and-socket attachment), Group 2 (bar-and-clip attachment), and Group 3 (kerator attachment), respectively.
The intergroup comparison of mean marginal bone loss at site D at 6 months after loading and change in marginal bone loss from 3 to 6 months was done using the post hoc Bonferroni test.
There was no significant difference in the mean marginal bone loss at site D at the time of loading (3 months after implant placement) and at 6 months after loading and in marginal bone loss from 3 to 6 months between Group 1 (ball-and-socket attachment), Group 2 (bar-and-clip attachment), and Group 3 (kerator attachment). These results are similar to those of previous studies.[12,13,14] This again seems to indicate that the bone levels had stabilized after witnessing a rapid decline during the 1st month after loading.
The Modified Sulcular Bleeding Index was developed by Mombelli, Van Oosten, and Schurch Jr in 1987 as a modified version of the Papillary Bleeding Index (Muhlemann, 1977). It has been often used as a parameter to evaluate soft-tissue health around implants. In the present study, the values obtained for this index were relatively higher when compared to those of previous studies. At the time of loading (3 months after implant placement), Modified Sulcular Bleeding Index was 0.60, 0.80, and 0.60 for Group 1 (ball-and-socket attachment), Group 2 (bar-and-clip attachment), and Group 3 (kerator attachment), respectively, while that of at 6 months after loading was 1.0, 1.60, and 0.80 for Group 1 (ball-and-socket attachment), Group 2 (bar-and-clip attachment), and Group 3 (kerator attachment), respectively, and change in the Modified Sulcular Bleeding Index from 3 to 6 months compared was 0.40, 0.80, and 0.20 in Group 1 (ball-and-socket attachment), Group 2 (bar-and-clip attachment), and Group 3 (kerator attachment), respectively. The intergroup comparison of mean Modified Sulcular Bleeding Index at the time of loading and at 6 months after loading and change in index from 3 to 6 months was done using the post hoc Bonferroni test. The mean Modified Sulcular Bleeding Index at 6 months after loading and change in index from 3 to 6 months were significantly high in Group 2 (bar-and-clip attachment) in comparison to Group 1 (ball-and-socket attachment), which was significantly in Group 3 (kerator attachment).
These results highlight the high deterioration of gingival health in Group 2 (bar-and-clip attachments) when compared to Group 1 (ball-and-socket attachment) and Group 3 (kerator attachment). Trakas et al.[11] using the same index reported that regarding the ball or bar design, either design does not affect the peri-implant condition. However, another study done by Wismeijer et al.[11] indicated that there is less bleeding associated with ball attachments when compared to single bar-2 implants or triple bar-implant scenarios. Krennmair et al.[12] stated that with regard to peri-implant conditions, Modified Sulcular Bleeding Index showed no differences between ball anchors and locator attachments, confirming that both types of attachments allow for adequate cleaning care by the patient population and thus acceptable hygiene findings.
Plaque Index has been used as a measure of oral hygiene maintenance and has been utilized here for estimating the amount of plaque deposition seen on the abutment. Plaque is considered the most important etiological factor in peri-implantitis. At the time of loading (3 months after implant placement), Plaque Index values were 0.60, 0.60, and 0.60 for Group 1 (ball-and-socket attachment), Group 2 (bar-and-clip attachment), and Group 3 (kerator attachment), respectively, whereas the corresponding values 6 months after loading were 1.0, 1.20, and 0.80 for Group 1 (ball-and-socket attachment), Group 2 (bar-and-clip attachment), and Group 3 (kerator attachment), respectively, and values of change in the Plaque Index from 3 to 6 months were 0.40, 0.60, and 0.20 for Group 1 (ball-and-socket attachment), Group 2 (bar-and-clip attachment), and Group 3 (kerator attachment), respectively. The mean Plaque Index 6 months after loading and change in index from 3 to 6 months were significantly high in Group 2 (bar-and-clip attachment) in comparison to Group 1 (ball-and-socket attachment), which was significantly high in Group 3 (kerator attachment). Krennmair et al.[12] stated that with regard to peri-implant conditions, Plaque Index showed no differences between ball anchors and locator attachments, confirming that both types of attachments allow for adequate cleaning care by the patient population and thus acceptable hygiene findings.
The primary limitation of this study was the small sample size of patients and the limited duration of the follow-up period which was only 6 months after loading. Any results obtained in implantology cannot be validated until long-term follow-up has been conducted for number of years.
Although periapical radiography has been utilized in many previous studies, it cannot be considered infallible when it comes to measuring crestal bone loss. This technique precludes the measurement of facial and lingual bone levels which might be considered equally important in determining implant success. The use of cone-beam computed tomography might have given more accurate results.
Many parameters regarding peri-implant tissue health have been included in this study, but there are others which have been left out including the peri-implant probing depth, bone density, Gingival Index, and Calculus Index. The prime reason of doing so was the inability of the single researcher to follow so many parameters.
CONCLUSION
Within the limitations of the study, the following conclusions were made:
There was no significant difference in the mean marginal bone loss at site A and site B at the time of loading (3 months after implant placement) and at 6 months after loading and change in marginal bone loss from 3 to 6 months between Group 1 (ball-and-socket attachment), Group 2 (bar-and-clip attachment), and Group 3 (kerator attachment)
The mean Modified Sulcular Bleeding Index 6 months after loading and change in index from 3 to 6 months were significantly high in Group 2 (bar-and-clip attachment) in comparison to Group 1 (ball-and-socket attachment), which was significantly high in Group 3 (kerator attachment)
The mean Plaque Index 6 months after loading and change in index from 3 to 6 months were significantly high in Group 2 (bar-and-clip attachment) in comparison to Group 1 (ball-and-socket attachment), which was significantly high in Group 3 (kerator attachment).
Declaration of patient consent
The authors certify that they have obtained all appropriate patient consent forms. In the form the patient(s) has/have given his/her/their consent for his/her/their images and other clinical information to be reported in the journal. The patients understand that their names and initials will not be published and due efforts will be made to conceal their identity, but anonymity cannot be guaranteed.
Financial support and sponsorship
Nil.
Conflicts of interest
There are no conflicts of interest.
REFERENCES
- 1.Varshney N, Aggarwal S, Kumar S, Singh SP. Retention and patient satisfaction with bar-clip, ball and socket and kerator attachments in mandibular implant overdenture treatment: An in vivo study. J Indian Prosthodont Soc. 2019;19:49–57. doi: 10.4103/jips.jips_281_18. [DOI] [PMC free article] [PubMed] [Google Scholar]
- 2.Wismeijer D, Van Waas MA, Vermeeren JI, Mulder J, Kalk W. Patient satisfaction with implant-supported mandibular overdentures. A comparison of three treatment strategies with ITI-dental implants. Int J Oral Maxillofac Surg. 1997;26:263–7. doi: 10.1016/s0901-5027(97)80864-8. [DOI] [PubMed] [Google Scholar]
- 3.Kim Y, Oh TJ, Misch CE, Wang HL. Occlusal considerations in implant therapy: Clinical guidelines with biomechanical rationale. Clin Oral Implants Res. 2005;16:26–35. doi: 10.1111/j.1600-0501.2004.01067.x. [DOI] [PubMed] [Google Scholar]
- 4.Chou CT, Morris HF, Ochi S, Walker L, DesRosiers D. AICRG, part II: Crestal bone loss associated with the Ankylos implant: Loading to 36 months. J Oral Implantol. 2004;30:134–43. doi: 10.1563/1548-1336(2004)30<134:APICBL>2.0.CO;2. [DOI] [PubMed] [Google Scholar]
- 5.Ahuja S, Cagna DR. Defining available restorative space for implant overdentures. J Prosthet Dent. 2010;104:133–6. doi: 10.1016/S0022-3913(10)60107-2. [DOI] [PubMed] [Google Scholar]
- 6.Ghoveizi R, Alikhasi M, Siadat MR, Siadat H, Sorouri M. A radiographic comparison of progressive and conventional loading on crestal bone loss and density in single dental implants: A randomized controlled trial study. J Dent (Tehran) 2013;10:155–63. [PMC free article] [PubMed] [Google Scholar]
- 7.Elsyad MA, Shoukouki AH. Resilient liner vs. clip attachment effect on peri-implant tissues of bar-implant-retained mandibular overdenture: A 1-year clinical and radiographical study. Clin Oral Implants Res. 2010;21:473–80. doi: 10.1111/j.1600-0501.2009.01879.x. [DOI] [PubMed] [Google Scholar]
- 8.El-Makaky YM. Clinical and radiographical evaluation of osseointegration around immediate endosseous implant using fresh-frozen bone allograft. J Am Sci. 2013;98s:90–7. [Google Scholar]
- 9.Mombelli A, Lang NP. Clinical parameters for the evaluation of dental implants. Periodontol 2000. 1994;4:81–6. doi: 10.1111/j.1600-0757.1994.tb00008.x. [DOI] [PubMed] [Google Scholar]
- 10.Vercruyssen M, Quirynen M. Long-term, retrospective evaluation (implant and patient-centred outcome) of the two-implant-supported overdenture in the mandible. Part 2: Marginal bone loss. Clin Oral Implants Res. 2010;21:466–72. doi: 10.1111/j.1600-0501.2009.01902.x. [DOI] [PubMed] [Google Scholar]
- 11.Trakas T, Michalakis K, Kang K, Hirayama H. Attachment systems for implant retained overdentures: A literature review. Implant Dent. 2006;15:24–34. doi: 10.1097/01.id.0000202419.21665.36. [DOI] [PubMed] [Google Scholar]
- 12.Krennmair G, Seemann R, Fazekas A, Ewers R, Piehslinger E. Patient preference and satisfaction with implant-supported mandibular overdentures retained with ball or locator attachments: A crossover clinical trial. Int J Oral Maxillofac Implants. 2012;27:1560–8. [PubMed] [Google Scholar]
- 13.Cune M, Burgers M, van Kampen F, de Putter C, van der Bilt A. Mandibular overdentures retained by two implants: 10-year results from a crossover clinical trial comparing ball-socket and bar-clip attachments. Int J Prosthodont. 2010;23:310–7. [PubMed] [Google Scholar]
- 14.Oetterli M, Kiener P, Mericske-Stern R. A longitudinal study on mandibular implants supporting an overdenture: The influence of retention mechanism and anatomic-prosthetic variables on periimplant parameters. Int J Prosthodont. 2001;14:536–42. [PubMed] [Google Scholar]