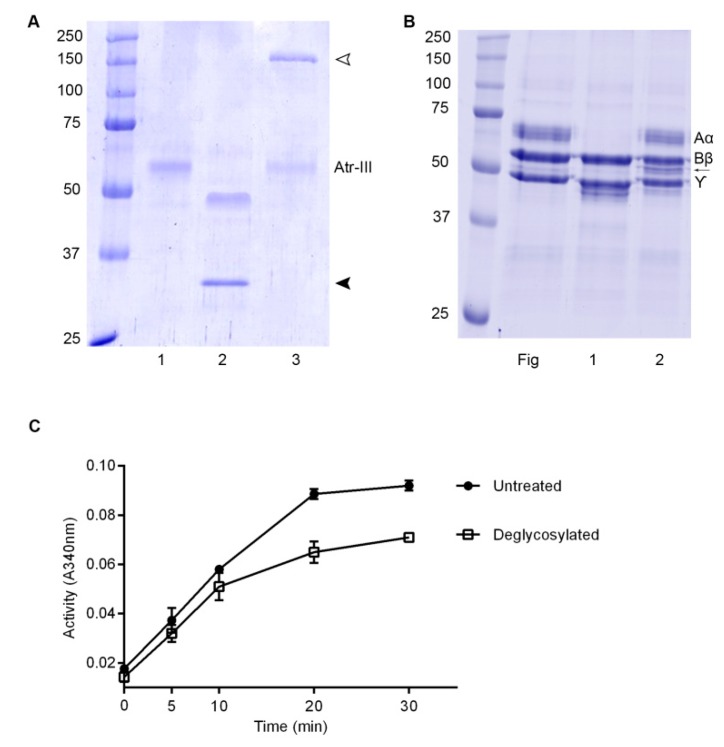
Figure 6.
Deglycosylation of Atr-III. (A) SDS-PAGE (12% gel) of Atr-III untreated (1), or after treatment with PNGase F (2) or O-glycosidase (3), a band at ~35 kDa in lane 2 is an excess of PNGase F (indicated by a black arrow head) and a band at ~150 kDa is O-glycosidase (open arrow head). (B) Undigested fibrinogen (Fg), and Fg digested with Atr-III (1) or Fg treated with N-deglycosylated Atr-III (2). Molecular mass markers are shown in the left lanes of (A,B). (C) DMC hydrolysis by Atr-III (2 µg) without (-●-) or with prior treatment with PNGase F (-□-). Results are presented as SD (n = 3). Note that loss of N-deglycosylation affected the venom enzyme activity.

