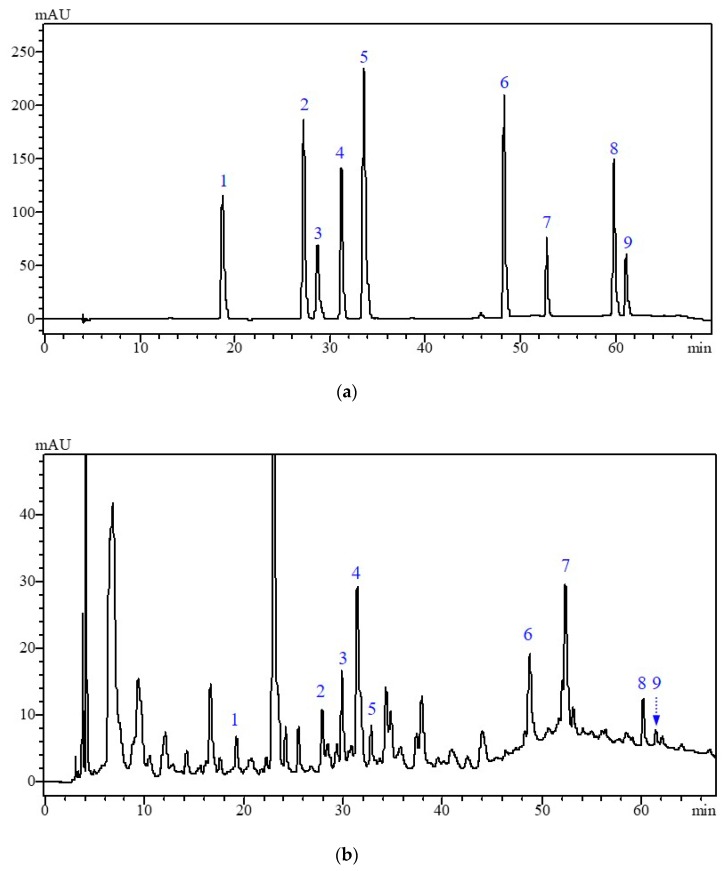
Figure 4.
HPLC-PAD chromatograms of phenolic standard (a) and individual phenolic compounds from broccoli (b) at 280 nm. Peaks 1, 2, 3, 4, 5, 6, 7, 8, and 9 represent catechin, hydroxybenzoic acid, chlorogenic acid, caffeic acid, ferulic acid, sinapic acid, rutin, cinnamic acid, and quercetin, respectively.

