Abstract
Mesangial proliferative glomerulonephritis (MsPGN) is an inflammatory disease, but both the nature of disease progression and its regulation remain unclear. In the present study, we monitored the course of anti-Thy1 nephritis from days 1 to 5 and established gene expression profiles at each time point using microarrays to explore the development of inflammation. According to the gene expression profiles, macrophage infiltration (triggered by CCL2 activation) was evident on day 1 and enhanced inflammation over the next few days. We screened for genes with expression levels similar to CCL2 and found that the upregulation of the circadian gene albumin D-site-binding protein (DBP) was involved in CCL2 activation in mesangial cells. More importantly, CCL2 expression showed oscillatory changes similar to DBP, and DBP induced peak CCL2 expression at 16:00 a clock on day 1 in the anti-Thy1 nephritis model. We knocked down DBP through transfection with a small interfering RNA (siRNA) and used RNA sequencing to identify the DBP-regulated TNF-α-CCL2 pathway. We performed chromatin immunoprecipitation sequencing (ChIP-Seq) and the dual luciferase assay to show that DBP bound to the TRIM55 promoter, regulating gene expression and in turn controlling the TNF-α-CCL2 pathway. In conclusion, DBP-regulated circadian CCL2 expression by the TRIM55-TNF pathway in injured mesangial cells at an early stage, which promoted macrophage recruitment and in turn triggered infiltration and inflammation in a model of anti-Thy1 nephritis.
Keywords: Mesangial proliferative glomerulonephritis, DBP, CCL2, Trim 55, Macrophage
Introduction
Mesangial proliferative glomerulonephritis (MsPGN), one of the most common forms of glomerulonephritis worldwide, occurs in all age groups and often triggers end-stage renal disease (ESRD). MsPGN is characterized by glomerular mesangial cell (MC) proliferation, accompanied by extracellular matrix (ECM) expansion, and is generally considered an inflammatory disease. However, the pathological mechanism remains largely elusive. A rat model of Thy-1 nephritis (Thy-1N) is widely used to simulate the features of human disease.1 The model is characterized by early acute mesangiolysis with cell death, MC over-proliferation, and ECM accumulation. The initial mechanism features the binding of an anti-Thy1 antibody to Thy-1 in MC membranes, triggering a complement response and subsequent MC injury, such as cell death.2,3 During this process, an inflammatory response develops and immune cells, including monocytes and T cells, infiltrate the glomerulus and release inflammatory factors that stimulate MC proliferation.4,5
In the kidney, the circadian clock plays a crucial role in maintaining blood pressure, hormone secretion, and sodium/potassium balance. In the loop of the circadian clock, core clock genes, including Arnt-like protein-1 (BMAL1), CLOCK, Period Circadian Clock (PER), and Circadian Clock Protein (CRY), regulate the transcription of clock-controlled genes, such as albumin D-site-binding protein (DBP) and E4bp4, and in turn mediate metabolism, endocrine regulation, pharmacokinetics and fibrosis.6–8 DBP is a member of the PAR (proline- and acid-rich) superfamily of b/ZIP transcriptional factors that specifically recognizes 5′-RTTAYGTAAY-3′ (R=A/G and Y=C/T) sequences in the promoter and thereby triggers the transcription of genes that regulate metabolic disorders, oxidative stress, hormone receptor abnormalities, and other disease processes.9,10 Moreover, DBP is also related to inflammation. DBP expression is upregulated in synovial tissues of subjects with rheumatoid arthritis presenting with high levels of inflammatory cytokines, whereas TNF inhibits DBP expression.11,12 The inflammatory response is the key mechanism underlying the progression of mesangial proliferative nephritis. Therefore, we examined the role of DBP in regulating inflammation in mesangial cells that in turn promote immune cell chemotaxis to trigger the inflammatory cascade in a model of anti-Thy1 nephritis.
Results
Mesangiolysis and immune cell infiltration in the kidney were the main characteristics of the early phase of anti-Thy1 nephritis
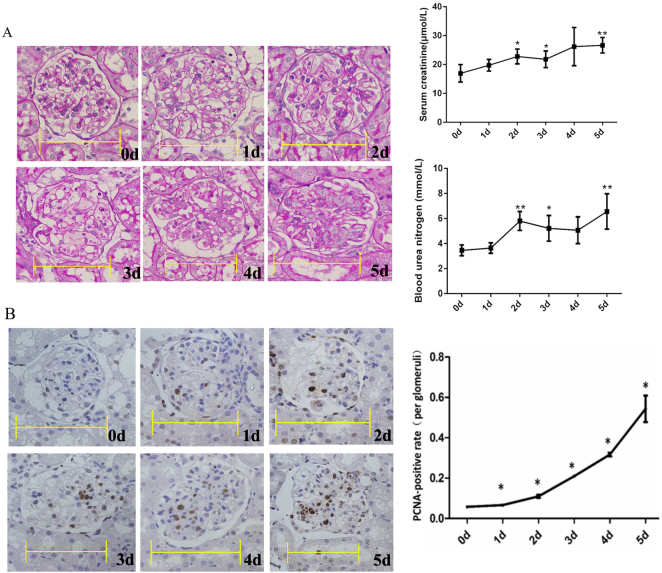
Periodic acid-Schiff (PAS) staining showed the commencement of mesangial dissolution on day 1 and its peak on day 3 (the mesangiolysis phase); cell proliferation commenced on days 4 and 5 (the proliferative phase) (Fig. 1a). In the mesangiolysis phase, the number of MCs decreased, and then the number of MCs began to increase from days 3 to 5 during the proliferative phase. The serum creatinine and blood urea nitrogen (BUN) levels increased from days 2 to 5 (Fig. 1a). The extent of proliferating cell nuclear antigen (PCNA) immunohistochemical staining increased from days 1 to 5 (Fig. 1b).
Fig. 1.
Periodic acid-Schiff (PAS) staining and proliferating cell nuclear antigen (PCNA) immunohistochemical staining during the development of anti-Thy1 nephritis. a PAS staining, and serum creatinine and blood nitrogen levels. b PCNA immunohistochemical staining. The percentage of PCNA-positive cells was calculated as the number of positive cells relative to the number of total glomerular cells (10–15 glomeruli were counted for each rat). Scale bars=10 μm. 0 d: Control group: 1–5 d: Days after the injection of the anti-Thy1 antibody. *p < 0.05, **p < 0.01; n = 4
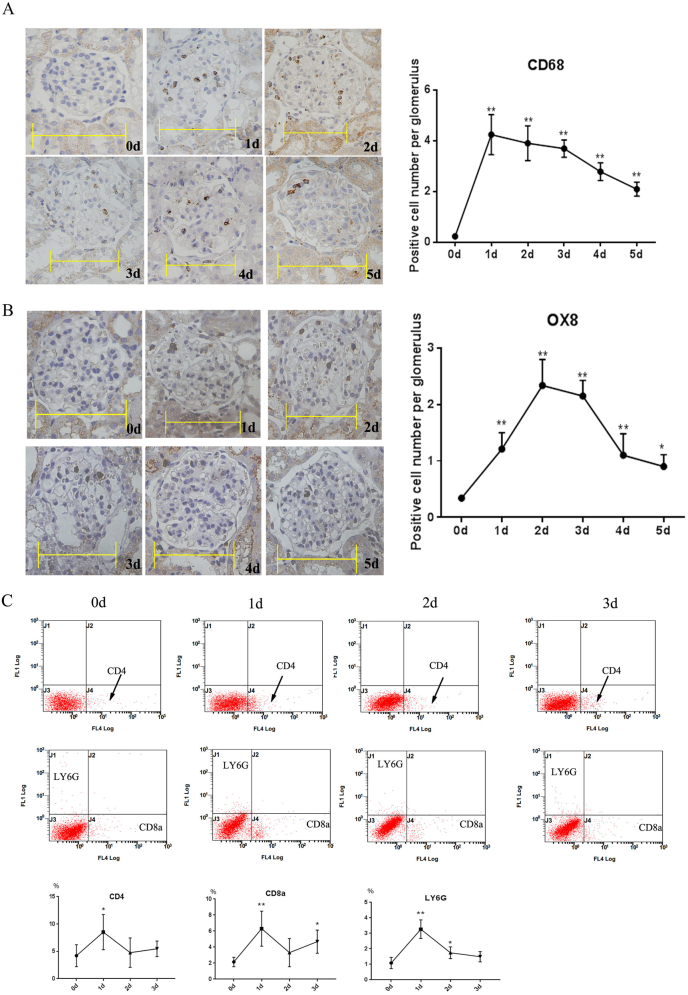
CD68 immunohistochemical staining exhibited a peak in macrophage infiltration on day 1 that decreased to normal levels from days 2 to 5 (Fig. 2a). OX8 immunohistochemical staining showed that CD8+ T cell infiltration peaked on days 2 and 3 and then decreased to normal levels from days 4 to 5 (Fig. 2b). According to the flow cytometry results, CD4+, CD8+ T cells and neutrophils peaked on day 1 and decreased on days 2 and 3 (Fig. 2c). On the basis of these results, the initial infiltration of immune cells was the main characteristic of the mesangiolysis phase.
Fig. 2.
Immune cell infiltration during the development of anti-Thy1 nephritis. a CD68 staining was used to detect macrophage infiltration. b OX8 staining was used to detect CD8+ T cell infiltration. c Infiltration of immune cells, including CD4+ and CD8+ T cells and neutrophils (LY6-G), in the glomerulus was detected by flow cytometry. 0 d: Control group; 1–5 d: days after the injection of the anti-Thy1 antibody. Scale bars=10 μm. *p < 0.05. **p < 0.01; n = 4
Microarray analysis of the expression of inflammatory genes from days 1 to 3 in a rat model of anti-Thy1 nephritis
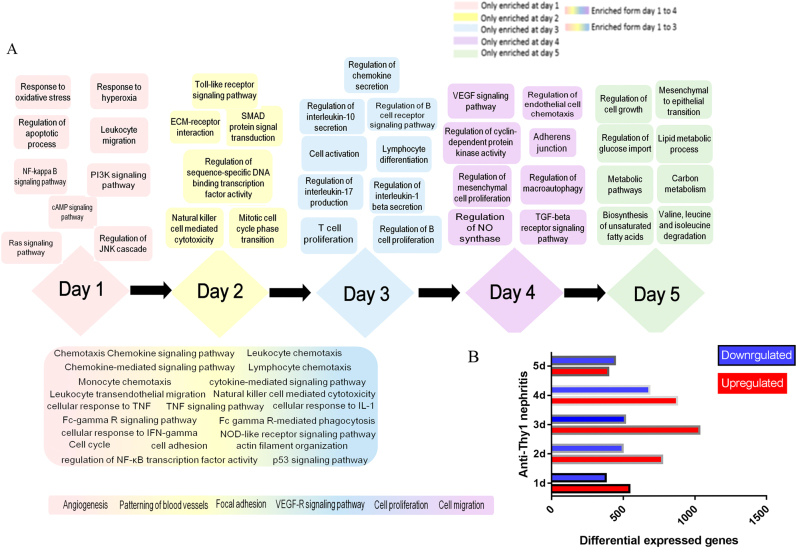
We subjected glomerular messenger RNAs (mRNAs) prepared on days 1 to 5 to a microarray analysis. In terms of differentially expressed genes (DEGs), 544 DEGs were upregulated and 379 DEGs were downregulated on day 1; the numbers of up- and downregulated DEGs observed on days 2, 3, 4, and 5 were 1771 and 497, 1032 and 514, 876 and 683, and 396 and 443, respectively (Fig. 3). We explored the evolution of biological functions over time. Many pathways associated with the inflammatory response, cell proliferation and apoptosis, oxidative stress, energy metabolism, blood vessel formation, autophagy, and other related signaling pathways and biological processes emerged sequentially from days 1 to 5 (Fig. 3). More importantly, activation of inflammation was the principal trigger of MC proliferation. In the early phase of nephritis (days 1 to 3), injured or apoptotic MCs triggered inflammatory pathways (i.e., the tumor necrosis factor-alpha [TNF]-α, chemokine signaling, and NF-kappa-B signaling pathway); these pathways drove leukocyte, monocyte, and lymphocyte chemotaxis, in turn stimulating MC proliferation on days 4 to 5.
Fig. 3.
Evolution of biological functions during the development of anti-Thy1 nephritis. a Evolution of biological functions during the development of anti-Thy1 nephritis. b Number of differentially expressed genes (DEGs) at each time point. 0 d: Control group, 1–5 d: days after the injection of the anti-Thy1 antibody
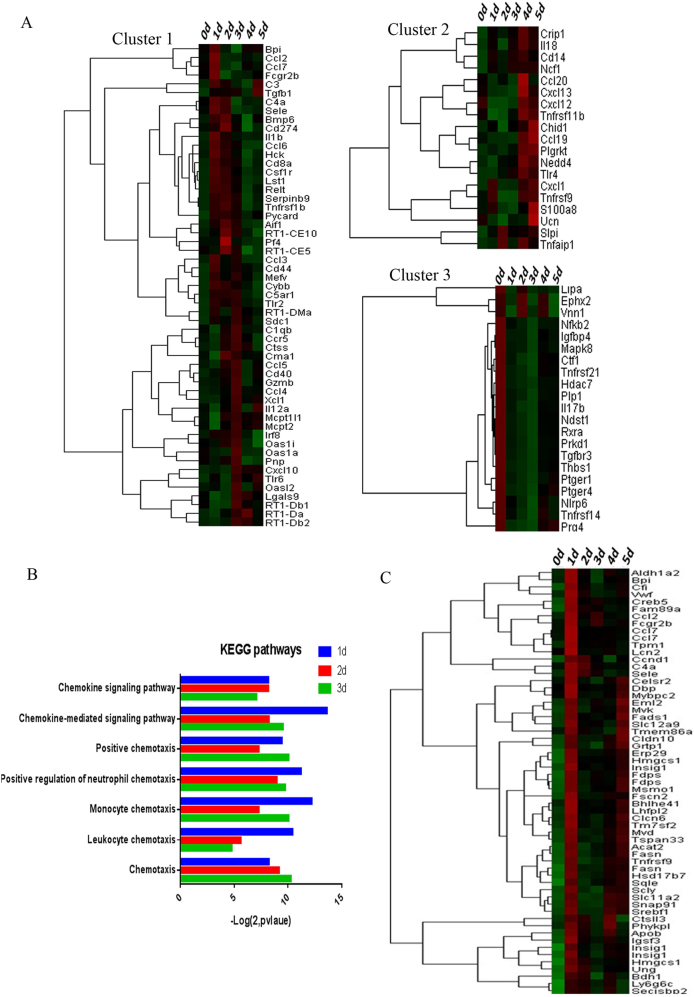
We used a cluster analysis to explore the regulation of inflammation. We identified three trends (Fig. 4a). Cluster 1 included genes encoding complement components (C3, C4a, and C5AR1; peaking on day 1) and chemokines (CCL2-4 and CCL6-7; peaking on days 1/2; and CCR5 and CXCL10 were overexpressed on days 1 to 3 and peaked on day 3). Cluster 2 included genes encoding chemokines (CXCL1, CCL19, CCL20, CXCL12, and CXCL13) that were upregulated from days 4 to 5; and Cluster 3 genes encoded FKB2, TGFBR3, PEGER1, IL17b, and PTGER4 (downregulated from days 1 to 5). Thus, various inflammatory mechanisms were involved in the mesangiolysis and proliferative phases. Chemotaxis was principally activated from days 1 to 3 (Fig. 4b), illustrating that inflammation was activated in injured MCs from days 1 to 3 and chemotaxis was the principal immune effector.
Fig. 4.
Trends in the expression of genes involved in the inflammation. a The cluster analysis identified three groups. Cluster 1 contained genes that were upregulated from days 1 to 3; Cluster 2 genes were upregulated from days 4 to 5; and Cluster 3 genes were downregulated from days 1 to 5. b The immunity/inflammation-associated Korean Encyclopedia of Genes and Genomes (KEGG) pathway was significantly activated from days 1 to 3. c DEGs expressed at similar levels as CCL2 were identified by cluster filtration. 0 d: Control group; 1–5 d: days after the injection of the anti-Thy1 antibody
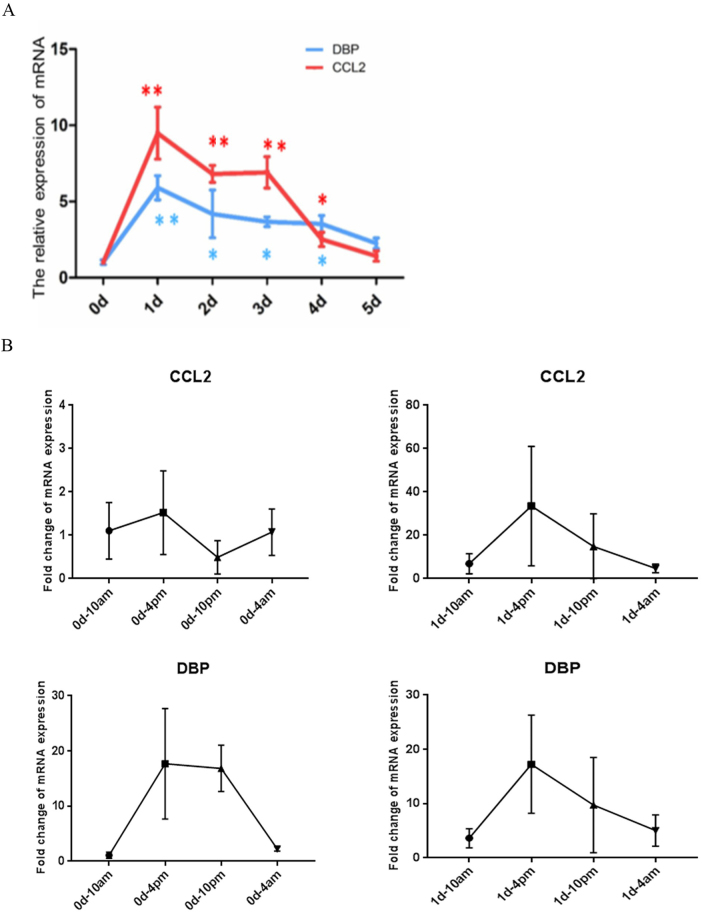
More importantly, CCL2 expression peaked on day 1 and was the major trigger of macrophage infiltration. CCL2 is principally associated with the activation of the TNF-α signaling pathway; the TNF-α level also peaked on day 1 during the development of anti-Thy1 nephritis.13 We performed a cluster analysis to identify DEGs with expression levels similar to CCL2. The transcriptional factors Creb5, DBP, and Srebf1 exhibited similar expression levels to CCL2; DBP was the maximally upregulated gene (Figs. 4c and 5a). Therefore, we sought to determine the relationship between DBP and CCL2.
Fig. 5.
The circadian expression of DBP and CCL2 on day 1 in the anti-Thy1 nephritis model. a Trends in CCL2 and DBP expression during the development of anti-Thy1 nephritis, as revealed by quantitative polymerase chain reaction (qPCR). b The circadian expression of CCL2 in the control group and anti-Thy1 nephritis group on day 1, as revealed by qPCR. c The circadian expression of CCL2 in the control group and anti-Thy1 nephritis group on day 1, as revealed by qPCR
DBP induced the peak of CCL2 gene expression at 16:00 a clock on day 1
Since DBP is a CLOCK output gene, we deduced that DBP may regulate circadian CCL2 gene expression. In the control group, CCL2 expression in the glomerulus was stable from the light to dark periods, and DBP expression peaked at 16:00 and 22:00. Meanwhile, in the anti-Thy1 nephritis group, CCL2 expression showed an oscillatory change on day 1, with a peak at 16:00, similar to the circadian pattern of DBP circadian (Fig. 5b, c). Thus, DBP may regulate the circadian expression of CCL2 in the early phase of anti-Thy1 nephritis.
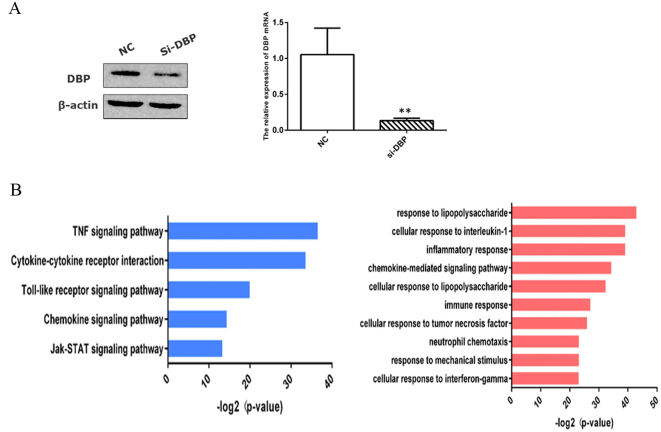
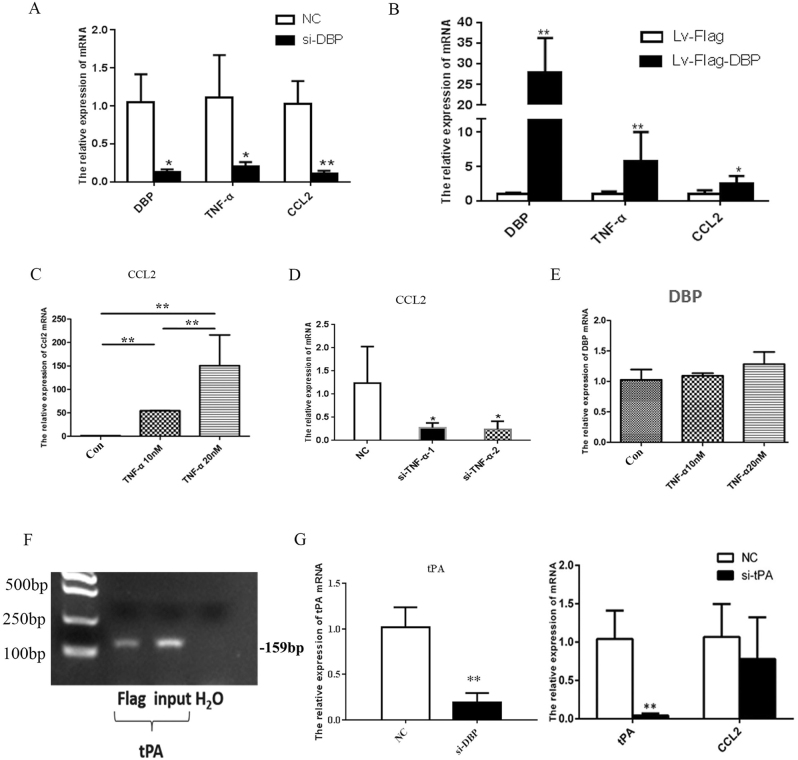
We established an in vitro model of DBP-knockdown primary MCs to explore the interaction between DBP and CCL2. We used RNA-seq to examine gene expression profiles. According to the results of the Korean Encyclopedia of Genes and Genomes (KEGG) pathway analysis, low-level DBP expression inhibited TNF-α signaling, receptor interaction, and the Toll-like and chemotaxis signal pathways. On the basis of the gene ontology (GO) enrichment results, DBP downregulation inhibited chemokine-mediated signaling and the cellular response to TNF-α (Fig. 6a, b). We used qPCR to show that a small interfering RNA (siRNA) targeting DBP (siDBP) inhibited the TNF-CCL2 pathway and that DBP overexpression exerted the opposite effect (Fig. 7a, b). We confirmed that TNF-α stimulation upregulated CCL2 expression and that an siRNA targeting TNF (siTNF) inhibited CCL2 expression. However, TNF-α had no effect on DBP expression (Fig. 7c–e). Therefore, DBP regulated the TNF-α-CCL2 pathway, and TNF-α did not exert a feedback effect.
Fig. 6.
RNA-seq revealed that D-site-binding protein (DBP) regulated the tumor necrosis factor-alpha (TNF-α) pathway. a DBP knockdown in primary mesangial cells (MCs) transfected with a small interfering RNA (siRNA), as revealed by Western blotting and qPCR. b The RNA-seq data were analyzed in terms of both KEGG pathways (left panel) and biological processes (right panel). siDBP, small interfering RNA (siRNA) targeting DBP; NC, negative control siRNA. *p < 0.05, **p < 0.01; n = 3. All assays were repeated at least three times
Fig. 7.
DBP regulated the TNF-α-CCL2 pathway in a tPA-independent manner. a siDBP inhibited the TNF-α-CCL2 pathway. b DBP overexpression had the opposite effect, as evidenced by qPCR. c Recombinant TNF-α (at 10 and 20 nM) upregulated CCL2 expression. d siTNF-α inhibited CCL2 expression. e Recombinant TNF-α (at 10 and 20 nM) had no effect on DBP expression. f DBP bound to the tPA promoter, as revealed by the chromatin immunoprecipitation assay. g siDBP inhibited tPA expression. h tPA knockdown did not inhibit CCL2 expression. *p < 0.05, **p < 0.01; n = 3. All assays were repeated at least three times
DBP regulated CCL2 expression by targeting the TRIM55 gene
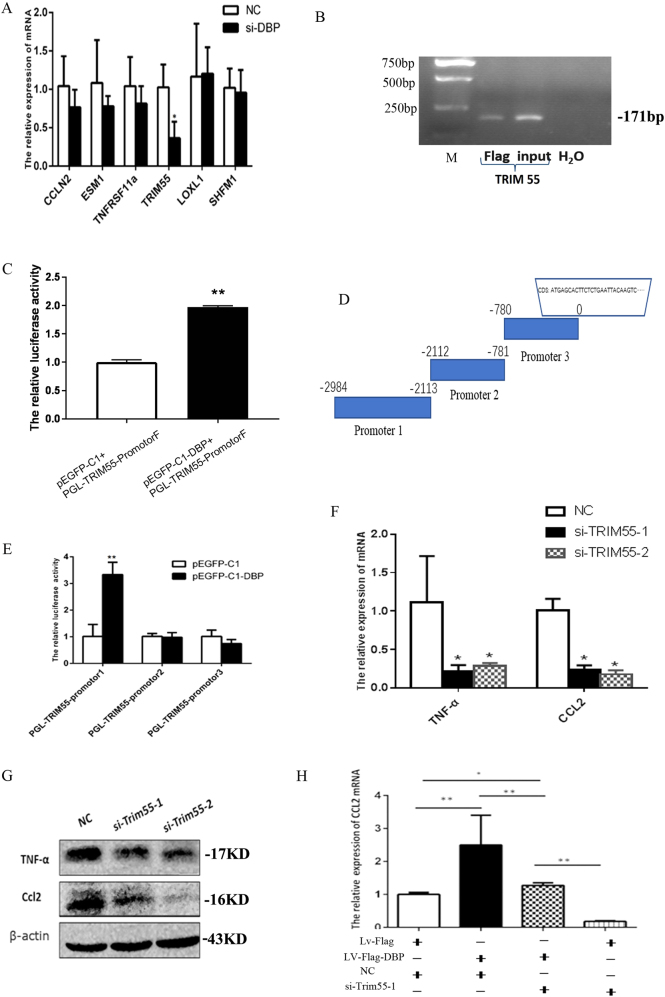
The transcription factor DBP binds to the tPA, CYP2A4, and CYP2A5 genes (tPA is only expressed in the kidney).10,14 We first explored how DBP-tPA affected CCL2 expression. As shown in the results of the chromatin immunoprecipitation assay, DBP bound to the tPA promoter (Fig. 7f) and DBP knockdown inhibited tPA expression (Fig. 7g). However, tPA knockdown did not inhibit CCL2 expression (Fig. 7h), showing that DBP regulated CCL2 expression in a tPA-independent manner. We performed chromatin immunoprecipitation sequencing (ChIP-Seq) to screen for other potential DBP target genes. We filtered the ChIP-Seq results based on the known DBP binding sequence 5′-RTTAYGTAAY-3′, and identified seven candidate genes: Kcnh6, Loxl1, TRIM55, Tnfrsf11a, Esm1, Ccnl2, and Dnajb9. We used qPCR to confirm that DBP downregulation triggered obvious TRIM55 downregulation but had no effect on the expression of the other six genes (Fig. 8a).
Fig. 8.
DBP regulated CCL2 expression via the target gene TRIM55. a siDBP inhibited TRIM55 mRNA expression, but not the expression of six other genes. b DBP bound to the TRIM55 promoter, as revealed by chromatin immunoprecipitation sequencing (ChIP)-PCR. c DBP bound to the TRIM55 promoter (-2984 bp), as revealed by the dual luciferase assay. d The TRIM55 promoter was divided into three subregions. e The dual luciferase assay indicated that DBP specifically bound to the -2116–2984-bp region. f, g: siTRIM55-1 and siTRIM55-2 significantly inhibited TNF-α and CCL2 expression at both the mRNA and protein levels in MCs. h The rescue assay showed that DBP-mediated CCL2 upregulation was blocked by si-TRIM55-1. si-TRIM55-1 and si-TRIM55-2, two siRNAs targeting TRIM55; Lv-Flag, lentivirus control; Lv-Flag-DBP: DBP-expressing lentivirus. *p < 0.05, **p < 0.01; n = 3. All assays were repeated at least three times
We used ChIP-PCR to confirm that DBP bound to the TRIM55 promoter (Fig. 8b). We also cloned the TRIM55 promoter (-2984 bp) and used the dual luciferase assay to show that DBP bound to the promoter (Fig. 8c). We divided the TRIM55 promoter region into three subregions and analyzed them separately (Fig. 8d). The results of the dual luciferase assay revealed that DBP bound to the region at −2116 to 2984 bp (Fig. 8e). Thus, TRIM55 is the target of the transcription factor DBP. We explored the effect of TRIM55 status on the TNF-CCL2 pathway; siTRIM55 significantly inhibited TNF-α and CCL2 expression at both the mRNA and protein levels in MCs (Fig. 8f, g). Furthermore, according to the results of the rescue assay, DBP-mediated CCL2 overexpression was blocked by TRIM55 downregulation (Fig. 8h). Therefore, the transcription factor DBP regulates the TNF-CCL2 pathway via the target gene TRIM55.
Discussion
We explored how immune cells infiltrated the glomerulus during days 1–5 of the development of anti-Thy1 nephritis. Previous studies have exclusively focused on the inflammatory response in the proliferative phase (days 4–7).4,15 The infiltration of immune cells, including macrophages, CD4+ T cells, CD8+ cells and neutrophils, peaked in the mesangiolysis phase (days 1–3). The infiltration of these cells plays an important role in the progression of both anti-Thy1 nephritis4,15,] and immunoglobulin A (IgA) nephritis.16,17 On the basis of the glomerular gene expression profiles, immune cell infiltration initially triggers inflammation on day 1, which plays a crucial role in the development of anti-Thy1 nephritis. The inhibition of immune cell infiltration alleviated MC proliferation and ECM accumulation.18,19 The numbers of immune cells were significantly decreased during the proliferative phase, providing a potential explanation for the observation that few immune cells are present in biopsy material from patients with IgA nephritis exhibiting medium-to-high levels of MC proliferation.
Macrophage infiltration plays a key role in the development of mesangial proliferative nephritis and inhibition of macrophage infiltration significantly alleviates inflammation, and in turn MC proliferation, in mesangioproliferative models, including the rat model of anti-Thy1 nephritis and mouse model of IgA nephritis.4,20–22 Our microarray data revealing that both the TNF-α pathway and CCL2 were upregulated on day 1 are consistent with the data from a previous report.13 CCL2 drives mononuclear macrophage infiltration.16,23–25 However, upstream regulators (particularly transcription factors) of the CCL2 pathway remain unknown. In the present study, DBP was an upstream regulator of CCL2 expression. On one hand, the upregulation of DBP expression stimulated the upregulation of CCL2 expression. On the other hand, DBP-mediated circadian CCL2 expression on day 1 in the anti-Thy1 nephritis model. This important finding confirms that CCL2 expression exhibited circadian changes in response to stress, and DBP induced peak CCL2 expression at 16:00 a clock. More importantly, our microarray and CHIP-Seq data confirm that DBP regulated the TNF-α-CCL2 pathway by binding to a new target gene, TRIM55, a member of the TRIM family characterized by a tripartite motif containing a RING zinc finger domain, one or two B-box zinc finger domains, and a coiled-coil region. TRIM proteins regulate the immune system, autophagy, and tumorigenesis.26,27 TRIM55 serves as a transient adapter protein during muscle sarcomere assembly, binding to the cytoskeletal proteins in microtubules, titin, and nascent myosin filaments.28,29 TRIM55 also serves as an E3 ubiquitin ligase regulating protein degradation.30 We speculate that TRIM55 may regulate signaling pathways by affecting the cytoskeleton or E3-mediated ubiquitin ligation to various proteins involved in the TNF-α-CCL2 pathway. However, DBP was not affected by TNF-α, a finding that was not consistent with a previous report using rheumatoid synovial cells.12 On the basis of these findings, DBP is the upstream regulator of TNF-α-CCL2 activation in mesangial cells. Nevertheless, the mechanism by which DBP exclusively mediates circadian CCL2 expression in injured mesangial cells during the early phase remains unknown. Further studies needed to identify this mechanism.
In conclusion, immune cell infiltration into the glomerulus triggered inflammation at an early stage of the development of anti-Thy1 nephritis. DBP-driven circadian CCL2 expression played a crucial role in macrophage infiltration, and our results provide new insights into the mechanism of mesangial proliferative nephritis.
Materials and Methods
Anti-Thy1 nephritis model
A total of 36 Sprague-Dawley (SD) rats weighing 200 g were provided by the Animal Experimentation Unit of the PLA General Hospital. All rats were housed in an animal care facility under a light/dark cycle of 12/12 h, with free access to food and water. Welfare-related assessments and interventions were performed throughout the experiment. In total 30 rats were injected with a mouse anti-Thy1 monoclonal antibody, as described previously,31 and six were injected with saline (controls). Six rats per group were killed under ether anesthesia at 10:00 a clock on days 0–5. Glomeruli were purified from the renal cortex tissue using a sieving method.32 Sera were collected for measurements of BUN and creatinine levels. Moreover, 12 SD rats were used to construct the anti-Thy1 nephritis model for flow cytometry analysis with four rats used as controls. Anti-Thy1 model rats were sacrificed on days 1, 2, and 3. Glomeruli were harvested.
A total of 32 SD rats weighing 200 g were used for circadian research. Approximately 18 rats were injected with saline and killed at 10:00, 16:00, 22:00 and 4:00 a clock (four rats per time point). Moreover, 18 additional rats were injected with a mouse anti-Thy1 monoclonal antibody (four rats per time point). After 24 h (day 1), rats were killed at 10:00, 16:00, 22:00, and 4:00 a clock. Glomeruli were harvested.
All animal welfare and experimental procedures were performed in strict accordance with the Guide for the Care and Use of Laboratory Animals (USA National Research Council, 1996).
PCNA staining
An immunohistochemical assessment of PCNA expression was performed to assess cell proliferation. Paraffin-embedded sections (4-µm-thick) were stained with a mouse monoclonal antibody against PCNA (Cell Signaling Technology, USA). Then, sections were incubated with a biotinylated secondary antibody and horseradish peroxidase (HRP)-streptavidin working buffer (SP-9002 Histostain Plus Kits, ZYMED, USA). The Vecta-stain DAB Kit (Vector Lab, USA) was used as the chromogen. Finally, sections were counterstained with hematoxylin. The percentage of PCNA-positive cells was calculated as the number of positive cells relative to the number of total glomerular cells (4 rats were measured from each group and 10–15 glomeruli were counted for each rat).
Glomerular histology and immunohistochemistry
Kidney tissues were fixed with 10% (v/v) buffered formalin and embedded in paraffin prior to light microscopy. Paraffin-embedded sections (4-µm-thick) were stained with PAS reagent and counterstained with hematoxylin. Rabbit anti-CD68 and anti-OX8 antibodies were used to detect macrophages and the cytotoxic/suppressor CD8+ T cells, respectively, using an indirect immunoperoxidase technique. Antibodies were purchased from Abcam (Cambridge, UK).
Flow cytometry
Leukocytes from rat glomeruli were isolated by enzymatic digestion of tissues with collagenase IV followed by Percoll density gradient (70%/30%) centrifugation. Cells were collected from the interphase. FITC rat anti-mouse LY6-G (Clone RB6-8C5, Abcam, Cambridge, UK), PerCP mouse anti-rat CD8a (Clone OX8, BD Biosciences, USA), and APC mouse anti-rat CD4 (Clone OX-35, BD Biosciences, USA) were used to analyze for surface marker expression. Cells were acquired with the use of the BECKMAN Cytomics FC 500 flow cytometer system and pregated on living cells according to FSC/SSC signals.
Cell culture
Primary rat MCs were cultured as described previously.31 Briefly, glomeruli were purified from the renal cortex tissue of 8–12-week-old rats using sieving methods,32 digested for 15 min at 37 °C with type IV collagenase, and filtered through a 75-μm-pore-diameter stainless steel sieve. The digested samples were centrifuged at 800 rpm for 5 min, and the cell precipitates were resuspended in growth medium (Dulbecco’s Modified Eagle’s Medium (DMEM) supplemented with 15% (v/v) fetal bovine serum (FBS), Gibco-Invitrogen, Carlsbad, CA, USA) and cultured at 37 °C in a humidified incubator with a 5% (v/v) CO2 atmosphere. Cells were used at passages 10–15.
siRNA transfection
The siRNAs were designed and synthesized by GenePharma Co., Ltd. (Beijing, China). The negative control siRNA was a random siRNA that was also provided by GenePharma. On the day before transfection, cells were trypsinized and seeded into six-well plates at a density of 4 × 10⁵ cells/well. Transient siRNA transfection (80 nmol/L) was achieved using Lipofectamine™ (Invitrogen); fresh culture medium was added, the medium was changed after 24 h, and cells were harvested at 48 h. The siRNA sequences were (all 5′ to 3′): siDBP: GGUACAAGAACAAUGAAGC; sitPA: CCTCCCATGGAATTCCATGAT; siTRIM55-1: CCTCACCTCATGTCTATCT;
siTRIM55-2: CCUCGAUGGAAGCAACAAA; siTNF-α-1: CUCAGCCAAUCAUGAAGAA and siTNF-α-2: CAGAUGGGCUGUACCUUAU.
Lentivirus transfection
DBP lentiviruses ( ≥ 1 × 10⁹ TU/mL) expressing the Flag peptide (Lv-Flag-DBP and control Lv-Flag) were prepared by GenePharma. Rat MCs were cultured for 24 h and 20 µL/mL Lv-Flag-DBP and Lv-Flag were added together with 2 µL/mL polybrene (GenePharma), followed by an incubation for 12 h. Fresh medium was added and culture continued for 6 days.
TNF-α stimulation assay
MCs at 40–50% confluence were stimulated with 10 or 20 nM recombinant rat TNF-α (R&D Systems Inc., Minneapolis, MI, USA) and cells were collected after 24 h.
Real-time qPCR
Total RNAs were extracted using the TRIzol reagent (Invitrogen) and reverse-transcribed into cDNAs using a TransScript First-Strand cDNA Synthesis SuperMix kit (TransGen Biotech, Beijing, China), according to the manufacturer’s protocol. TaqMan reagents were purchased from Applied Biosystems Co., Ltd. (Foster City, CA, USA). The level of each mRNA was normalized to the 18S rRNA. Expression was quantitated using the 2−ΔΔCt method.
Western blotting
Cellular proteins were dissociated in RIPA lysis buffer (pH 7.5) (50 mmol/L Tris–HCl, 150 mmol/L NaCl, 0.5% (w/v) deoxycholate, 1% (v/v) Nonidet P-40, 0.1% (w/v) SDS, 1 mM phenylmethylsulfonyl fluoride, and a protease inhibitor cocktail). We used primary rabbit polyclonal antibodies directed against CCL2, TNF-α, a goat polyclonal antibody against TRIM55 (Abcam, Cambridge, UK), a rabbit polyclonal antibody against DBP (Clone H-40, Santa Cruz Biotechnology, Santa Cruz, CA, USA) and a mouse β-actin antibody (Clone AC-15, Sigma, St. Louis, MO, USA) to label bands. Horseradish peroxidase-conjugated secondary antibodies (Beyotime Biotechnology, Shanghai, China) and a chemiluminescence detection system (ChemiDoc-it, UVP Inc., USA) were used to acquire signals from the labeled protein bands.
DBP ChIP-Seq
Chromatin immunoprecipitation was performed as described previously33 using 3 × 10⁷ LV-FLAG-DBP-transfected and LV-FLAG-transfected MCs (the latter was used as the negative control). Cells were crosslinked with 1% (v/v) formaldehyde for 10 min, and nuclear DNA was isolated using an EZ-CHIP-KIT (Millipore, Billerica, MA, USA) and sheared by sonication employing a cell disruptor (Sonics VCX150, Sonics and Materials Inc., Newtown, CT, USA). DNA was allowed to bind to an anti-FLAG affinity gel (Sigma) and eluted with FLAG3 (Sigma). DNA was extracted with phenol/chloroform and 30 ng of DNA were sequenced using the standard Illumina ChIP-seq library kit on a HiSeq2000 platform (Illumina, San Diego, CA, USA). Reads were mapped to the rat genome (hg19) using “bowtie” software.
ChIP-PCR
The ChIP-PCR procedure was similar to that described above. ChIP DNA from LV-FLAG-DBP-transfected cells was used to detect the association between tPA and TRIM55; DNA from LV-FLAG transfected cells served as the control. The tPA primers were: Upper: 5′-CTGCAGAGGAAGACTAAACT-3′ and
Lower: 5′-TGAGAAAAAGCACAACACC-3′.
The TRIM55 primers were: Upper: 5′-CTTCACATTGCCCTCCCTTCCTAA-3′ and
Lower: 5′-GTCACATGACCCTGGACTGACTTGTC-3′. PCR products were separated by 2% (w/v) agarose gel electrophoresis.
Microarray analysis
Three glomeruli each obtained from six rats at each time point were subjected to the microarray analysis. Glomerular RNA was isolated using the TRIzol reagent. The whole-mouse genome Oligo Microarray 4 × 44k V2 gene kit (Agilent, Santa Clara, CA, USA) was used to detect mRNA expression profiles, according to the manufacturer’s instructions. The raw data were normalized using Gene Spring software (ver. 12.6.1; (Silicon Genetics, Redwood City, CA, USA) and compared using Student’s t-test. Genes exhibiting fold changes >2 and p-values < 0.05 were considered DEGs. All datasets have been uploaded to the Gene Expression Omnibus (GEO) site.
RNA-seq
Three samples from siDBP-transfected MCs and three negative control samples were subjected to RNA-seq. Total RNAs were isolated using the TRIzol reagent and subjected to paired-ends 100-bp Illumina sequencing. All libraries were prepared using the TruSeq RNA Sample Preparation Kit (Illumina), according to the manufacturer’s recommendations. High-throughput sequencing was performed on an Illumina HiSeq 2000 platform and the RNA-seq transcript data were analyzed using TopHat/Cufflinks combination software. Genes with false discovery rates (FDRs) < 0.05, p-values < 0.01, and fold changes >1.5 were considered DEGs. All datasets have been uploaded to the GEO database.
Luciferase assay
In total 293 T cells were transfected with pGL4 and pEGFP-C1-DBP (or control pEGFP-C1); the β-galactosidase reporter served as the internal control. After 48 h, firefly luciferase activity was measured using the Luciferase Reporter Assay System (Promega, Madison, WI, USA) and the data were normalized to the β-galactosidase levels. At least three independent experiments were performed.
Bioinformatics
Hierarchical clustering analyses were performed with the aid of Cluster software (ver. 3.0; Eisen Software, http://rana.lbl.gov/EisenSoftware.htm) and the results were compiled using Eisen Software-Tree View. All proteins in a given cluster exhibited similar expression profiles.
The GO enrichment analysis and KEGG pathway analysis were performed using DAVID software (http://david.abcc.nciferf.gov/) and p < 0.05 was considered to reflect statistical significance.
Statistical analysis
All experiments were performed in triplicate and the results are expressed as the means ± SE. All data were analyzed using SPSS software (ver. 20.0; SPSS Inc., Chicago, IL, USA) and compared using Student’s t-test or via one-way ANOVA. A p-value < 0.05 was considered to reflect statistical significance.
Acknowledgements
The work was supported by grants from the National Natural Science Foundation of China (No. 81330019) and the National Basic Research Program of China (Nos. 2014CBA02005 and 2015CB553605).
Competing interests
The authors declare no competing interests.
References
- 1.Liu X, et al. Change of MAX interactor 1 expression in an anti-Thy1 nephritis model and its effect on mesangial cell proliferation. Cell. Physiol. Biochem. 2011;27:391–400. doi: 10.1159/000327966. [DOI] [PubMed] [Google Scholar]
- 2.Gao L, et al. Sublytic complement C5b-9 complexes induce thrombospondin-1 production in rat glomerular mesangial cells via PI3-k/Akt: association with activation of latent transforming growth factor-beta1. Clin. Exp. Immunol. 2006;144:326–334. doi: 10.1111/j.1365-2249.2006.03069.x. [DOI] [PMC free article] [PubMed] [Google Scholar]
- 3.Cantaluppi V, et al. Endothelial progenitor cell-derived extracellular vesicles protect from complement-mediated mesangial injury in experimental anti-Thy1.1 glomerulonephritis. Nephrol. Dial. Transplant. 2015;30:410–422. doi: 10.1093/ndt/gfu364. [DOI] [PubMed] [Google Scholar]
- 4.Aizawa K, et al. Renoprotective effect of epoetin beta pegol by the prevention of M2 macrophage recruitment in Thy-1 rats. J. Nephrol. 2014;27:395–401. doi: 10.1007/s40620-014-0099-3. [DOI] [PubMed] [Google Scholar]
- 5.Miyasato K, et al. CD28 superagonist-induced regulatory T cell expansion ameliorates mesangioproliferative glomerulonephritis in rats. Clin. Exp. Nephrol. 2011;15:50–57. doi: 10.1007/s10157-010-0370-4. [DOI] [PubMed] [Google Scholar]
- 6.Bozek K, et al. Regulation of clock-controlled genes in mammals. PLoS ONE. 2009;4:e4882. doi: 10.1371/journal.pone.0004882. [DOI] [PMC free article] [PubMed] [Google Scholar]
- 7.Yamajuku D, et al. Cellular DBP and E4BP4 proteins are critical for determining the period length of the circadian oscillator. FEBS Lett. 2011;585:2217–2222. doi: 10.1016/j.febslet.2011.05.038. [DOI] [PubMed] [Google Scholar]
- 8.Chen WD, et al. Circadian CLOCK mediates activation of transforming growth factor-beta signaling and renal fibrosis through cyclooxygenase 2. Am. J. Pathol. 2015;185:3152–3163. doi: 10.1016/j.ajpath.2015.08.003. [DOI] [PubMed] [Google Scholar]
- 9.Yuan J, et al. Upregulation of D site of albumin promoter binding protein in the brain of patients with intractable epilepsy. Mol. Med. Rep. 2015;11:2486–2492. doi: 10.3892/mmr.2014.3065. [DOI] [PMC free article] [PubMed] [Google Scholar]
- 10.Lee YH, et al. Multiple, functional DBP sites on the promoter of the cholesterol 7 alpha-hydroxylase P450 gene, CYP7. Proposed role in diurnal regulation of liver gene expression. J. Biol. Chem. 1994;269:14681–14689. [PubMed] [Google Scholar]
- 11.Becker T, et al. Clock gene expression in different synovial cells of patients with rheumatoid arthritis and osteoarthritis. Acta Histochem. 2014;116:1199–1207. doi: 10.1016/j.acthis.2014.07.001. [DOI] [PubMed] [Google Scholar]
- 12.Yoshida K, et al. TNF-alpha modulates expression of the circadian clock gene Per2 in rheumatoid synovial cells. Scand. J. Rheumatol. 2013;42:276–280. doi: 10.3109/03009742.2013.765031. [DOI] [PubMed] [Google Scholar]
- 13.Chen YM, et al. Pentoxifylline attenuates proteinuria in anti-thy1 glomerulonephritis via downregulation of nuclear factor-kappaB and Smad2/3 signaling. Mol. Med. 2015;21:276–284. doi: 10.2119/molmed.2015.00023. [DOI] [PMC free article] [PubMed] [Google Scholar]
- 14.Roussel BD, et al. Age and albumin D site-binding protein control tissue plasminogen activator levels: neurotoxic impact. Brain: J. Neurol. 2009;132:2219–2230. doi: 10.1093/brain/awp162. [DOI] [PMC free article] [PubMed] [Google Scholar]
- 15.Wan YG, et al. Contrasting dose-effects of multi-glycoside of Tripterygium wilfordii HOOK. f. on glomerular inflammation and hepatic damage in two types of anti-Thy1.1 glomerulonephritis. J. Pharmacol. Sci. 2012;118:433–446. doi: 10.1254/jphs.11157FP. [DOI] [PubMed] [Google Scholar]
- 16.Gao J, et al. Genetic variants of MCP-1 and CCR2 genes and IgA nephropathy risk. Oncotarget. 2016;7:77950–77957. doi: 10.18632/oncotarget.12847. [DOI] [PMC free article] [PubMed] [Google Scholar]
- 17.Topaloglu R, et al. Clinicopathological and immunohistological features in childhood IgA nephropathy: a single-centre experience. Clin. Kidney J. 2013;6:169–175. doi: 10.1093/ckj/sft004. [DOI] [PMC free article] [PubMed] [Google Scholar]
- 18.Li P, et al. Therapeutic mechanism of Saikosaponin-d in anti-Thy1 mAb 1-22-3-induced rat model of glomerulonephritis. Nephron. Exp. Nephrol. 2005;101:e111–e118. doi: 10.1159/000087437. [DOI] [PubMed] [Google Scholar]
- 19.Daniel C, et al. Thrombospondin-2 therapy ameliorates experimental glomerulonephritis via inhibition of cell proliferation, inflammation, and TGF-beta activation. Am. J. Physiol. Ren. Physiol. 2009;297:F1299–F1309. doi: 10.1152/ajprenal.00254.2009. [DOI] [PubMed] [Google Scholar]
- 20.Wittmann S, et al. The mTOR inhibitor everolimus attenuates the time course of chronic anti-Thy1 nephritis in the rat. Nephron. Exp. Nephrol. 2008;108:e45–e56. doi: 10.1159/000116112. [DOI] [PubMed] [Google Scholar]
- 21.Kramer S, et al. Low-dose mTOR inhibition by rapamycin attenuates progression in anti-thy1-induced chronic glomerulosclerosis of the rat. Am. J. Physiol. Ren. Physiol. 2008;294:F440–F449. doi: 10.1152/ajprenal.00379.2007. [DOI] [PubMed] [Google Scholar]
- 22.Hua KF, et al. Osthole mitigates progressive IgA nephropathy by inhibiting reactive oxygen species generation and NF-kappaB/NLRP3 pathway. PLoS. One. 2013;8:e77794. doi: 10.1371/journal.pone.0077794. [DOI] [PMC free article] [PubMed] [Google Scholar]
- 23.Zoja C, et al. Effects of MCP-1 inhibition by bindarit therapy in a rat model of polycystic kidney disease. Nephron. 2015;129:52–61. doi: 10.1159/000369149. [DOI] [PubMed] [Google Scholar]
- 24.Abraham A. P., et al. Matrix metalloproteinase-12 (MMP-12) deficiency attenuates experimental crescentic anti-GBM glomerulonephritis. Nephrology23, 183–189 (2016). [DOI] [PubMed]
- 25.Matoba K, et al. Rho-kinase mediates TNF-alpha-induced MCP-1 expression via p38 MAPK signaling pathway in mesangial cells. Biochem. Biophys. Res. Commun. 2010;402:725–730. doi: 10.1016/j.bbrc.2010.10.093. [DOI] [PubMed] [Google Scholar]
- 26.Ozato K, et al. TRIM family proteins and their emerging roles in innate immunity. Nat. Rev. Immunol. 2008;8:849–860. doi: 10.1038/nri2413. [DOI] [PMC free article] [PubMed] [Google Scholar]
- 27.Cambiaghi V, et al. TRIM proteins in cancer. Adv. Exp. Med. Biol. 2012;770:77–91. doi: 10.1007/978-1-4614-5398-7_6. [DOI] [PubMed] [Google Scholar]
- 28.Pizon V, et al. Transient association of titin and myosin with microtubules in nascent myofibrils directed by the MURF2 RING-finger protein. J. Cell. Sci. 2002;115:4469–4482. doi: 10.1242/jcs.00131. [DOI] [PubMed] [Google Scholar]
- 29.McElhinny AS, et al. Muscle-specific RING finger-2 (MURF-2) is important for microtubule, intermediate filament and sarcomeric M-line maintenance in striated muscle development. J. Cell. Sci. 2004;117:3175–3188. doi: 10.1242/jcs.01158. [DOI] [PubMed] [Google Scholar]
- 30.Gralinski LE, et al. Genome wide identification of SARS-CoV susceptibility loci using the collaborative cross. PLoS Genet. 2015;11:e1005504. doi: 10.1371/journal.pgen.1005504. [DOI] [PMC free article] [PubMed] [Google Scholar]
- 31.Lu Y, et al. Bioinformatics analysis of proteomic profiles during the process of anti-Thy1 nephritis. Mol. & Cell. Proteom. 2012;11(M111):008755. doi: 10.1074/mcp.M111.008755. [DOI] [PMC free article] [PubMed] [Google Scholar]
- 32.Li Z, et al. Expression and significance of integrin-linked kinase in cultured cells, normal tissue, and diseased tissue of aging rat kidneys. J. Gerontol. A. Biol. Sci. Med. Sci. 2004;59:984–996. doi: 10.1093/gerona/59.10.B984. [DOI] [PubMed] [Google Scholar]
- 33.Soleimani VD, et al. Chromatin tandem affinity purification sequencing. Nat. Protoc. 2013;8:1525–1534. doi: 10.1038/nprot.2013.088. [DOI] [PMC free article] [PubMed] [Google Scholar]


