Abstract
PURPOSE
Tumor-associated antigen cytotoxic T cells (TAA-Ts) represent a new, potentially effective and nontoxic therapeutic approach for patients with relapsed or refractory solid tumors. In this first-in-human trial, we investigated the safety of administering TAA-Ts that target Wilms tumor gene 1, preferentially expressed antigen of melanoma, and survivin to patients with relapsed/refractory solid tumors.
MATERIALS AND METHODS
TAA-T products were generated from autologous peripheral blood and infused over three dose levels: 1, 2, and 4 × 10⁷ cells/m2. Patients were eligible for up to eight infusions administered 4 to 7 weeks apart. We assessed dose limiting toxicity during the first 45 days after infusion. Disease response was determined within the context of a phase I trial.
RESULTS
There were no dose-limiting toxicities. Of 15 evaluable patients, 11 (73%) with stable disease or better at day 45 postinfusion were defined as responders. Six responders remain without progression at a median of 13.9 months (range, 4.1 to 19.9 months) after initial TAA-Ts. Patients who were treated at the highest dose level showed the best clinical outcomes, with a 6-month progression-free survival of 73% after TAA-T infusion compared with a 38% 6-month progression-free survival with prior therapy. Antigen spreading and a reduction in circulating tumor-associated antigens using digital droplet polymerase chain reaction was observed in patients after TAA-T infusion.
CONCLUSION
TAA-Ts safely induced disease stabilization, prolonged time to progression, and were associated with antigen spreading and a reduction in circulating tumor-associated antigen DNA levels in patients with relapsed/refractory solid tumors without lymphodepleting chemotherapy before infusion. TAA-Ts are a promising new treatment approach for patients with solid tumors.
INTRODUCTION
Patients with relapsed or refractory solid tumors have dismal outcomes and a low probability of cure. Toxic salvage treatments with limited therapeutic prospects are not acceptable, and there is a need for tolerable and effective alternative therapies. The ability of T lymphocytes to recognize cancer cells and eliminate them by engaging tumor-associated antigens (TAAs) has therapeutic potential. Expansion and activation of T cells has proven to be safe, feasible, and effective in both viral disease1 and select malignancies.2-4
Cellular immunotherapy, notably chimeric antigen receptor T cells (CAR-Ts) for B-cell acute lymphoblastic leukemia, has become an established element of treatment for hematologic malignancies.5,6 Results of CAR-T therapy in solid tumors are less favorable and responses are brief.7-9 TAA cytotoxic T cells (TAA-Ts) presented through major histocompatibility complex to the native T-cell receptor offer several advantages over the single surface antigen target of CAR-T therapy. We selected three target TAAs that are uniquely expressed or overexpressed on malignant cells such that TAA-T cells will preferentially attack tumor cells without damaging healthy tissues. The Wilms tumor gene (WT1), expressed in various normal cells,10 encodes a transcription factor that regulates cell proliferation, death, and differentiation.11 WT1 is overexpressed in Wilms tumor, sarcomas, and ovarian and prostate cancers.12-16 Preferentially expressed antigen of melanoma (PRAME) is associated with multiple cancers, and studies suggest that PRAME is involved in cell proliferation and survival.17 In neuroblastoma and osteosarcoma, PRAME expression was associated with advanced disease and poor prognosis.17-19 Survivin, which is highly expressed during fetal development but absent in most mature tissues,20 may regulate cellular apoptosis and proliferation. Survivin is overexpressed in many malignancies21-23 and associated with chemotherapy resistance, disease recurrence, and decreased survival. The generation and ex vivo expansion of TAA-Ts using these specific antigens has been validated.2,24
We conducted this phase I dose-escalation trial to determine the safety of administering TAA-Ts that target WT1, PRAME, and survivin to patients with high-risk solid tumors defined as refractory, relapsed, or with residual detectable disease after conventional therapy. We characterized the TAA-T product with respect to TAA specificity and studied the in vivo cytokine and lymphocyte cellular milieu pre- and postinfusion. Disease response was evaluated after TAA-T infusion within the context of a phase I trial.
MATERIALS AND METHODS
Patients and Treatment Protocol
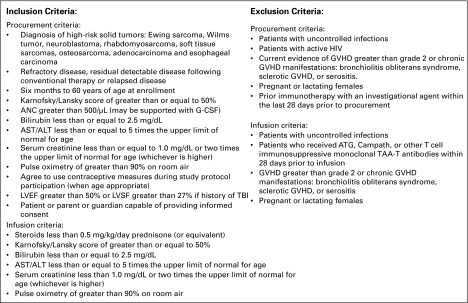
Patients with high-risk solid tumors reported to express one or more target tumor antigens—WT1, PRAME, and/or survivin—on the basis of the published literature12-19,21-23 were eligible for this nonrandomized phase I study. Informed consent was obtained for patients who met standard eligibility requirements, including performance status and organ function parameters, before cell procurement and TAA-T infusion (ClinicalTrials.gov identifier: NCT02789228; Appendix Fig A1, online only). This study was approved by the US Food and Drug Administration (IND 16135) and the Children’s National Medical Center (CNMC) institutional review board.
Three TAA-T dose levels (DLs) were evaluated—1, 2, and 4 × 10⁷ cells/m2—with enrollment of two to four patients planned at each DL and expansion to up to eight patients at the maximum tolerated dose. Dose escalation occurred once two patients completed an initial 45-day postinfusion evaluation period without dose limiting toxicity (DLT). Up to two additional patients were permitted at each DL while the toxicity monitoring period was completed. TAA-Ts were infused a minimum of 1 week after conventional tumor-directed therapy. When possible, antineoplastic cytotoxic agents were held for 6 weeks after TAA-T infusion. First and second TAA-T doses were administered a minimum of 45 days apart and subsequent doses approximately every 28 days. Patients who did not experience disease progression were eligible to receive up to eight TAA-T doses at the enrollment DL. TAA-Ts were administered intravenously (1 mL/10-12e7 cells) in an outpatient setting over 1 to 2 minutes according to previously described methods.25
DLTs for assessing safety and determining the recommended TAA-T dose were defined as follows: grade 3 or greater infusion-related adverse event, grade 4 or greater nonhematologic adverse event not related to the patient’s underlying malignancy or preexisting comorbidities, and grade 3 or greater acute graft versus host disease or any unexpected toxicity of any grade attributed to the infusion of TAA-Ts. Toxicities were defined using National Cancer Institute Common Terminology Criteria for Adverse Events version 4.03. Response for patients with measurable disease was according to Response Evaluation Criteria in Solid Tumors (RECIST) version 1.1.26 Patients with evaluable disease were monitored for complete response, stable disease, or unequivocal disease progression as described in RECIST guidelines. Progression-free survival (PFS) was measured from the time of first TAA-T infusion to either the date of disease progression or the time of data cutoff (December 1, 2018) for all patients.
Statistical Analysis
We analyzed survival data, including PFS, median, and 95% CIs, with either log-rank test to compare DLs or sign test to compare the difference between TAA-T DL 3 and immediate prior therapy. Results were presented using the Kaplan-Meier method. P values < .05 were considered statistically significant (Appendix, online only).
Manufacture of TAA-T Products
TAA-T products were generated according to Good Manufacturing Practices appropriate for a phase I study.2,24,27 A total of 100 to 120 mL (3 mL/kg for patients < 25 kg) of peripheral blood was collected on two occasions to generate antigen-presenting cells. Subsequent collections were permitted for patients who were eligible to continue on therapy without additional cell doses (Appendix).
Characterization of TAA-T Products
Flow cytometry, Luminex, immunofluorescence, and digital droplet polymerase chain reaction assays.
Details provided in the Appendix.
Interferon gamma enzyme-linked immunospot assay.
The assay was performed as previously described (Appendix).24
T-cell receptor sequencing.
The assay was performed as previously described (Appendix).28-30
RESULTS
Patient Characteristics
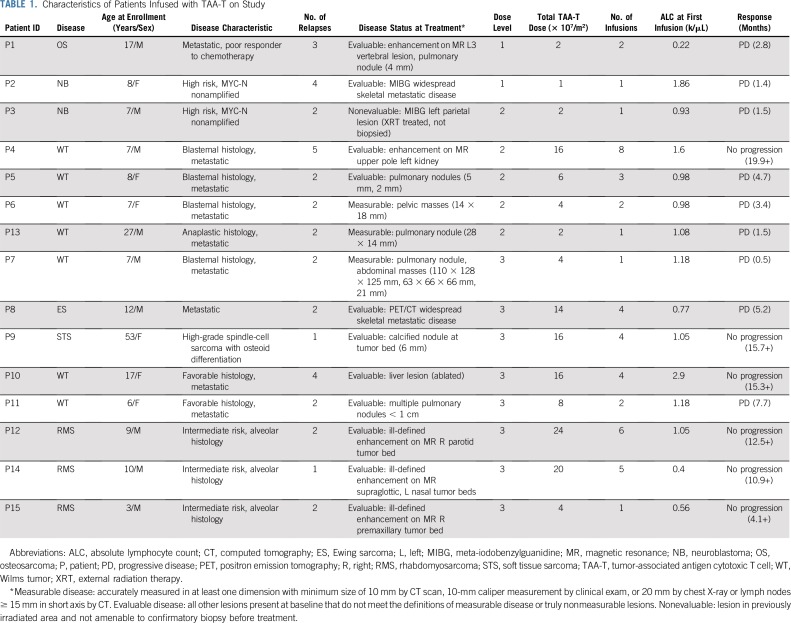
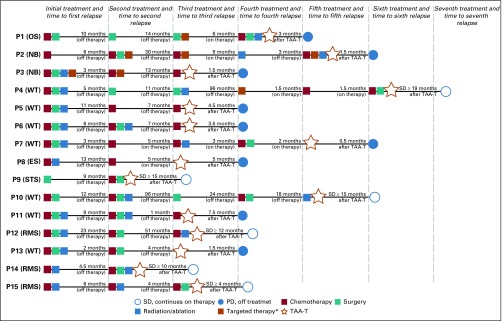
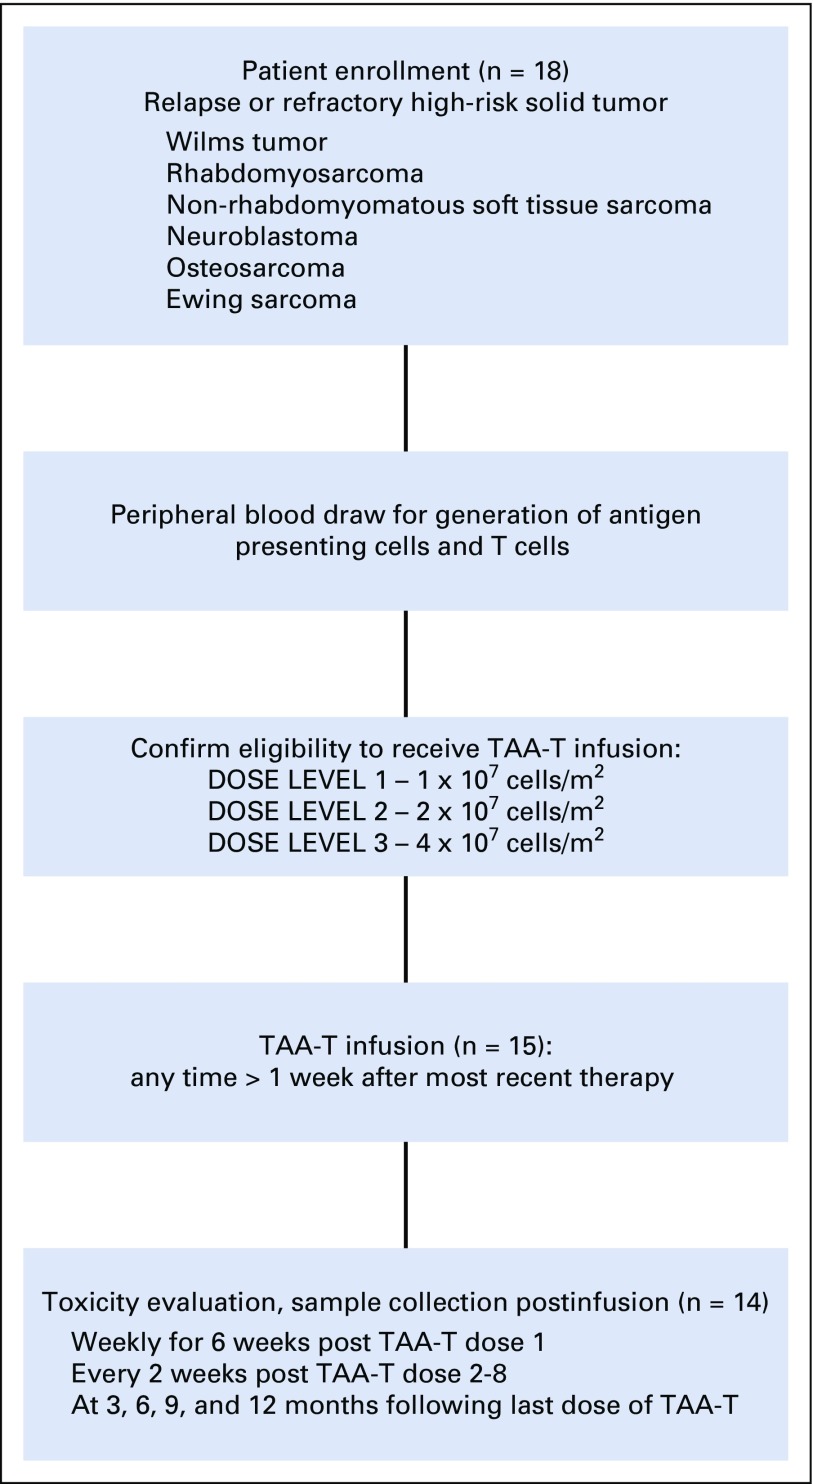
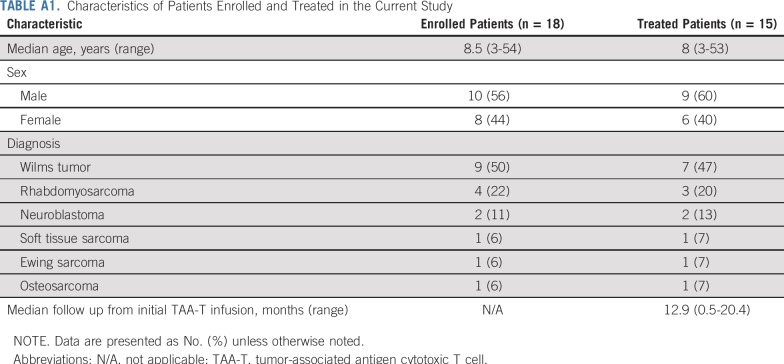
Eighteen patients (10 males, eight females) with solid tumor malignancies, including Wilms tumor (n = 9), rhabdomyosarcoma (n = 4), neuroblastoma (n = 2), soft tissue sarcoma (n = 1), Ewing sarcoma (n = 1), and osteosarcoma (n = 1), were enrolled (Appendix Fig A2, online only; Appendix Table A1, online only). Patients were recruited and observed by CNMC in Washington, DC, from May 5, 2016, through December 1, 2018. Median age at enrollment was 8.5 years (range, 3 to 53 years). Fifteen patients received infusions (Table 1): one patient underwent cell procurement without achieving an adequate cell number, one patient had a viable cryopreserved product awaiting infusion, and one patient developed rapid disease progression that precluded TAA-T infusion (Appendix Table A2, online only). All infused patients received multimodal therapy before receiving TAA-Ts (Fig 1). A total of 45 TAA-T infusions were administered (median, two infusions per patient; range, one to eight infusions). One patient did not complete the initial 45-day observation period as a result of disease progression. The remaining 14 patients were evaluable for toxicity. Patients were observed for a median of 12.9 months (range, 0.5 to 20.4 months) at the time of data cutoff.
TABLE 1.
Characteristics of Patients Infused with TAA-T on Study
FIG 1.
Treatment summary. Multimodality therapy administered before tumor-associated antigen cytotoxic T cell (TAA-T) infusion. Patients experienced relapsed disease after completion of therapy as well as disease progression while on treatment. (*) Targeted therapy includes the following: denosumab (patient 1 [P1]), dinutuximab (P2 and P3), radiolabeled 131I-MIBG (P2 and P3), lorvotuzumab (P2 and P4). ES, Ewing sarcoma; 131I-MIBG, 131I-meta-iodobenzylguanidine; NB, neuroblastoma; OS, osteosarcoma; SD, stable disease; PD, progressive disease; RMS, rhabdomyosarcoma; STS, soft tissue sarcoma; WT, Wilms tumor.
TAA-T Product Characterization
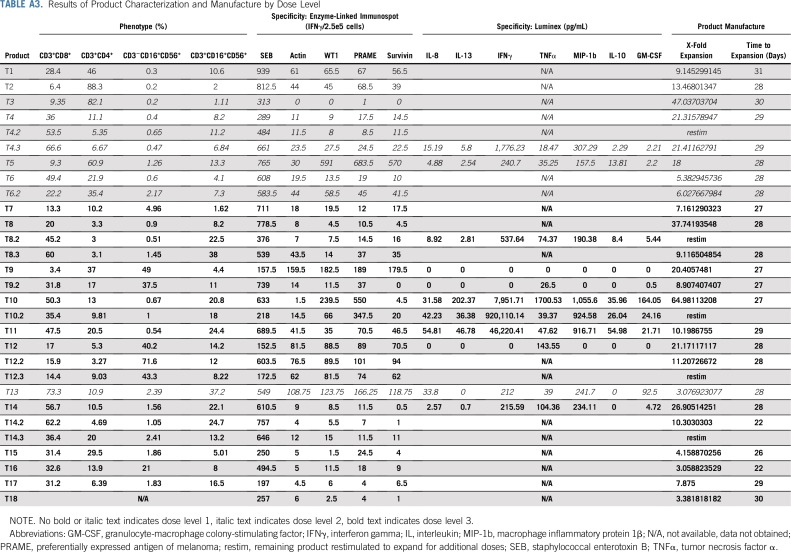
Twenty-seven TAA-T products were generated from autologous sources for the 18 enrolled patients. For products infused (n = 24 in 15 patients), median time from collection to clinical freeze was 28 days (range, 22 to 31 days), with a median 12-fold expansion of T cells (range, three- to 65-fold; Appendix Table A3, online only).
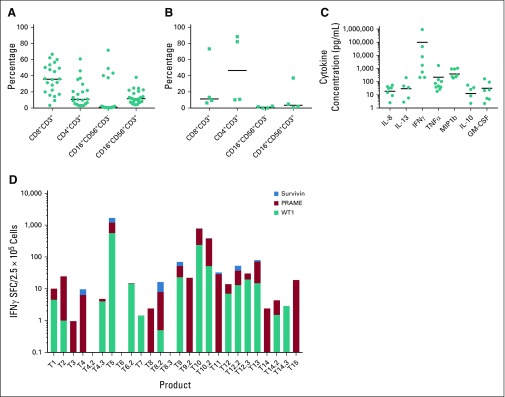
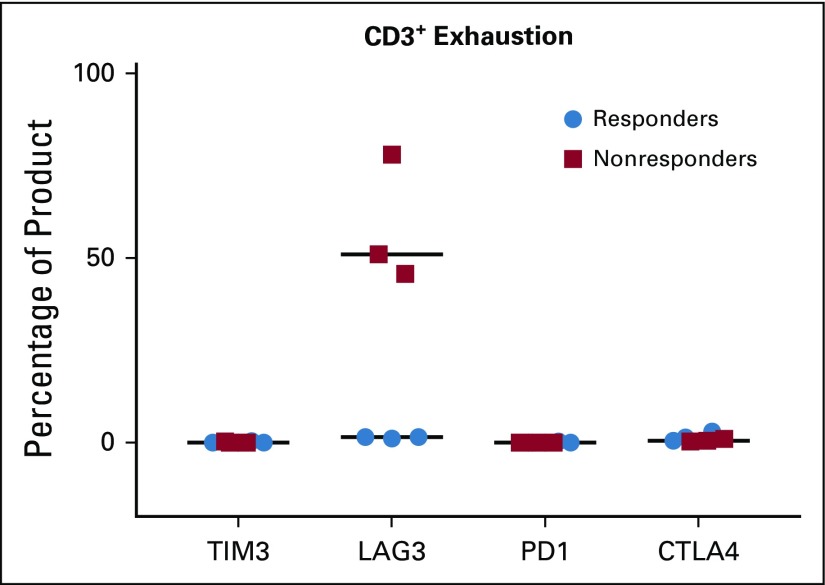
Patients who demonstrated stable disease or better at the initial day 45 evaluation time point after TAA-T infusion were deemed responders and those who experienced progressive disease were classified as nonresponders. The phenotype of TAA-T products was compared between responders (Fig 2A) and nonresponders (Fig 2B). Responders received TAA-T products composed of higher CD8+CD3+ cells (median, 35.7%; range, 3.4% to 66%) compared with CD4+CD3+ cells (median, 10.8%; range, 3% to 60.9%), with variable numbers of CD16+CD56+CD3− cells (median, 1.2%; range, 0.3% to 71.6%) and CD16+CD56+CD3+ cells (median, 11.6%; range, 4.1% to 38%). Products administered to nonresponders were composed of lower CD8+CD3+ cells (median, 11.3%; range, 6.4% to 73.3%) compared with CD4+CD3+ cells (median, 46.5%; range, 10.2% to 88.3%), and variable CD16+CD56+CD3− cells (median, 1.3%; range, 0.2% to 5%) and CD16+CD56+CD3+ cells (median, 1.8%; range, 1.11% to 37.2%). These differences were not statistically significant. B cells (median, 0.17; range, 0% to 1.7%) and dendritic cells (median, 0%; range, 0% to 1.4%) accounted for less than 2% of the final products. The most consistent cytokine elevation in the TAA-T product as evaluated by the Luminex (17-plex) assay occurred for IFNγ (median, 1,157 pg/mL; range, 0 to 920,110 pg/mL), tumor necrosis factor-α (median, 61 pg/mL; range, 0 to 1,701 pg/mL), and MIP-1b (median, 271 pg/mL; range, 0 to 1,056 pg/mL; Fig 2C). Antigen specificity was evaluated using the interferon gamma (IFNγ) enzyme-linked immunospot assay (Fig 2D). All products demonstrated a response to the staphylococcal enterotoxin B–positive control with a median of 605.8 (range, 152.5 to 939) IFNγ spot-forming cells/2.5e5. Median actin response, a measure of nonspecific activity, was 18.8 (0 to 159.5) IFNγ SFC/2.5e5. A positive result for individual antigens was defined as 10 IFNγ SFC/2.5e5 cells or greater after subtraction of actin. Response to specific antigens was as follows: WT1: median, 1.5 (0 to 561) IFNγ SFC/2.5e5 cells; PRAME: median, 7 (0 to 653.5) IFNγ SFC/2.5e5 cells; and survivin: median, 0 (0 to 540) IFNγ SFC/2.5e5 cells (Appendix Table A3). PRAME was the antigen to which most TAA-T products demonstrated specificity, followed by WT1, then survivin. Evaluating markers of T-cell exhaustion revealed that TAA-T products that were administered to nonresponders expressed increased lymphocyte-associated gene 3 compared with products that were administered to responders. Expression of other markers of exhaustion—T-cell immunoglobulin and mucin domain–containing-3, programmed cell death 1, and cytotoxic T lymphocyte antigen 4—were essentially undetectable in both groups (Appendix Fig A3, online only).
FIG 2.
Characterization of tumor-associated antigen cytotoxic T cell (TAA-T) products. (A) Flow cytometry demonstrates a variable phenotype of polyclonal, polyfunctional T-cell products in patients in the Responding group. (B) Patients in the Nonresponding group showed a comparatively lower percentage of CD8+CD3+ cells and CD16+CD56+CD3+ cells with high percentages of CD4+CD3+ cells. (C) Luminex assay to measure cytokine secretion by TAA-T products. Interferon gamma (IFNγ), tumor necrosis factor α (TNFα), and MIP1b were the cytokines most commonly detected in response to antigen stimulation. (D) Product TAA specificity as measured by IFNγ enzyme-linked immunospot assay. Number on the x-axis corresponds to patient number and, when applicable, multiple products are numbered accordingly (eg, T4, T4.2, and T4.3 are the first, second, and third products administered to P4). TAA-T products demonstrated variable specificity to the targeted antigens. GM-CSF, granulocyte-macrophage colony-stimulating factor; IL, interleukin; MIP-1b, macrophage inflammatory protein 1β; PRAME, preferentially expressed antigen of melanoma; WT1, Wilms tumor 1.
Safety of TAA-Ts
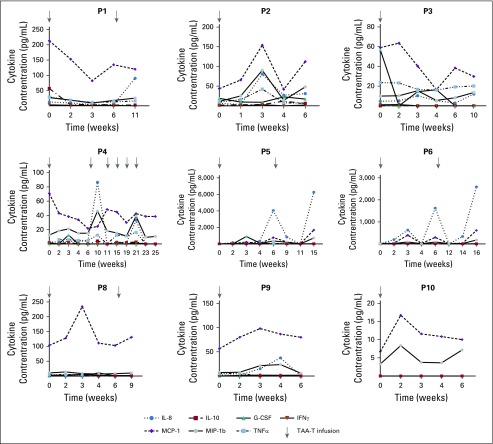
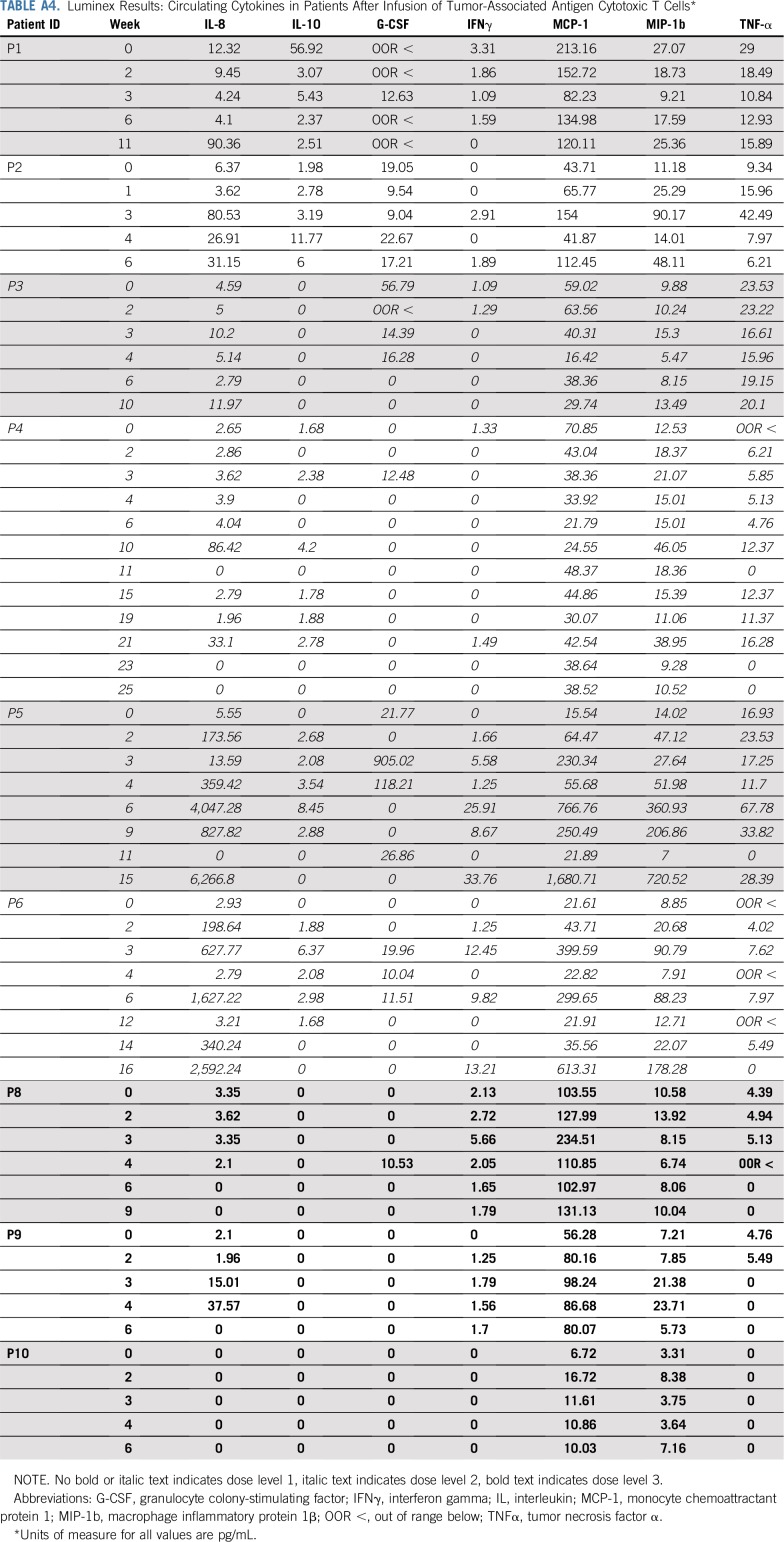
There were no DLTs and no infusion-related adverse events. Adverse events that were possibly related to protocol therapy during all 44 treatment cycles included grade 1 fatigue (n = 1) and myalgia (n = 1), both of which completely resolved. The recommended TAA-T dose for administration in patients with solid tumors is the highest evaluated: 4 × 10⁷ cells/m2. Of note, a fifth patient (P13) was treated on DL 2 not because of toxicity but as a planned deviation as it was not possible to expand the TAA-T product to the numbers required for DL 3. Patients did not experience cytokine release syndrome or have elevated interleukin-6 (IL-6), tumor necrosis factor α, or IFNγ levels in plasma samples obtained before or during the first year after infusion. The most marked change in cytokines observed with IL-8 (preinfusion median, 3.4 pg/mL; range, 0 to 12.3 pg/mL; and postinfusion peak median, 80.5 pg/mL; range, 0 to 6,266.8 pg/mL; Appendix Table A4, online only), which decreased in responding patients (P4, P5, and P6) and increased in correlation with disease progression confirmed by radiographic imaging in P5 and P6 (Appendix Fig A4, online only).
Disease Response
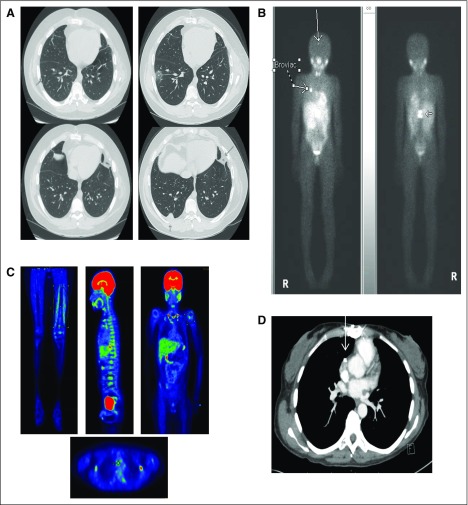
Of 15 patients treated, 11 had evaluable disease at initial TAA-T infusion, three had measurable disease, and one had an unevaluable meta-iodobenzylguanidine avid lesion that was not amenable to confirmatory biopsy (P3). Of 12 patients with evaluable disease/MIBG positivity, 10 had a best response of stable disease and two patients had progressive disease, including P3, who experienced progression with new metastatic disease (Appendix Fig A5, online only). Of three patients with measurable disease at the time of first infusion, one had a best response of stable disease and two patients had progressive disease.
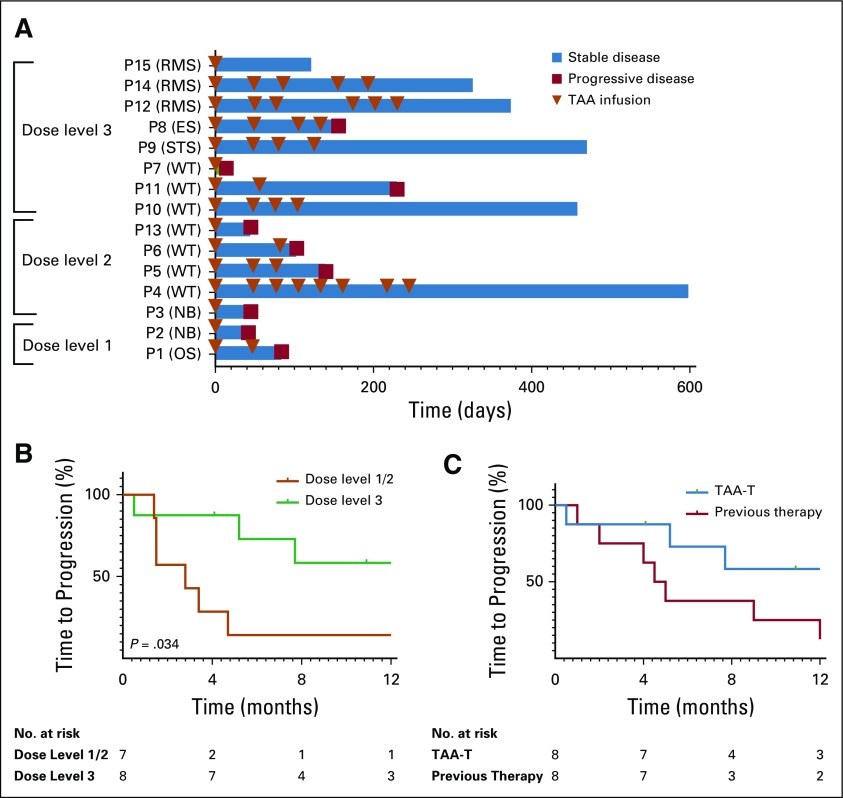
Overall, 11 of 15 evaluable patients (73%) responded. At DL 1 (1 × 10⁷ cells/m2), P1 experienced a response and received a second TAA-T infusion. P2 experienced disease progression and came off protocol therapy. At DL 2 (2 × 10⁷ cells/m2), three of five patients (P4, P5, and P6) experienced a response and received additional infusions. P4 received eight TAA-T infusions (maximum allowed per protocol). Of eight patients who were treated on DL 3 (4 × 10⁷ cells/m2), seven experienced a response. Six of these patients received multiple TAA-T infusions (median, four doses; range, two to six doses), whereas one patient (P15) had sufficient cells for a single infusion. Of the 11 responding patients, six have not experienced progression at a median of 13.9 months (range, 4.1 to 19.9 months) after initial infusion (Fig 3A). Median PFS on DL 3 (n = 8) was 9.3 months compared with 2.8 months on DLs 1 and 2 combined (n = 7; P = .034; Fig 3B). At the highest DL, three patients experienced progression (median duration of follow up, 12.7 months; range, 0.5 to 15.7 months). PFS at 6 and 12 months was 73% and 58%, respectively (Fig 3C). This was markedly superior to the 6- and 12-month PFS—38% and 25%, respectively—observed with the treatment course immediately before TAA-T therapy. Although this difference was not statistically significant (P = .73), there was a trend toward improved time to progression after TAA-T treatment compared with previous therapy.
FIG 3.
Disease response. (A) Outcome for evaluable patients who received at least one tumor-associated antigen cytotoxic T cell (TAA-T) infusion. Many patients were able to receive multiple TAA-T infusions without adverse reactions. Eleven of 15 patients met criteria for response, which was defined as stable disease or better at the day 45 evaluation. (B) Median time to progression for patients enrolled in dose level (DL) 1 and 2 (n = 7) was 2.8 months compared with 9.3 months for patients enrolled in DL 3 (n = 8; P = .034). (C) Progression-free survival of patients after TAA-T therapy treated at the highest DL was 73% at 6 months and 58% at 12 months compared with their immediate prior therapy regimen (38% and 25%, respectively; P = .73). ES, Ewing sarcoma; NB, neuroblastoma; OS, osteosarcoma; P, patient; RMS, rhabdomyosarcoma; STS, soft tissue sarcoma; WT, Wilms tumor.
TAA-T Persistence, Antigen Spreading, and Impact on TAA DNA Levels
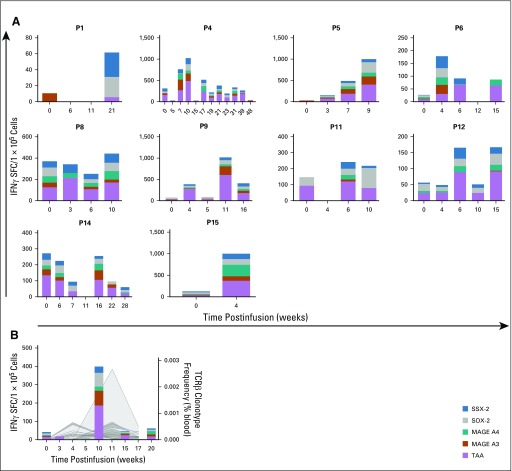
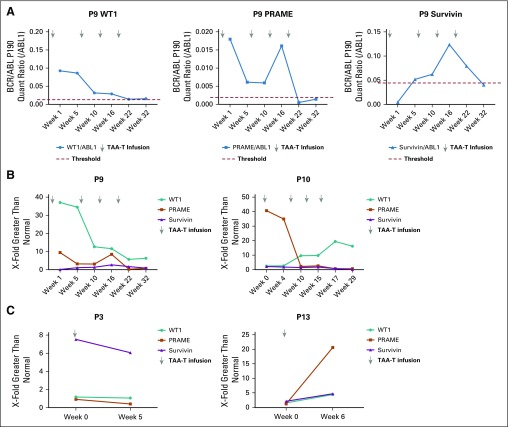
Ten of 11 responding patients demonstrated increased specificity for the three target TAAs as well as one or more nontargeted TAA—MAGE-A3, MAGE-A4, SOX-2, or SSX-2—commonly identified in solid tumors,31-40 which suggests antigen spreading after TAA-T infusion (Fig 4A). As proof of principle, T-cell receptor sequencing was performed on the TAA-T product as well as pre- and postinfusion peripheral blood samples. We detected unique T-cell receptor clonotypes derived from P10’s TAA-T product in patient samples that were obtained post- but not preinfusion (Fig 4B). Increased frequency of functional TAA-T was also observed in samples obtained post- versus preinfusion as measured by IFNγ enzyme-linked immunospot. To determine whether TAA-T expansion could potentially affect circulating tumor DNA, measurable levels of TAA DNA—WT1, PRAME, and survivin—were detected using digital droplet polymerase chain reaction. We compared the ratio of TAA to ABL1 in patient samples with the median found in random healthy donors to the CNMC blood bank (healthy controls). A responding patient (P9) demonstrated elevated TAA DNA levels that decreased after TAA-T infusion. P10 (responder) also demonstrated decreasing TAA DNA levels after TAA-T infusion, whereas nonresponding patients P3 and P13 demonstrated an increase or plateau in TAA DNA levels that correlated with clinical progression (Appendix Fig A6, online only).
FIG 4.
Antigen spreading and T-cell persistence postinfusion in responders. (A) Interferon gamma (IFNγ) enzyme-linked immunospot assay was used to evaluate antitumor immunity to the targeted antigens (Wilms tumor 1, preferentially expressed antigen of melanoma, survivin), as well as four nontargeted antigens commonly identified in solid tumors (MAGE A3, MAGE A4, SOX-2, SSX-2). Ten of 11 responders demonstrated evidence of antigen spreading while receiving tumor-associated antigen (TAAs) cytotoxic T cell infusions. Patient 1 (P1) did not show increased specificity for targeted or nontargeted antigens until after disease progression at week 12. (B) Increased specificity to targeted and nontargeted antigens correlated with the expansion of unique T-cell receptor (TCR) clonotypes as detected by TCR sequencing in P10, a responder.
Tumor Expression of Targeted Antigens
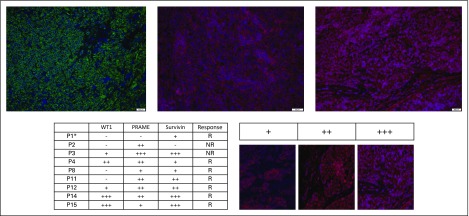
Tumor samples available from nine patients—two nonresponders and seven responders—expressed the targeted TAAs as detected by immunofluorescence in all samples (WT1, n = 5; PRAME, n = 8; surviving, n = 8; Fig 5).
FIG 5.
Patient tumor samples express targeted antigens by immunofluorescence. Tumor sample from patient 14 (P14) demonstrates strong expression of Wilms tumor 1 (WT1; +++; top left), preferentially expressed antigen of melanoma (PRAME; ++; top middle), and survivin (+++; top right). Immunofluorescent staining of tumor samples was graded qualitatively for available patient tumor samples (bottom left); qualitative grading system using survivin as an example (bottom right). (*) Tumor sample was obtained from a calcified pulmonary nodule. NR, nonresponder; R, responder.
DISCUSSION
In this first-in-human study, a novel TAA-T infusional product that targets tumor-associated antigens WT1, PRAME, and survivin was successfully generated and safely administered to 15 patients with high-risk, refractory or relapsed solid tumors over three DLs. Eleven (73%) of 15 evaluable patients were defined as responders and eligible to continue on protocol therapy. Ten patients received two or more TAA-T infusions and six patients (40%) received four or more infusions. Therapy was administered in an outpatient setting with minimal, reversible adverse events. Patients maintained an excellent quality of life, even with repeated TAA-T doses. Overall, TAA-T infusions were well tolerated in this heavily pretreated population.
At the recommended dose, PFS after TAA-T was notably improved compared with immediate prior therapies and significantly improved at the recommended DL compared with lower doses, which suggests a dose–response relationship. Given the excellent toxicity profile, it may be reasonable to evaluate the feasibility and efficacy of higher TAA-T doses to achieve an optimal dose as well as adding a prescribed lymphodepletion regimen immediately before TAA-T infusion. Overall observed response rates for disease stabilization, time to progression, and overall survival were markedly higher than those reported in other phase I clinical trials. Specifically, in contrast to the 73% response rate we observed, the expected response rate of disease stabilization is only 17% to 37% in comparable patient populations enrolled in phase I studies.41,42
Wilms tumor was the predominant diagnosis, accounting for five of seven patients defined as responders. All patients with alveolar rhabdomyosarcoma (n = 3) were defined as responders. Whereas this study focused predominantly on a highly unique pediatric/adolescent and young adult population (age 3 to 27 years), one patient (P9) outside of this age range (age 53 years) remains without progression of a soft tissue sarcoma more than 400 days after initiating TAA-T therapy, which warrants additional study in this population. Overall, in a relapsed/refractory solid tumor patient population that previously demonstrated rapid time to disease progression, this study suggests efficacy after TAA-T therapy that is worthy of additional evaluation, particularly in select tumor types.
TAA-T products were manufactured for all but one patient in this heavily pretreated population and demonstrated a polyclonal, polyfunctional phenotype with a trend toward a lower fraction of CD8+ T cells in products generated from nonresponding patients (n = 3). Expression of exhaustion markers PD1, CTLA4, and TIM3 was low in all products tested, but LAG3 was increased in three products. Of interest, these three products were administered to patients defined as nonresponders, which suggests that T-cell exhaustion may have been a mechanism of product failure in vivo.43
Antigen spreading was identified in 10 of 11 responding patients, which correlates with enhanced antitumor immunity in these patients. The majority of patient tumor samples tested demonstrated expression of targeted TAAs. Patient numbers are too small to demonstrate significance; however, the only responding patient (P1) with minimal TAA tumor expression had a metastatic osteosarcoma pulmonary lesion, which may represent a false negative as a result of technical difficulties during staining. Of the two nonresponders, P2 had relatively limited tumor TAA expression (PRAME only). In contrast, the tumor sample from P3 expressed all three TAAs, but the TAA-T product that was infused elicited limited TAA-specific activity in vitro. These data suggest that approaches to increase tumor antigen expression and overcome other tumor immune evasion strategies, such as major histocompatibility complex downregulation44,45 and transforming growth factor-β secretion,46 may improve clinical response. Incorporation of epigenetic modifiers to upregulate antigen expression and gene editing strategies to overcome tumor immune evasion are being considered for future study development.46,47
Patients who were treated on this study had no prior lymphodepletion, which may explain the lack of cytokine release and elevation in Th1 cytokines associated with TAA-T infusion, despite evidence of T-cell expansion postinfusion. Surge of IL-8, a known marker of tumor progression, was observed in some patients,48 which correlated with disease progression in three patients. Conversely, IL-8 levels decreased after TAA-T infusion in three responding patients, suggesting tumor control and in vivo efficacy.
Select responding patients demonstrated decreased levels of circulating tumor antigen DNA after TAA-T infusion, which may indicate in vivo efficacy of TAA-T therapy. Monitoring for circulating tumor antigen DNA using digital droplet polymerase chain reaction may prove to be a valuable way to monitor disease in patients with solid tumors. This could provide a less invasive and more sensitive method of minimal residual disease monitoring, directing the administration of multiple TAA-T infusions to maintain clinical responses before evidence of radiographic or clinical progression. We plan to further validate this potential biomarker assay in advanced phase studies.
In conclusion, our findings from this first-in-human trial evaluating a unique TAA-T product emphasize the potential for multitumor antigen targeting when developing T-cell therapeutics for the treatment of patients with solid tumors. This study underlines the feasibility and therapeutic potential of counteracting the common tumor immune evasion mechanism by antigen loss. This strategy may not only be exploited to enhance the immunotherapy of the many other solid tumors that express these antigens, but when used in combination may also safely enhance the response to checkpoint inhibitors in the solid tumor setting.
ACKNOWLEDGMENT
The authors thank Kirsten Williams, MD, Jay Tanna, and Nan Zhang of the Children’s National Health System for contributions to protocol development and organizing and facilitating products and patient samples.
APPENDIX
FIG A1.
Patient inclusion/exclusion criteria. ANC, absolute neutrophil count; ATG, antithymocyte globulin; G-CSF, granulocyte colony-stimulating factor; GVHD, graft-versus-host disease; LVEF, left ventricular ejection fraction; LVSF, left ventricular shortening fraction; TAAs; tumor-associated antigens; TBI, total-body irradiation.
FIG A2.
Participant flow diagram. Patients with high-risk solid tumors were eligible for enrollment. Eighteen patients were enrolled and 15 were infused with tumor-associated antigen cytotoxic T cells (TAA-T) at the time of manuscript. One patient was removed from treatment before day 45 as a result of disease progression. Fourteen patients remained evaluable for toxicity.
FIG A3.
Tumor-associated antigen cytotoxic T-cell (TAA-T) products express low levels of exhaustion markers. Exhaustion markers T-cell immunoglobulin and mucin domain–containing-3 (TIM3), programmed cell death 1 (PD1), and cytotoxic T lymphocyte antigen 4 (CTLA4) were at uniformly low levels in TAA-T products as detected by flow cytometry. Lymphocyte-associated gene 3 (LAG3) was higher in products generated for nonresponders compared with responders.
FIG A4.
Circulating cytokines in patients receiving tumor-associated antigen cytotoxic T cells (TAA-Ts). Inflammatory cytokines remained low in circulation after TAA-T infusion. Interleukin-8 (IL-8) did decrease in patients P4, P5, and P6 after TAA-T infusion. P5 and P6 had subsequent increases in IL-8 that correlated with clinical disease progression. G-CSF, granulocyte colony-stimulating factor; IFNγ, interferon gamma; MCP-1, monocyte chemoattractant protein 1; MIP-1b, macrophage inflammatory protein 1β; TNFα, tumor necrosis factor α.
FIG A5.
Representative imaging in patients receiving tumor-associated antigen cytotoxic T cells (TAA-Ts). (A) Computed tomography (CT) chest scan shows disease in patient 1 (P1) before TAA-T (pulmonary nodule on top panel; left) and at the time of progression after cycle 2 with new disease in the anterior and posterior right lobe (right). (B) 123I-meta-iodobenzylguanidine (123I-MIBG) imaging for P3 before cells (left) and at progression after cycle 1 (right) with new avid right posterior skull and vertebral lesions. (C) Positron emission tomography imaging from P8 before TAA-T with multifocal disease (left femur, precariat lymph node, spine, humerus), which remained stable through four infusions before eventual progression. (D) CT scan from P9 pre–TAA-T demonstrates calcified hilar lesion, which remained stable through four infusions and in follow up after therapy.
FIG A6.
Digital droplet polymerase chain reaction (ddPCR) results in responding versus nonresponding patients. (A) DNA from targeted antigens Wilms tumor 1 (WT1), preferentially expressed antigen of melanoma (PRAME), and survivin identified by ddPCR in responding patient P9 at baseline and post–TAA-T (tumor-associated antigen cytotoxic T cell) infusion. Threshold levels were determined using the median of healthy individuals for WT1 (left), PRAME (middle), and survivin (right). (B) Circulating TAA DNA levels in P9 and P10 compared with threshold levels. Patients remain clinically well without evidence of disease progression. (C) TAA DNA were measured in two nonresponding patients and compared with healthy controls. Both had elevated levels of at least one TAA at the time of disease progression. P13 had increases in DNA of all three TAAs, which correlated with significant clinical disease progression. BCR/ABL, breakpoint cluster region-Abelson.
TABLE A1.
Characteristics of Patients Enrolled and Treated in the Current Study
TABLE A2.
Summary of Patients Enrolled and Not Infused
TABLE A3.
Results of Product Characterization and Manufacture by Dose Level
TABLE A4.
Luminex Results: Circulating Cytokines in Patients After Infusion of Tumor-Associated Antigen Cytotoxic T Cells*
Footnotes
Presented in part at the 2017 Peripheral Blood and Marrow Consortium Annual Meeting, Montreal, Quebec, Canada, April 26, 2017; the International Society of Pediatric Oncology Annual Meeting, Washington, DC, October 12-15, 2017; the 2018 American Society of Pediatric Hematology/Oncology Annual Meeting, Pittsburgh, PA, May 2-5, 2018; and the American Society of Clinical Oncology Annual Meeting, Chicago, IL, June 1-5, 2018.
This work was supported by funding from the Children’s National Health System Heroes Gala, Alex’s Army Foundation, the Children's National Health System Board of Visitors and Hyundai Hope on Wheels Young Investigator Grant to Support Pediatric Cancer Research, the Children’s Research Institute Bioinformatics Unit, and the Clinical and Translational Science Institute; and by Grant No. UL1-TR001876 from the National Institutes of Health National Center for Advancing Translational Sciences.
The contents of this work are solely the responsibility of the authors and do not necessarily represent the official views of the National Center for Advancing Translational Sciences or the National Institutes of Health.
Clinical trial information: NCT02789228.
AUTHOR CONTRIBUTIONS
Conception and design: Amy B. Hont, C. Russell Cruz, Fahmida Hoq, Yunfei Wang, Patrick J. Hanley, Jeffrey S. Dome, Catherine M. Bollard, Holly J. Meany
Financial support: Amy B. Hont, Catherine M. Bollard
Administrative support: Karuna Panchapakesan, Fahmida Hoq
Provision of study materials or patients: Jeffrey S. Dome, Catherine M. Bollard, Holly J. Meany
Collection and assembly of data: Amy B. Hont, C. Russell Cruz, Robert Ulrey, Barbara O’Brien, Maja Stanojevic, Anushree Datar, Shuroug Albihani, Devin Saunders, Karuna Panchapakesan, Sam Darko, Maria Fernanda Fortiz, Fahmida Hoq, Haili Lang, Jeffrey S. Dome, Catherine M. Bollard, Holly J. Meany
Data analysis and interpretation: Amy B. Hont, C. Russell Cruz, Shuroug Albihani, Ryo Hanajiri, Payal Banerjee, Yunfei Wang, Patrick J. Hanley, Jeffrey S. Dome, Catherine M. Bollard, Holly J. Meany
Manuscript writing: All authors
Final approval of manuscript: All authors
Accountable for all aspects of the work: All authors
AUTHORS' DISCLOSURES OF POTENTIAL CONFLICTS OF INTEREST
Immunotherapy of Relapsed and Refractory Solid Tumors With Ex Vivo Expanded Multi-Tumor Associated Antigen Specific Cytotoxic T Lymphocytes: A Phase I Study
The following represents disclosure information provided by authors of this manuscript. All relationships are considered compensated. Relationships are self-held unless noted. I = Immediate Family Member, Inst = My Institution. Relationships may not relate to the subject matter of this manuscript. For more information about ASCO's conflict of interest policy, please refer to www.asco.org/rwc or ascopubs.org/jco/site/ifc.
C. Russell Cruz
Stock and Other Ownership Interests: Mana Therapeutics
Patents, Royalties, Other Intellectual Property: Intellectual properties surrounding T-cell therapies
Travel, Accommodations, Expenses: Torque
Maria Fernanda Fortiz
Stock and Other Ownership Interests: Sanofi
Patrick J. Hanley
Stock and Other Ownership Interests: Mana Therapeutics
Honoraria: Dava Oncology
Consulting or Advisory Role: Mana Therapeutics, NexImmune
Patents, Royalties, Other Intellectual Property: Mana Therapeutics has licensed technology of which I am listed as an inventor from Children’s National Health System
Travel, Accommodations, Expenses: Terumo, Dava Oncology
Jeffrey S. Dome
Patents, Royalties, Other Intellectual Property: Rockland Immunochemicals
Catherine M. Bollard
Stock and Other Ownership Interests: Mana Therapeutics, NexImmune, Torque, Cabaletta Bio
Consulting or Advisory Role: Torque, NexImmune, Cellectis, Cabaletta Bio
Patents, Royalties, Other Intellectual Property: TAA-specific T cells and HIV-specific T cells
Holly J. Meany
Consulting or Advisory Role: Bayer
No other potential conflicts of interest were reported.
REFERENCES
- 1.Bollard CM, Heslop HE. T cells for viral infections after allogeneic hematopoietic stem cell transplant. Blood. 2016;127:3331–3340. doi: 10.1182/blood-2016-01-628982. [DOI] [PMC free article] [PubMed] [Google Scholar]
- 2.Weber G, Gerdemann U, Caruana I, et al. Generation of multi-leukemia antigen-specific T cells to enhance the graft-versus-leukemia effect after allogeneic stem cell transplant. Leukemia. 2013;27:1538–1547. doi: 10.1038/leu.2013.66. [DOI] [PMC free article] [PubMed] [Google Scholar]
- 3.Rosenberg SA, Yang JC, Sherry RM, et al. Durable complete responses in heavily pretreated patients with metastatic melanoma using T-cell transfer immunotherapy. Clin Cancer Res. 2011;17:4550–4557. doi: 10.1158/1078-0432.CCR-11-0116. [DOI] [PMC free article] [PubMed] [Google Scholar]
- 4.Robbins PF, Morgan RA, Feldman SA, et al. Tumor regression in patients with metastatic synovial cell sarcoma and melanoma using genetically engineered lymphocytes reactive with NY-ESO-1. J Clin Oncol. 2011;29:917–924. doi: 10.1200/JCO.2010.32.2537. [DOI] [PMC free article] [PubMed] [Google Scholar]
- 5.Brentjens RJ, Rivière I, Park JH, et al. Safety and persistence of adoptively transferred autologous CD19-targeted T cells in patients with relapsed or chemotherapy refractory B-cell leukemias. Blood. 2011;118:4817–4828. doi: 10.1182/blood-2011-04-348540. [DOI] [PMC free article] [PubMed] [Google Scholar]
- 6.Davila ML, Brentjens RJ. CD19-targeted CAR T cells as novel cancer immunotherapy for relapsed or refractory B-cell acute lymphoblastic leukemia. Clin Adv Hematol Oncol. 2016;14:802–808. [PMC free article] [PubMed] [Google Scholar]
- 7.Heczey A, Louis CU. Advances in chimeric antigen receptor immunotherapy for neuroblastoma. Discov Med. 2013;16:287–294. [PMC free article] [PubMed] [Google Scholar]
- 8.Louis CU, Savoldo B, Dotti G, et al. Antitumor activity and long-term fate of chimeric antigen receptor-positive T cells in patients with neuroblastoma. Blood. 2011;118:6050–6056. doi: 10.1182/blood-2011-05-354449. [DOI] [PMC free article] [PubMed] [Google Scholar]
- 9.Ahmed N, Brawley VS, Hegde M, et al. Human epidermal growth factor receptor 2 (HER2) -specific chimeric antigen receptor-modified T cells for the immunotherapy of HER2-positive sarcoma. J Clin Oncol. 2015;33:1688–1696. doi: 10.1200/JCO.2014.58.0225. [DOI] [PMC free article] [PubMed] [Google Scholar]
- 10.Chau YY, Hastie ND. The role of Wt1 in regulating mesenchyme in cancer, development, and tissue homeostasis. Trends Genet. 2012;28:515–524. doi: 10.1016/j.tig.2012.04.004. [DOI] [PubMed] [Google Scholar]
- 11.Scharnhorst V, van der Eb AJ, Jochemsen AG. WT1 proteins: Functions in growth and differentiation. Gene. 2001;273:141–161. doi: 10.1016/s0378-1119(01)00593-5. [DOI] [PubMed] [Google Scholar]
- 12.Lee SB, Haber DA. Wilms tumor and the WT1 gene. Exp Cell Res. 2001;264:74–99. doi: 10.1006/excr.2000.5131. [DOI] [PubMed] [Google Scholar]
- 13.Barbolina MV, Adley BP, Shea LD, et al. Wilms tumor gene protein 1 is associated with ovarian cancer metastasis and modulates cell invasion. Cancer. 2008;112:1632–1641. doi: 10.1002/cncr.23341. [DOI] [PubMed] [Google Scholar]
- 14.Kim A, Park EY, Kim K, et al. Prognostic significance of WT1 expression in soft tissue sarcoma. World J Surg Oncol. 2014;12:214. doi: 10.1186/1477-7819-12-214. [DOI] [PMC free article] [PubMed] [Google Scholar]
- 15.Hylander B, Repasky E, Shrikant P, et al. Expression of Wilms tumor gene (WT1) in epithelial ovarian cancer. Gynecol Oncol. 2006;101:12–17. doi: 10.1016/j.ygyno.2005.09.052. [DOI] [PubMed] [Google Scholar]
- 16.Brett A, Pandey S, Fraizer G. The Wilms’ tumor gene (WT1) regulates E-cadherin expression and migration of prostate cancer cells. Mol Cancer. 2013;12:3. doi: 10.1186/1476-4598-12-3. [DOI] [PMC free article] [PubMed] [Google Scholar]
- 17.Yin B. PRAME: From diagnostic marker and tumor antigen to promising target of RNAi therapy in leukemic cells. Leuk Res. 2011;35:1159–1160. doi: 10.1016/j.leukres.2011.04.018. [DOI] [PubMed] [Google Scholar]
- 18.Tan P, Zou C, Yong B, et al. Expression and prognostic relevance of PRAME in primary osteosarcoma. Biochem Biophys Res Commun. 2012;419:801–808. doi: 10.1016/j.bbrc.2012.02.110. [DOI] [PubMed] [Google Scholar]
- 19.Toledo SR, Zago MA, Oliveira ID, et al. Insights on PRAME and osteosarcoma by means of gene expression profiling. J Orthop Sci. 2011;16:458–466. doi: 10.1007/s00776-011-0106-7. [DOI] [PubMed] [Google Scholar]
- 20.Shinozawa I, Inokuchi K, Wakabayashi I, et al. Disturbed expression of the anti-apoptosis gene, survivin, and EPR-1 in hematological malignancies. Leuk Res. 2000;24:965–970. doi: 10.1016/s0145-2126(00)00065-5. [DOI] [PubMed] [Google Scholar]
- 21.Fukuda S, Pelus LM. Survivin, a cancer target with an emerging role in normal adult tissues. Mol Cancer Ther. 2006;5:1087–1098. doi: 10.1158/1535-7163.MCT-05-0375. [DOI] [PubMed] [Google Scholar]
- 22.Tamm I, Wang Y, Sausville E, et al. IAP-family protein survivin inhibits caspase activity and apoptosis induced by Fas (CD95), Bax, caspases, and anticancer drugs. Cancer Res. 1998;58:5315–5320. [PubMed] [Google Scholar]
- 23.Coughlin CM, Fleming MD, Carroll RG, et al. Immunosurveillance and survivin-specific T-cell immunity in children with high-risk neuroblastoma. J Clin Oncol. 2006;24:5725–5734. doi: 10.1200/JCO.2005.05.3314. [DOI] [PubMed] [Google Scholar]
- 24.Weber G, Caruana I, Rouce RH, et al. Generation of tumor antigen-specific T cell lines from pediatric patients with acute lymphoblastic leukemia: Implications for immunotherapy. Clin Cancer Res. 2013;19:5079–5091. doi: 10.1158/1078-0432.CCR-13-0955. [DOI] [PMC free article] [PubMed] [Google Scholar]
- 25.Cruz CR, Hanley PJ, Liu H, et al. Adverse events following infusion of T cells for adoptive immunotherapy: A 10-year experience. Cytotherapy. 2010;12:743–749. doi: 10.3109/14653241003709686. [DOI] [PMC free article] [PubMed] [Google Scholar]
- 26.Eisenhauer EA, Therasse P, Bogaerts J, et al. New response evaluation criteria in solid tumours: Revised RECIST guideline (version 1.1) Eur J Cancer. 2009;45:228–247. doi: 10.1016/j.ejca.2008.10.026. [DOI] [PubMed] [Google Scholar]
- 27.Sili U, Leen AM, Vera JF, et al. Production of good manufacturing practice-grade cytotoxic T lymphocytes specific for Epstein-Barr virus, cytomegalovirus and adenovirus to prevent or treat viral infections post-allogeneic hematopoietic stem cell transplant. Cytotherapy. 2012;14:7–11. doi: 10.3109/14653249.2011.636963. [DOI] [PMC free article] [PubMed] [Google Scholar]
- 28.Gros A, Robbins PF, Yao X, et al. PD-1 identifies the patient-specific CD8+ tumor-reactive repertoire infiltrating human tumors. J Clin Invest. 2014;124:2246–2259. doi: 10.1172/JCI73639. [DOI] [PMC free article] [PubMed] [Google Scholar]
- 29.Bolotin DA, Poslavsky S, Mitrophanov I, et al. MiXCR: Software for comprehensive adaptive immunity profiling. Nat Methods. 2015;12:380–381. doi: 10.1038/nmeth.3364. [DOI] [PubMed] [Google Scholar]
- 30.Shugay M, Bagaev DV, Turchaninova MA, et al. VDJtools: Unifying post-analysis of T cell receptor repertoires. PLOS Comput Biol. 2015;11:e1004503. doi: 10.1371/journal.pcbi.1004503. [DOI] [PMC free article] [PubMed] [Google Scholar]
- 31.Almeida LG, Sakabe NJ, deOliveira AR, et al. CTdatabase: A knowledge-base of high-throughput and curated data on cancer-testis antigens. Nucleic Acids Res. 2009;37:D816–D819. doi: 10.1093/nar/gkn673. [DOI] [PMC free article] [PubMed] [Google Scholar]
- 32.Jacobs JF, Brasseur F, Hulsbergen-van de Kaa CA, et al. Cancer-germline gene expression in pediatric solid tumors using quantitative real-time PCR. Int J Cancer. 2007;120:67–74. doi: 10.1002/ijc.22118. [DOI] [PubMed] [Google Scholar]
- 33.Lifantseva N, Koltsova A, Krylova T, et al. Expression patterns of cancer-testis antigens in human embryonic stem cells and their cell derivatives indicate lineage tracks. Stem Cells Int. 2011;2011:795239. doi: 10.4061/2011/795239. [DOI] [PMC free article] [PubMed] [Google Scholar]
- 34.Dalerba P, Frascella E, Macino B, et al. MAGE, BAGE and GAGE gene expression in human rhabdomyosarcomas. Int J Cancer. 2001;93:85–90. doi: 10.1002/ijc.1307. [DOI] [PubMed] [Google Scholar]
- 35.Naka N, Araki N, Nakanishi H, et al. Expression of SSX genes in human osteosarcomas. Int J Cancer. 2002;98:640–642. doi: 10.1002/ijc.10277. [DOI] [PubMed] [Google Scholar]
- 36.Chi SN, Cheung NK, Cheung IY. Expression of SSX-2 and SSX-4 genes in neuroblastoma. Int J Biol Markers. 2002;17:219–223. doi: 10.1177/172460080201700401. [DOI] [PubMed] [Google Scholar]
- 37.Yang S, Zheng J, Ma Y, et al. Oct4 and Sox2 are overexpressed in human neuroblastoma and inhibited by chemotherapy. Oncol Rep. 2012;28:186–192. doi: 10.3892/or.2012.1765. [DOI] [PubMed] [Google Scholar]
- 38.Zayed H, Petersen I. Stem cell transcription factor SOX2 in synovial sarcoma and other soft tissue tumors. Pathol Res Pract. 2018;214:1000–1007. doi: 10.1016/j.prp.2018.05.004. [DOI] [PubMed] [Google Scholar]
- 39.Li J, Shen J, Wang K, et al. The roles of Sox family genes in sarcoma. Curr Drug Targets. 2016;17:1761–1772. doi: 10.2174/1389450117666160502145311. [DOI] [PubMed] [Google Scholar]
- 40.Ishida H, Matsumura T, Salgaller ML, et al. MAGE-1 and MAGE-3 or -6 expression in neuroblastoma-related pediatric solid tumors. Int J Cancer. 1996;69:375–380. doi: 10.1002/(SICI)1097-0215(19961021)69:5<375::AID-IJC4>3.0.CO;2-2. [DOI] [PubMed] [Google Scholar]
- 41.Denson A, Burke N, Wapinsky G, et al. Clinical outcomes of patients with gastrointestinal malignancies participating in phase I clinical trials. Am J Clin Oncol. 2018;41:133–139. doi: 10.1097/COC.0000000000000242. [DOI] [PMC free article] [PubMed] [Google Scholar]
- 42.Kim A, Fox E, Warren K, et al. Characteristics and outcome of pediatric patients enrolled in phase I oncology trials. Oncologist. 2008;13:679–689. doi: 10.1634/theoncologist.2008-0046. [DOI] [PMC free article] [PubMed] [Google Scholar]
- 43.Catakovic K, Klieser E, Neureiter D, et al. T cell exhaustion: From pathophysiological basics to tumor immunotherapy. Cell Commun Signal. 2017;15:1. doi: 10.1186/s12964-016-0160-z. [DOI] [PMC free article] [PubMed] [Google Scholar]
- 44.Garcia-Lora A, Algarra I, Garrido F. MHC class I antigens, immune surveillance, and tumor immune escape. J Cell Physiol. 2003;195:346–355. doi: 10.1002/jcp.10290. [DOI] [PubMed] [Google Scholar]
- 45.Garrido F, Ruiz-Cabello F, Aptsiauri N. Rejection versus escape: The tumor MHC dilemma. Cancer Immunol Immunother. 2017;66:259–271. doi: 10.1007/s00262-016-1947-x. [DOI] [PMC free article] [PubMed] [Google Scholar]
- 46.Bollard CM, Tripic T, Cruz CR, et al. Tumor-specific T-cells engineered to overcome tumor immune evasion induce clinical responses in patients with relapsed Hodgkin lymphoma. J Clin Oncol. 2018;36:1128–1139. doi: 10.1200/JCO.2017.74.3179. [DOI] [PMC free article] [PubMed] [Google Scholar]
- 47.Cruz CR, Gerdemann U, Leen AM, et al. Improving T-cell therapy for relapsed EBV-negative Hodgkin lymphoma by targeting upregulated MAGE-A4. Clin Cancer Res. 2011;17:7058–7066. doi: 10.1158/1078-0432.CCR-11-1873. [Erratum: Clin Cancer Res 18:913, 2012] [DOI] [PMC free article] [PubMed] [Google Scholar]
- 48.Xie K. Interleukin-8 and human cancer biology. Cytokine Growth Factor Rev. 2001;12:375–391. doi: 10.1016/s1359-6101(01)00016-8. [DOI] [PubMed] [Google Scholar]


