Abstract
PURPOSE
Many community cancer clinics closed between 2008 and 2016, with additional closings potentially expected. Limited data exist on the impact of travel time on health care costs and resource use.
METHODS
This retrospective cohort study (2012 to 2015) evaluated travel time to cancer care site for Medicare beneficiaries age 65 years or older in the southeastern United States. The primary outcome was Medicare spending by phase of care (ie, initial, survivorship, end of life). Secondary outcomes included patient cost responsibility and resource use measured by hospitalization rates, intensive care unit admissions, and chemotherapy-related hospitalization rates. Hierarchical linear models with patients clustered within cancer care site (CCS) were used to determine the effects of travel time on average monthly phase-specific Medicare spending and patient cost responsibility.
RESULTS
Median travel time was 32 (interquartile range, 18-59) minutes for the 23,382 included Medicare beneficiaries, with 24% of patients traveling longer than 1 hour to their CCS. During the initial phase of care, Medicare spending was 14% higher and patient cost responsibility was 10% higher for patients traveling longer than 1 hour than those traveling 30 minutes or less. Hospitalization rates were 4% to 13% higher for patients traveling longer than 1 hour versus 30 minutes or less in the initial (61 v 54), survivorship (27 v 26), and end-of-life (310 v 286) phases of care (all P < .05). Most patients traveling longer than 1 hour were hospitalized at a local hospital rather than at their CCS, whereas the converse was true for patients traveling 30 minutes or less.
CONCLUSION
As health care locations close, patients living farther from treatment sites may experience more limited access to care, and health care spending could increase for patients and Medicare.
INTRODUCTION
Many community cancer clinics closed between 2008 and 2016, with additional closings potentially expected.1 A recent survey demonstrated a 20% increase in oncology practices reporting financial struggles compared with 2008 levels.1 Furthermore, rural hospitals are closing more frequently than urban hospitals.2 These closures will limit local access to oncology care, forcing patients to travel farther.
Increased patient travel time to health care facilities has potential to adversely affect patient outcomes. Several studies found that patients living farther from radiation facilities were less likely to receive breast and rectal cancer radiation.3-9 Greater travel time is also associated with later stage of breast cancer diagnosis.10 Other reports showed mixed results on the impact of travel time on chemotherapy receipt in colon and breast cancer.11-13 However, little is known about effects of longer travel time on current spending and health care use. Understanding travel burden and health care cost and use patterns for older patients with cancer will be essential in understanding the potential impact of policy changes that influence access to cancer care.
The purpose of this study was to understand the relationship between the phase of care-specific travel time to cancer care sites (CCSs) and health care resource use (including Medicare spending, patient cost responsibility, and hospitalizations). To better understand hospitalization patterns, we also evaluated the effects of travel time on hospitalization location and chemotherapy-related hospitalizations.
METHODS
Study Design
In this retrospective cohort study, we used data collected as part of a Centers for Medicare & Medicaid Innovation demonstration project that included patients diagnosed during or after 2008 who received cancer care from 2012 to 2015.14 Data sources included local tumor registries linked to electronic medical records, claims abstracted from the Centers for Medicare & Medicaid Services Chronic Condition Data Warehouse, and travel times curated from Google Maps. This study was approved by the University of Alabama at Birmingham (UAB) Institutional Review Board.
Setting and Patient Sample
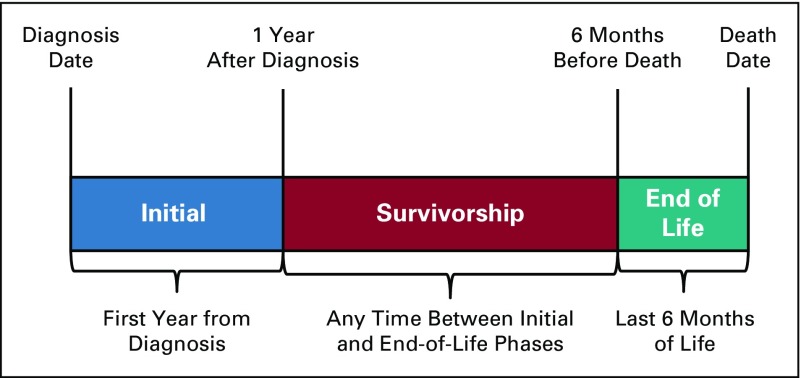
The UAB Cancer Community Network (CCN) includes two academic and 10 community cancer centers within Alabama, Georgia, Florida, Mississippi, and Tennessee. Academic cancer centers were affiliated with a medical school; details regarding the cancer centers are described elsewhere.14,15 The source population included Medicare beneficiaries age 65 years or older with a cancer diagnosed during or after 2008 who received cancer care within the UAB CCN from 2012 to 2015. Tumor and patient characteristics were provided by local tumor registries enhanced with electronic medical record data. Patients with continuous Medicare Part A and B coverage were included. Patients without a home address or enrolled in Medicare Advantage were excluded. Because spending varies according to patient status along the care continuum, patients were longitudinally categorized by phase of care. The end-of-life (EOL) phase was defined as the 6 months before death. The initial phase was then defined as the first year from cancer diagnosis, excluding the last 6 months of life. The survivorship phase was defined as the time, if any, between initial and EOL phases of care. Patients were first coded as EOL, then initial, then survivorship, depending on allowable survival time. Patients could be included in multiple phases of care (Appendix Fig. A1, online only) based on their length of follow-up time and could be receiving treatment in the survivorship phase of care (eg, endocrine therapy for breast cancer). Patient age at cancer diagnosis (younger than 75 years v 75 years or older), sex, cancer type (lung, breast, gastrointestinal [GI], genitourinary, other), Surveillance, Epidemiology, and End Results Program cancer stage (0, I, II, III, IV), and cancer center volume (large [4,000 or more patients with cancer per year] v small) were obtained from local tumor registry data; race (white v nonwhite), dual eligibility status (ever eligible for both Medicare and Medicaid v never), and National Cancer Institute comorbidity status (0 v 1 v 2+) were obtained from Medicare claims data. National Cancer Institute Comorbidity Index scores were based on claims for comorbid conditions from 2012 to 2015 and classified on the basis of the Klabunde modification of the Charlson comorbidity index.16-19
Primary Independent Variable: Patient Travel Time to CCS
Patient home addresses were obtained from UAB CCN tumor registry data. Total travel times from each patient’s home to their CCS were calculated using the shortest driving time considering traffic using a SAS macro (SAS Institute, Cary, NC) linked to live Google Maps (Google, Mountain View, CA) data.20 Unmappable addresses were individually checked, edited, and rerun through the macro. Patients with post office box addresses were excluded. Patient travel times were categorized into 30 minutes or less, 31 to 60 minutes, and longer than 1 hour, on the basis of a priori knowledge of travel times within CCN metro areas. The macro was repeated starting at a different time and day, with an average 15-second difference found between travel time estimates.
Primary Outcome: Medicare Spending
The primary outcome for this study was the monthly amount paid to providers by Medicare, abstracted from inpatient, outpatient, hospice, home health, skilled nursing facility, carrier or physician visit, and durable medical equipment claims data. Spending was summed per patient by phase of care. To account for differing times within each phase of care, spending per patient per phase was divided by the number of months the patient contributed to the specific phase. Medicare Part D prescription drug costs were unavailable for inclusion in Medicare spending calculations.
Secondary Outcomes: Patient Cost Responsibility and Hospitalizations
Secondary outcomes included monthly patient cost responsibility and hospitalization rates. Patient cost responsibility was measured from claims data by the amounts due from patients through deductibles, copayments, and coinsurance. Patients may or may not have actually paid these amounts, depending on supplemental insurance enrollment.
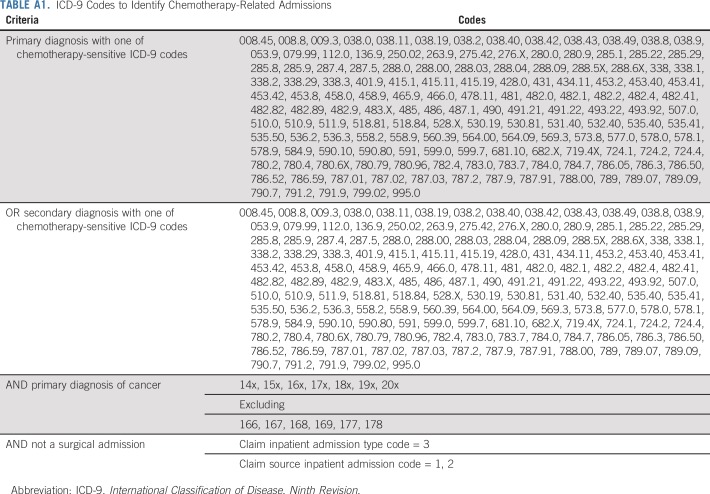
All hospitalizations after cancer diagnosis were obtained from inpatient claims and categorized as occurring at the CCS (UAB CCN site where the patient sees his or her oncology surgeon, radiation oncologist, gynecologic oncologist, medical oncologist), local care site (all hospitals closer to the patient’s home than the CCS), or other care site (all hospitals farther from the patient’s home than the CCS) using the hospital provider identification number. If a patient was seen at a UAB CCN site other than where the patient sees his or her oncologist, this site was classified as a local or other care site. Hospitalizations for any planned surgical admissions (cancer and noncancer) were excluded.21 The proportion of hospitalizations at local care site versus CCS, median hospital length of stay, and proportion of hospitalizations requiring intensive care unit (ICU) admission were quantified. A subgroup analysis was performed calculating rates per 100-person years of chemotherapy-related hospital admissions in patients receiving active antineoplastic therapy. Hospitalizations were coded as chemotherapy-related if occurring between the first and last chemotherapy claim plus 30 days (Appendix Table A1).21 The first and last dates of chemotherapy were obtained from claims data using the Healthcare Common Procedure Coding System, Berenson-Eggers Type of Service Codes, National Drug Codes, International Classification of Disease, Ninth Revision, administration codes, or generic drug names in Medicare Part D.
Statistical Analysis
Patient demographic and clinical characteristics were described using medians and interquartile ranges (IQRs) for continuous variables, or frequencies and percentages for categorical variables for patients traveling 30 minutes or less, 31 to 60 minutes, or more than 1 hour to their CCS. All outcomes were calculated in phase of care-specific time frames and subsequently by time traveled. Hierarchical linear mixed models adjusted for age, sex, race, dual eligibility status, cancer type, cancer stage, and comorbidity index score were used to estimate expected values and 95% confidence intervals (CIs) for phase-specific monthly Medicare and patient cost responsibility by time traveled. Models included a random intercept. Generalized linear mixed models with a gamma distribution and a restricted cubic spline effect for travel time, adjusted for the same covariates, were used as sensitivity analyses to allow modeling a nonlinear association between Medicare spending by travel time. Phase-specific hospitalization rates per 100 person-years were calculated overall and by care site using log-linked generalized linear models with a Poisson distribution. The proportion of hospitalizations with an ICU admission and hospital length of stay were captured as exploratory analyses. Subgroup analyses were also performed by cancer type and included only patients with Part D coverage. A 5% false discovery rate was used to correct for multiple inferences on the same body of data. All analyses were performed using SAS software, version 9.4 (SAS Institute).
RESULTS
Patient Sample
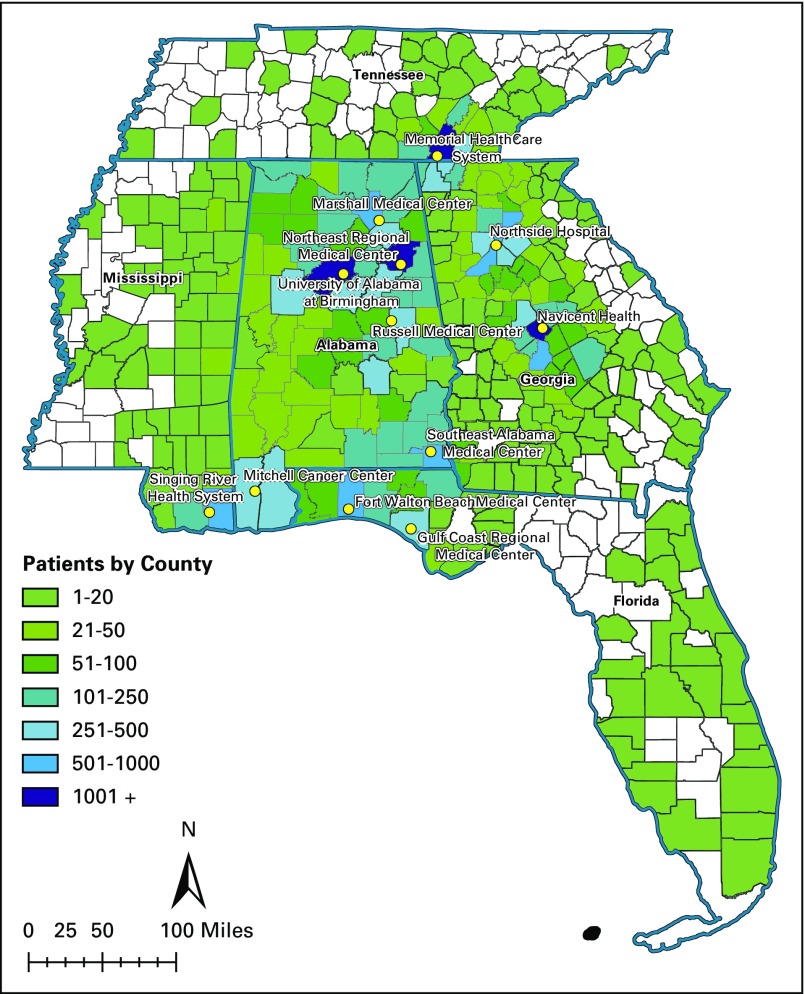
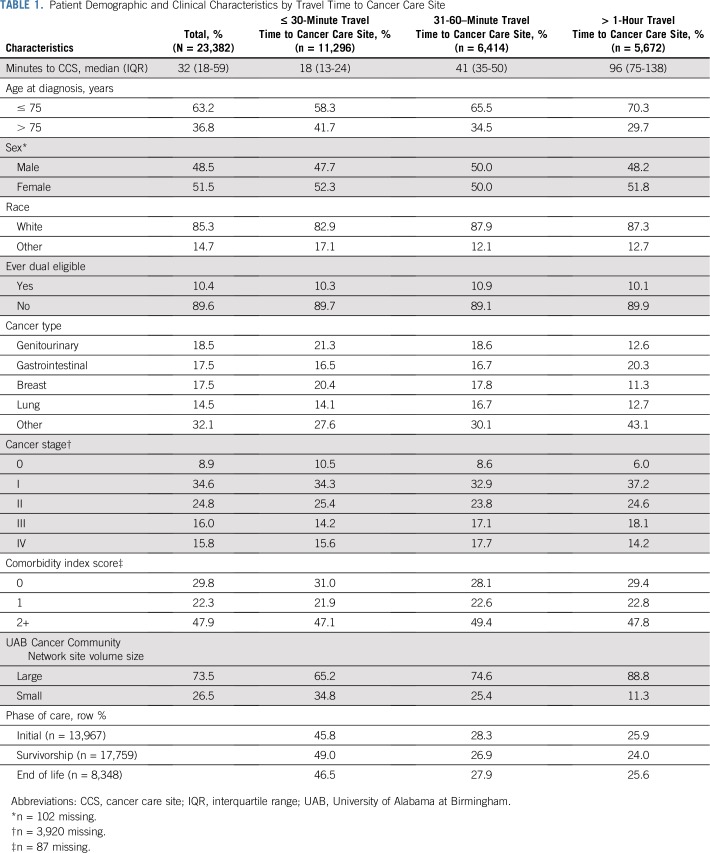
Our sample included 23,282 patients receiving cancer care from CCN providers (Fig 1); after categorizing by phase of care, 13,967 were included in the initial phase, 17,759 in the survivorship phase, and 8,348 in the EOL phase of care. Median follow-up time was 12 (IQR, 9-12) months in the initial phase, 30 (IQR, 14-49) months in the survivorship phase, and 6 (IQR, 5-6) months in the EOL phase of care. Most patients were age 75 years or older (63%), white (85%), with stage 0 to III cancer (84%). The most common cancer types were genitourinary, GI, breast, and lung cancer, and 48% of patients had two or more comorbidities in addition to cancer (Table 1).
FIG 1.
University of Alabama at Birmingham Cancer Community Network patient residence density by county.
TABLE 1.
Patient Demographic and Clinical Characteristics by Travel Time to Cancer Care Site
Travel Time
Median travel time to CCS was 32 (IQR, 18-59) minutes; 18% had less than 15 minutes travel time; 30% traveled 15 to 30 minutes; 27%, 30 to 60 minutes; 16%, 60 to 120 minutes; and 8%, more than 120 minutes. Patient travel time was shorter for those who received cancer care at smaller-volume sites (10% drove longer than 1 hour) compared with larger-volume sites (29% drove longer than 1 hour). Patients with shorter travel times were more frequently older, nonwhite, and seen at smaller volume CCSs (Table 1).
Medicare Spending
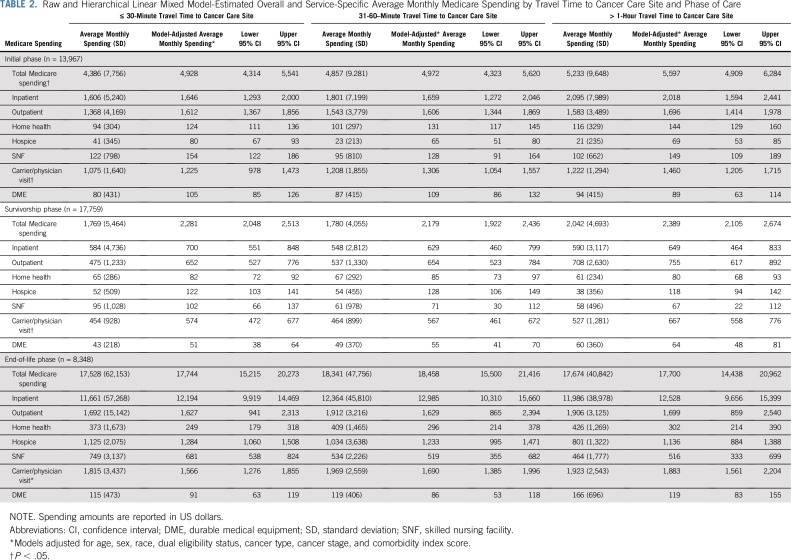
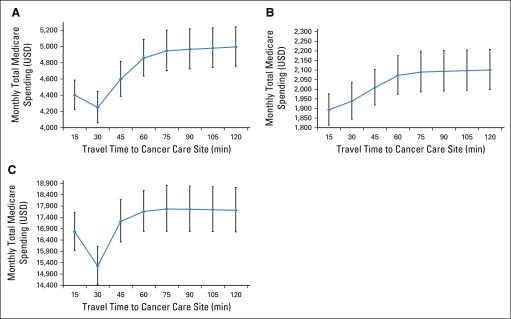
Monthly Medicare spending differed by phase of care, with median monthly spending of $2,623 (IQR, $1,064-$5,599) in the initial phase, $689 (IQR, $244-$1,980) in survivorship, and $8,353 (IQR, $4,193-$16,604) at EOL. Overall and service-specific model-adjusted Medicare spending amounts are listed in Table 2. Spending was similar for patients traveling 30 minutes or less and 31-60 minutes. Patients traveling longer than 1 hour had significantly higher monthly Medicare spending in the initial phase of care than those traveling 30 minutes or less (β = $669; 95% CI, $258 to $1,080). Two factors contributing to this difference were $372 (95% CI, $57 to $686) higher monthly inpatient spending and $235 higher carrier or physician visit spending (includes Part B drugs) for those with longer travel time. Overall monthly Medicare spending was similar in the survivorship and EOL phases across travel time categories. Sensitivity analyses using restricted cubic spline generalized linear mixed models showed similar results on a continuous scale (Appendix Fig. A2).
TABLE 2.
Raw and Hierarchical Linear Mixed Model-Estimated Overall and Service-Specific Average Monthly Medicare Spending by Travel Time to Cancer Care Site and Phase of Care
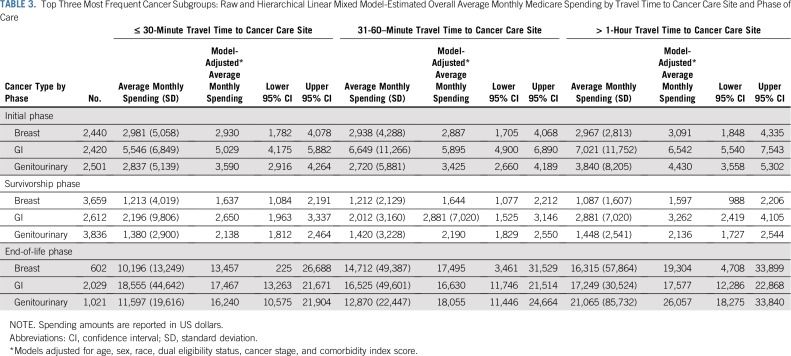
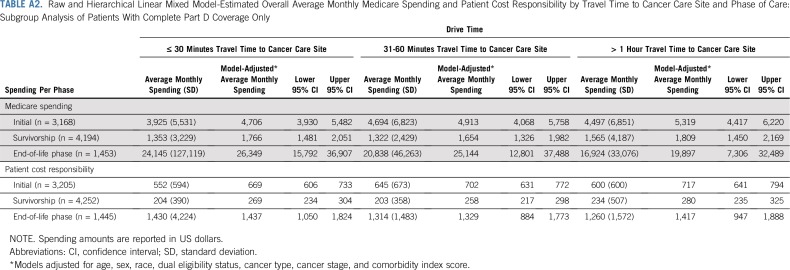
Subgroup analyses by cancer type showed larger differences in spending based on travel time for some cancer types. The largest differences in spending during the initial phase occurred for patients with GI and genitourinary cancer, and no difference was observed for patients with breast cancer (Table 3). Subgroup analysis of patients with complete Part D coverage also showed similar results (Appendix Table A2).
TABLE 3.
Top Three Most Frequent Cancer Subgroups: Raw and Hierarchical Linear Mixed Model-Estimated Overall Average Monthly Medicare Spending by Travel Time to Cancer Care Site and Phase of Care
Patient Cost Responsibility
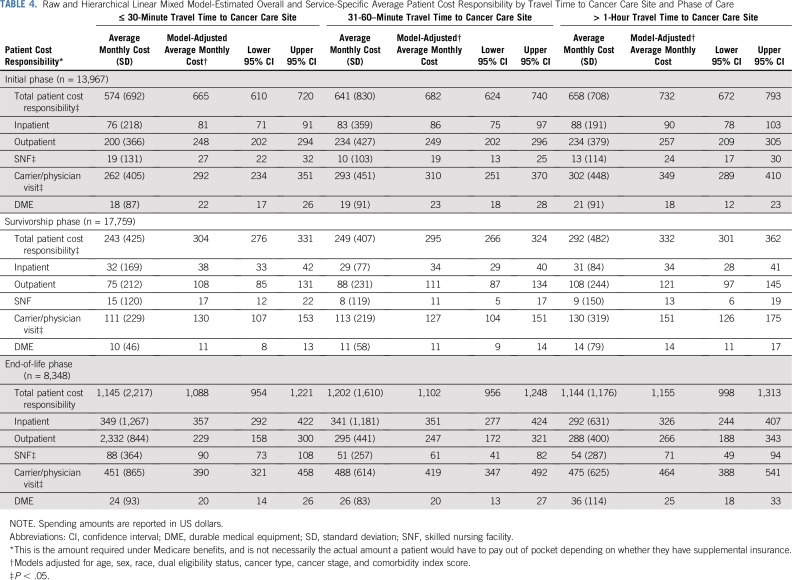
Median monthly patient cost responsibility was $397 (IQR, $184-$812) in the initial phase, $117 (IQR, $50-$271) in the survivorship phase, and $809 (IQR, $386-$1,514) at EOL care. In adjusted models, traveling longer than 1 hour resulted in higher monthly patient cost responsibility compared with traveling 30 minutes or less in the initial phase (β = $67; 95% CI, $34 to $101) and survivorship phase (β = $28; 95% CI, $10 to $46), whereas modest differences were seen at EOL (β = $68; 95% CI, $−44 to $180; Table 4). Cost responsibility differences were largely driven by noninstitutional (carrier or physician visit) services, such as Part B drugs. Subgroup analyses of patients with complete Part D coverage showed similar results (Appendix Table A2).
TABLE 4.
Raw and Hierarchical Linear Mixed Model-Estimated Overall and Service-Specific Average Patient Cost Responsibility by Travel Time to Cancer Care Site and Phase of Care
Hospitalizations
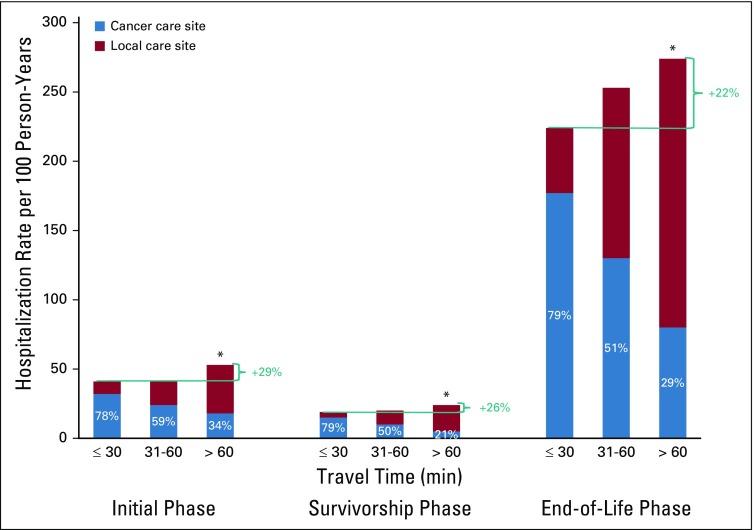
Overall rates of hospitalizations per 100 person-years by phase were 55 (initial), 26 (survivorship), and 296 (EOL). Rates of hospitalizations per 100 person-years were similar for those traveling 30 minutes or less and 31 to 60 minutes, but were 4% to 13% higher for patients traveling longer than 1 hour versus 30 minutes or less in the initial phase (61 [95% CI, 58 to 64] v 54 [95% CI, 52 to 56]; P < .001), in the survivorship phase (27 [95% CI, 26 to 28] v 26 [95% CI, 25 to 26]; P = .02), and at EOL (310 [95% CI, 299 to 322] v 286 [95% CI, 278 to 295]; P < .001).
The percentage of hospitalizations involving an ICU admission was higher for patients traveling longer than 1 hour than those patients traveling 30 minutes or less (32% v 29%). The length of hospital stay was similar for patients traveling 30 minutes or less or longer than 1 hour (4.0 [IQR, 2-7] v 4.5 [IQR, 3-8] days). When stratifying by where care was received, patients traveling longer than 1 hour had higher proportions of local hospitalizations (Fig 2). Few patients (4% initial phase, 6% survivorship phase, 9% EOL phase) traveled to other CCSs.
FIG 2.
Rates per 100 person-years of hospitalizations at cancer care site versus other sites by phase of care (initial, n = 13,967; survivorship, n = 17,759; end of life, n = 8,348) and travel time to cancer care site. *P < .05 from reference group of less than or equal to 30 minute travel time.
The number of patients receiving active treatment by phase was 2,178 (initial), 586 (survivorship), and 2,618 (EOL). Overall rates of chemotherapy-related hospitalizations per 100 person-years by phase were 130 (initial), 84 (survivorship), and 290 (EOL). Rates of hospitalizations per 100 person-years were similar for patients traveling longer than 1 hour v 30 minutes or less in the initial (128 [95% CI, 115 to 141] v 131 [95% CI, 120 to 142]; P = .72) and EOL (300 [95% CI, 277 to 323] v 293 [95% CI, 273 to 312]; P = .62) phases of care and 26% higher in the survivorship (98 [95% CI, 82 to 116] v 78 [95% CI, 69 to 89]; P = .04) phase. Analyses stratifying chemotherapy-related hospitalizations by care site were similar to the overall sample results, with patients traveling longer than 1 hour having higher proportions of hospital admissions at their local versus CCS.
DISCUSSION
Longer travel time for cancer care is associated with greater Medicare spending and patient cost responsibility, adding to a growing body of evidence that decreasing local access to care may have consequences. Previous studies reported increased travel distance to cancer care is associated with more advanced disease at diagnosis, decreased use of recommended radiation, and higher mortality rates.3-10,22 In addition, more limited access to cancer care in rural communities could contribute to the substantial disparities in cancer mortality by county.23 However, delivery of services at high-volume centers with subspecialty oncology expertise can improve patient outcomes. In rectal, hepato-pancreato-biliary, and gynecologic cancers, surgery at higher-volume centers was associated with improved outcomes, including lower complication rates and improved survival.24-26 These and our findings highlight the inherent tension between benefits from specialty expertise (centralized care) and benefits of quicker access to diagnostic testing and locally available longitudinal medical care.
In this study, we found the highest Medicare spending was in oncology patients with longer travel times, potentially due to higher hospitalization rates. This depended on cancer type, which may reflect differences in treatment regimen toxicity, treatment modalities, rare cancer expertise, and disease acuity. Patients were also more likely to be hospitalized locally, so there may have been a lack of specialized oncology providers with chemotherapy-related complication management expertise. Zafar et al27 found that patients readmitted after cancer surgery had 30% higher odds of death if admitted to a hospital other than where surgery was performed. We believe both this and our study highlight the advantages of local care, and efforts are needed for care coordination and local physician education on cancer-related complications.
Health systems and regional networks responsible for both cost and quality of care may need to provide additional resources for patients living farther from their CCS. Patient navigation aims to improve cancer care coordination and reduce unnecessary health care use.14,28,29 Telemedicine has also shown potential benefits for chronic disease self-management.30 In addition, health systems may consider sharing medical records through information technology system enhancement to decrease the amount of test duplication for patients seen outside of their primary CCS. Additional research is needed to test these interventions specifically for patients who travel for specialty care.
In our study, 63% of EOL hospitalizations occurred at local hospitals, which may be due to a lack of hospice availability in many rural communities,31 a hypothesis supported by lower hospice spending seen for patients traveling farther. Patients approaching death with substantial symptom burden32 may be unable to travel and thus be hospitalized if hospice is unavailable. Greater efforts may be needed to increase hospice access for patients living in rural areas.
Our finding that greater travel time results in increased patient cost responsibility demonstrates a negative financial impact for vulnerable patient populations. The use of local hospitals rather than longer-distance CCSs may be a lack of willingness or ability to drive because of transportation issues, cost of travel, concerns about parking and locating facilities, desire to be close to family and friends, or overall health status. Our prior study within this same patient population demonstrated that transportation and financial concerns were among the five top causes of distress, particularly for minority patients.15
Potentially vulnerable populations preferentially used local care in other medical disciplines. Patients receiving total knee replacement care at lower-volume, rural hospitals were more likely minority, low income, and disabled.33 Similar preferential local hospital use by minority patients and those with low socioeconomic status was observed in congestive heart failure.34 Thus, requiring patients to travel farther for care has the potential to exacerbate health disparities through direct increases in patient cost and travel time.
This study does have several limitations. Each patient’s cancer center was identified using a local tumor registry, which may misclassify the primary CCS for patients using multiple care locations (eg, patients seeking second opinions or inquiring about clinical trials). This study focused on the southeastern United States, which has a large African American population, high poverty rates, and many rural residents. Findings may differ in predominantly urban catchment areas. Larger, tertiary care sites may draw patients from greater distances because of physician specialization in specific cancer types and comorbidity management, whereas smaller sites may draw from the local community. However, the comorbidity index was similar for all patients, regardless of travel time. In addition, clinic visit location (outpatient v inpatient) for hospital-based practices may influence costs. We anticipate the impact of this would be modest, because the service fees account for a small proportion of total cost. In addition, unrecognized variability in practice patterns across CCSs may contribute to cost and use differences. It is also possible that traveling patients may desire more aggressive care. Thus, unmeasured patient and hospital characteristics may contribute to observed rates of health care use and cost. Part D spending was excluded, so patients receiving oral chemotherapy or supportive medications have higher spending than reflected in the data.
In conclusion, as community access to cancer health care services decreases, health care spending could increase, and patients who are forced to travel may experience higher costs. Moreover, vulnerable and rural patients who are less likely to travel long distances will face a higher risk of seeking care at sites lacking oncology care.
ACKNOWLEDGMENT
Dr. Rocque received support from the American Cancer Society Mentored Research Scholar Grant.
Appendix
FIG A1.
Phase-of-care designation algorithm.
FIG A2.
(A) Restricted cubic spline generalized linear mixed model results for average monthly Medicare spending by travel time to cancer care site in the initial phase of care (n = 13,967). Spline effect constructed with five knots placed at equally spaced percentiles. Models adjusted for age, sex, race, dual eligibility status, cancer type, cancer stage, and comorbidity index score. (B) Restricted cubic spline generalized linear mixed model results for average monthly Medicare spending by travel time to cancer care site in the survivorship phase of care (n = 17,759). Spline effect constructed with five knots placed at equally spaced percentiles. Models adjusted for age, sex, race, dual eligibility status, cancer type, cancer stage, and comorbidity index score. (C) Restricted cubic spline generalized linear mixed model results for average monthly Medicare spending by travel time to cancer care site in the end-of-life phase of care (n = 8,348). Spline effect constructed with five knots placed at equally spaced percentiles. Models adjusted for age, sex, race, dual eligibility status, cancer type, cancer stage, and comorbidity index score. USD, US dollars.
TABLE A1.
ICD-9 Codes to Identify Chemotherapy-Related Admissions
TABLE A2.
Raw and Hierarchical Linear Mixed Model-Estimated Overall Average Monthly Medicare Spending and Patient Cost Responsibility by Travel Time to Cancer Care Site and Phase of Care: Subgroup Analysis of Patients With Complete Part D Coverage Only
Footnotes
The data for this research were collected as part of a grant from the Department of Health and Human Services, Centers for Medicare & Medicaid Services (Grant No. 1C1CMS331023). The contents are solely the responsibility of the authors and do not necessarily represent the official views of the US Department of Health and Human Services or any of its agencies.
AUTHOR CONTRIBUTIONS
Conception and design: Gabrielle B. Rocque, Harold D. Miller, Maria Pisu, Rodney P. Rocconi, Kelly M. Kenzik
Financial support: Gabrielle B. Rocque
Administrative support: Gabrielle B. Rocque
Collection and assembly of data: Gabrielle B. Rocque, Maria Pisu, Rodney P. Rocconi
Data analysis and interpretation: All authors
Manuscript writing: All authors
Final approval of manuscript: All authors
Accountable for all aspects of the work: All authors
AUTHORS' DISCLOSURES OF POTENTIAL CONFLICTS OF INTEREST
Impact of Travel Time on Health Care Costs and Resource Use by Phase of Care for Older Patients With Cancer
The following represents disclosure information provided by authors of this manuscript. All relationships are considered compensated. Relationships are self-held unless noted. I = Immediate Family Member, Inst = My Institution. Relationships may not relate to the subject matter of this manuscript. For more information about ASCO's conflict of interest policy, please refer to www.asco.org/rwc or ascopubs.org/jco/site/ifc.
Gabrielle B. Rocque
Consulting or Advisory Role: Pfizer, Roche
Research Funding: Carevive Systems, Genentech, Pfizer
Travel, Accommodations, Expenses: Genentech
Harold D. Miller
Other Relationship: American Medical Association, New Mexico Hospital Association, Ontario Hospital Association, ASCO, American College of Rheumatology
Stephanie B. Wheeler
Research Funding: Pfizer (Inst)
Travel, Accommodations, Expenses: Pfizer
Maria Pisu
Research Funding: Genentech
Rodney P. Rocconi
Consulting or Advisory Role: Genentech
Speakers' Bureau: Genentech, AstraZeneca, Clovis Oncology
Expert Testimony: Johnson & Johnson
No other potential conflicts of interest were reported.
REFERENCES
- 1. Community Oncology Alliance: 2016 Community Oncology Alliance Practice Impact Report: Closings, Hospital Acquisitions, and Corporate Mergers Continue to Affect Nearly 1,600 Community Oncology Practices Nationally. 2016. https://www.communityoncology.org/2016-coa-practice-impact-report/
- 2.Health Resources & Services Administration Hospital Closings Likely to Increase. 2017. https://www.hrsa.gov/enews/past-issues/2017/october-19/hospitals-closing-increase.html
- 3.Schroen AT, Brenin DR, Kelly MD, et al. Impact of patient distance to radiation therapy on mastectomy use in early-stage breast cancer patients. J Clin Oncol. 2005;23:7074–7080. doi: 10.1200/JCO.2005.06.032. [DOI] [PubMed] [Google Scholar]
- 4.Meden T, St. John-Larkin C, Hermes D, et al. Relationship between travel distance and utilization of breast cancer treatment in rural northern Michigan. JAMA. 2002;287:111. [PubMed] [Google Scholar]
- 5.Nattinger AB, Kneusel RT, Hoffmann RG, et al. Relationship of distance from a radiotherapy facility and initial breast cancer treatment. J Natl Cancer Inst. 2001;93:1344–1346. doi: 10.1093/jnci/93.17.1344. [DOI] [PubMed] [Google Scholar]
- 6.Lin CC, Bruinooge SS, Kirkwood MK, et al. Association between geographic access to cancer care and receipt of radiation therapy for rectal cancer. Int J Radiat Oncol Biol Phys. 2016;94:719–728. doi: 10.1016/j.ijrobp.2015.12.012. [DOI] [PMC free article] [PubMed] [Google Scholar]
- 7.Goyal S, Chandwani S, Haffty BG, et al. Effect of travel distance and time to radiotherapy on likelihood of receiving mastectomy. Ann Surg Oncol. 2015;22:1095–1101. doi: 10.1245/s10434-014-4093-8. [DOI] [PMC free article] [PubMed] [Google Scholar]
- 8.Wheeler SB, Kuo TM, Durham D, et al. Effects of distance to care and rural or urban residence on receipt of radiation therapy among North Carolina Medicare enrollees with breast cancer. N C Med J. 2014;75:239–246. doi: 10.18043/ncm.75.4.239. [DOI] [PubMed] [Google Scholar]
- 9.Wheeler SB, Carpenter WR, Peppercorn J, et al. Structural/organizational characteristics of health services partly explain racial variation in timeliness of radiation therapy among elderly breast cancer patients. Breast Cancer Res Treat. 2012;133:333–345. doi: 10.1007/s10549-012-1955-2. [DOI] [PMC free article] [PubMed] [Google Scholar]
- 10.Scoggins JF, Fedorenko CR, Donahue SM, et al. Is distance to provider a barrier to care for medicaid patients with breast, colorectal, or lung cancer? J Rural Health. 2012;28:54–62. doi: 10.1111/j.1748-0361.2011.00371.x. [DOI] [PMC free article] [PubMed] [Google Scholar]
- 11.Lin CC, Bruinooge SS, Kirkwood MK, et al. Association between geographic access to cancer care, insurance, and receipt of chemotherapy: Geographic distribution of oncologists and travel distance. J Clin Oncol. 2015;33:3177–3185. doi: 10.1200/JCO.2015.61.1558. [DOI] [PMC free article] [PubMed] [Google Scholar]
- 12.Wan S, Jubelirer S. Geographic access and age-related variation in chemotherapy use in elderly with metastatic breast cancer. Breast Cancer Res Treat. 2015;149:199–209. doi: 10.1007/s10549-014-3220-3. [DOI] [PubMed] [Google Scholar]
- 13.Wheeler SB, Carpenter WR, Peppercorn J, et al. Predictors of timing of adjuvant chemotherapy in older women with hormone receptor-negative, stages II-III breast cancer. Breast Cancer Res Treat. 2012;131:207–216. doi: 10.1007/s10549-011-1717-6. [DOI] [PMC free article] [PubMed] [Google Scholar]
- 14.Rocque GB, Partridge EE, Pisu M, et al. The Patient Care Connect Program: Transforming health care through lay navigation. J Oncol Pract. 2016;12:e633–e642. doi: 10.1200/JOP.2015.008896. [DOI] [PMC free article] [PubMed] [Google Scholar]
- 15.Rocque GB, Taylor RA, Acemgil A, et al. Guiding lay navigation in geriatric patients with cancer using a distress assessment tool. J Natl Compr Canc Netw. 2016;14:407–414. doi: 10.6004/jnccn.2016.0047. [DOI] [PMC free article] [PubMed] [Google Scholar]
- 16.Klabunde CN, Potosky AL, Legler JM, et al. Development of a comorbidity index using physician claims data. J Clin Epidemiol. 2000;53:1258–1267. doi: 10.1016/s0895-4356(00)00256-0. [DOI] [PubMed] [Google Scholar]
- 17.Charlson ME, Pompei P, Ales KL, et al. A new method of classifying prognostic comorbidity in longitudinal studies: Development and validation. J Chronic Dis. 1987;40:373–383. doi: 10.1016/0021-9681(87)90171-8. [DOI] [PubMed] [Google Scholar]
- 18.Deyo RA, Cherkin DC, Ciol MA. Adapting a clinical comorbidity index for use with ICD-9-CM administrative databases. J Clin Epidemiol. 1992;45:613–619. doi: 10.1016/0895-4356(92)90133-8. [DOI] [PubMed] [Google Scholar]
- 19.Romano PS, Roos LL, Jollis JG. Adapting a clinical comorbidity index for use with ICD-9-CM administrative data: differing perspectives. J Clin Epidemiol. 1993;46:1075–1079. doi: 10.1016/0895-4356(93)90103-8. [DOI] [PubMed] [Google Scholar]
- 20.Zdab M. Driving Distances and Drive Times using SAS and Google Maps. 2016; SAS Macro for driving distance and drive times. http://www.sascommunity.org/wiki/Driving_Distances_and_Drive_Times_using_SAS_and_Google_Maps
- 21. Pyenson BS, Fitch K: Cancer patients receiving chemotherapy: Opportunities for better management. http://us.milliman.com/insight/research/health/Cancer-patients-receiving-chemotherapy-Opportunities-for-better-management/
- 22.Massarweh NN, Chiang YJ, Xing Y, et al. Association between travel distance and metastatic disease at diagnosis among patients with colon cancer. J Clin Oncol. 2014;32:942–948. doi: 10.1200/JCO.2013.52.3845. [DOI] [PMC free article] [PubMed] [Google Scholar]
- 23.Mokdad AH, Dwyer-Lindgren L, Fitzmaurice C, et al. Trends and patterns of disparities in cancer mortality among US counties, 1980-2014. JAMA. 2017;317:388–406. doi: 10.1001/jama.2016.20324. [DOI] [PMC free article] [PubMed] [Google Scholar]
- 24.Aquina CT, Probst CP, Becerra AZ, et al. High volume improves outcomes: The argument for centralization of rectal cancer surgery. Surgery. 2016;159:736–748. doi: 10.1016/j.surg.2015.09.021. [DOI] [PubMed] [Google Scholar]
- 25.Colavita PD, Tsirline VB, Belyansky I, et al. Regionalization and outcomes of hepato-pancreato-biliary cancer surgery in USA. J Gastrointest Surg. 2014;18:532–541. doi: 10.1007/s11605-014-2454-z. [DOI] [PubMed] [Google Scholar]
- 26.Mowat A, Maher C, Ballard E. Surgical outcomes for low-volume vs high-volume surgeons in gynecology surgery: A systematic review and meta-analysis. Am J Obstet Gynecol. 2016;215:21–33. doi: 10.1016/j.ajog.2016.02.048. [DOI] [PubMed] [Google Scholar]
- 27.Zafar SN, Shah AA, Channa H, et al. Comparison of rates and outcomes of readmission to index vs nonindex hospitals after major cancer surgery. JAMA Surg. 2018;153:719–727. doi: 10.1001/jamasurg.2018.0380. [DOI] [PMC free article] [PubMed] [Google Scholar]
- 28. Rocque G, Pisu M, Jackson B, et al: Trends in resource utilization and costs during implementation of a lay navigation program. J Clin Oncol 33:6502, 2015 (15 suppl) [Google Scholar]
- 29.Paskett ED, Harrop JP, Wells KJ. Patient navigation: An update on the state of the science. CA Cancer J Clin. 2011;61:237–249. doi: 10.3322/caac.20111. [DOI] [PMC free article] [PubMed] [Google Scholar]
- 30.Hanlon P, Daines L, Campbell C, et al. Telehealth interventions to support self-management of long-term conditions: A systematic metareview of diabetes, heart failure, asthma, chronic obstructive pulmonary disease, and cancer. J Med Internet Res. 2017;19:e172. doi: 10.2196/jmir.6688. [DOI] [PMC free article] [PubMed] [Google Scholar]
- 31.Tedder T, Elliott L, Lewis K. Analysis of common barriers to rural patients utilizing hospice and palliative care services: An integrated literature review. J Am Assoc Nurse Pract. 2017;29:356–362. doi: 10.1002/2327-6924.12475. [DOI] [PubMed] [Google Scholar]
- 32.Kutner JS, Kassner CT, Nowels DE. Symptom burden at the end of life: hospice providers’ perceptions. J Pain Symptom Manage. 2001;21:473–480. doi: 10.1016/s0885-3924(01)00281-0. [DOI] [PubMed] [Google Scholar]
- 33.FitzGerald JD, Soohoo NF, Losina E, et al. Potential impact on patient residence to hospital travel distance and access to care under a policy of preferential referral to high-volume knee replacement hospitals. Arthritis Care Res (Hoboken) 2012;64:890–897. doi: 10.1002/acr.21611. [DOI] [PMC free article] [PubMed] [Google Scholar]
- 34.Jia P, Xierali IM. Disparities in patterns of health care travel among inpatients diagnosed with congestive heart failure, Florida, 2011. Prev Chronic Dis. 2015;12:E150. doi: 10.5888/pcd12.150079. [DOI] [PMC free article] [PubMed] [Google Scholar]


