Abstract
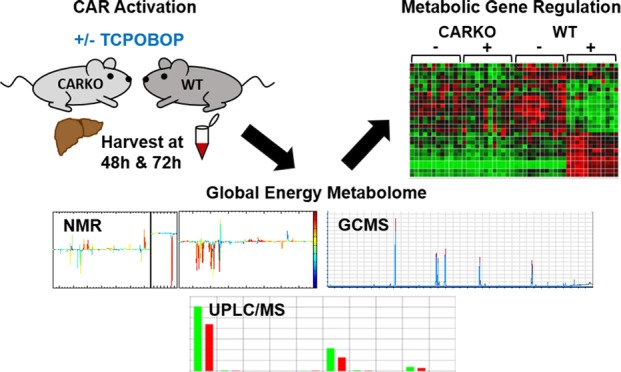
The constitutive androstane receptor (CAR; NR1I3) contributes important regulatory roles in biotransformation, xenobiotic transport function, energy metabolism and lipid homeostasis. In this investigation, global serum and liver tissue metabolomes were assessed analytically in wild type and CAR-null transgenic mice using NMR, GC–MS and UPLC–MS/MS-based metabolomics. Significantly, CAR activation increased serum levels of fatty acids, lactate, ketone bodies and tricarboxylic acid cycle products, whereas levels of phosphatidylcholine, sphingomyelin, amino acids and liver glucose were decreased following short-term activation of CAR. Mechanistically, quantitative mRNA analysis demonstrated significantly decreased expression of key gluconeogenic pathways, and increased expression of glucose utilization pathways, changes likely resulting from down-regulation of the hepatic glucose sensor and bidirectional transporter, Glut2. Short-term CAR activation also resulted in enhanced fatty acid synthesis and impaired β-oxidation. In summary, CAR contributes an expansive role regulating energy metabolism, significantly impacting glucose and monocarboxylic acid utilization, fatty acid metabolism and lipid homeostasis, through receptor-mediated regulation of several genes in multiple associated pathways.
Keywords: NR1I3, constitutive androstane receptor, metabolomics, energy metabolism
Introduction
The constitutive androstane receptor (CAR, NR1I3) is a nuclear receptor that regulates xenobiotic metabolism, detoxification, and clearance.1 Predominantly expressed in the liver, CAR functions as a heterodimer with the retinoid X receptor (RXR), binds to specific DNA motifs, and recruits coregulators to influence target gene transcription.2 CAR has been further elucidated as a key regulator of several energy pathways, and proposed as a potential target for metabolic diseases such as obesity, type 2 diabetes and cardiovascular disease.3−5
Activation of CAR by either 1,4-bis[2-(3, 5-dichloropyridyloxy)]benzene (TCPOBOP), a mouse-specific direct receptor agonist, or phenobarbital (PB), a prototypical indirect CAR activator, decreases blood glucose levels and increases insulin sensitivity in both rodent models and in human subjects.6,7 CAR activation also prevents obesity in a high fat diet (HFD)-induced obesity model and ameliorates liver steatosis in both the HFD-induced type 2 diabetic model and ob/ob mice.7,8 Further, activation of CAR with TCPOBOP in certain mouse models is atheroprotective, as indicated by reduction of cholesterol, lipoproteins and atherosclerotic lesions.9 More specifically, CAR activation reportedly increases the utilization of glucose in the liver by increasing the activities of hexokinase (HK), an enzyme responsible for the first irreversible step in glycolysis, and phosphogluconate dehydrogenase (PGD), a rate-limiting enzyme in the pentose phosphate pathway (PPP).8 Evidence suggests that CAR activation also inhibits expression of the gluconeogenic enzymes, phosphoenolpyruvate carboxykinase (Pepck) and glucose-6-phosphatase (G6pase), resulting in decreased glucose production by interfering with forkhead box protein O1 (FOXO1) and hepatocyte nuclear factor 4α (HNF4A) activity.10−12 Additional studies indicate that CAR acts with insulin-induced gene-1 (INSIG1) and/or sulfotransferase 2B1b (SULT2B1b) to suppress lipogenic gene expression, modulating expression of sterol regulatory element-binding protein-1c (Srebp-1c) and its downstream targets, fatty acid synthase (Fasn) and stearoyl-CoA desaturase 1 (Scd-1), which are involved in fatty acid biosynthesis.3,8,13
In these respects, previous investigators have largely used discrete analyses, focused on specific metabolic pathways, to determine the effects of long-term CAR activation on altered energy metabolism and transcriptional responses. To better delineate the more acute impact of CAR activation in vivo, we conducted the current investigation in mouse models to assess CAR as an effector of the global energy metabolome, as metabolomic analyses provide valuable insight linking transcriptional regulation, transcriptomics and the resulting phenotype in both normal and diseased states.14,15 Following TCPOBOP administration in wild type (WT) and CAR null/knockout (CARKO) mice, serum and liver metabolome alterations were analyzed using nuclear magnetic resonance (NMR), ultraperformance liquid chromatography–mass spectrometry (UPLC–MS) and gas chromatography–mass spectrometry (GC–MS). Quantitative real-time PCR (qPCR) assays were also conducted to assess the effects of CAR activation on the transcriptional profiles of genes mediating the regulatory pathways exhibiting altered metabolic function. The results of these investigations demonstrate that short-term CAR activation significantly impacts the global energy metabolome, altering levels of numerous metabolites related to glucose, fatty acid and phospholipid production. In these respects, mechanistic pathways accounting for CAR’s endocrinological effects were elucidated. The results provide an experimental basis for considering CAR as a therapeutic target for metabolic disease interventions.
Materials and Methods
Chemicals
TCPOBOP and dimethyl sulfoxide (DMSO) were purchased from Sigma-Aldrich (St. Louis, MO). TRIzol reagent was purchased from Life Technologies (Carlsbad, CA). All analytical grade organic reagents for GC, HPLC-mass spec and NMR (methanol, chloroform isopropanol, acetonitrile and hexane) were obtained from Sigma-Aldrich (St Louis, MO). Sodium 3-trimethylsilylm[2,2,3,3-d4]propionate (TSP-d4) and deuterium oxide (D2O; 99.9% in D) were purchased from Cambridge Isotope Laboratories (Miami, FL).
In Vivo Experiments
All animal care and experimental procedures complied with protocols approved by the Institutional Animal Care and Use Committee at The Pennsylvania State University. C57BL/6 WT male mice were purchased from Charles River (Horsham, PA) and permitted to acclimate at least 1 week prior to treatment. CARKO mice were generated by backcrossing WT mice with CAR-PXR double knockout mice obtained from Dr. Wen Xie at the School of Pharmacy at University of Pittsburgh.16 The mice were maintained under a standard 12 h light, 12 h dark cycle at a constant temperature (23 ± 1 °C) with 45–65% humidity. Water and standard chow were provided ad libitum.
For each time point and treatment, 6 male mice of approximately 8-weeks of age were used. Each mouse was treated with either a single dose of 2 mg/kg of TCPOBOP or the vehicle control (DMSO) via intraperitoneal (IP) injection. Both the initial and final body weights of the mice were recorded. After 48 or 72 h, blood and liver tissues were harvested from the mice immediately following euthanasia via CO2 asphyxiation. Blood was collected via cardiac puncture and then allowed to clot at room temperature for at least 30 min followed by centrifugation for 10 min at 3000g. The serum was aliquoted and stored at −80 °C. The liver tissue was weighed, divided and either placed in TRIzol reagent for RNA isolation or snap-frozen in liquid nitrogen for storage at −80 °C until use.
Serum Glucose Analysis
Serum glucose concentrations were measured using the Glucose Colorimetric Assay Kit (Cayman Chemical, Ann Arbor, MI), which utilizes the glucose oxidase-peroxide reaction. Following the manufacturer’s protocol, the serum was initially diluted 1:10 in the assay buffer. The glucose standard was diluted to construct a standard curve. Briefly, 85 μL of assay buffer was added to 15 μL of diluted samples and standards, then 100 μL of the glucose assay was added, and the reactions were incubated at 37 °C for 10 min. Absorbance was measured at 520 nm. The concentration of glucose in the serum was derived using the standard curve and dilution factors.
1H NMR Spectroscopy Analysis of Liver Tissue
Liver tissue sample preparation for NMR analysis were performed as previously described.17 Liver tissues (∼50 mg) were homogenized three times in 600 μL of an ice-cold methanol–water mixture (2/1, v/v) using the Precellys tissue homogenizer (Bertin Technologies, Rockville, MD). After centrifugation at 11 180g for 10 min at 4 °C, the aqueous supernatant was collected and dried. Each of the water-soluble extracts was separately reconstituted into 600 μL of phosphate buffer (K2HPO4/NaH2PO4, 0.1 M, pH 7.4, 50% v/v D2O) containing 0.005% TSP-d4 as a chemical shift reference. After centrifugation, 550 μL of each extract was transferred into a 5 mm NMR tube for NMR analysis. For more detailed methods regarding 1H NMR spectroscopy, see Supporting Information.
Fatty Acid Profiling of Liver Tissue Using GC–MS
Liver tissue sample preparation for fatty acid profiling by GC–MS were performed as previously described.17 Liver tissues (∼50 mg) were extracted with 1 mL of methanol–chloroform (2/1, v/v) containing 5 μL internal standards (50 μM C15:0 free acid and the methyl ester of C17:0) and then homogenized using the Precellys tissue homogenizer (Bertin Technologies, Rockville, MD). Liver homogenates were centrifuged at 20 187g for 15 min at 4 °C. The supernatant was collected and 500 μL of saline (0.9%) was added. The mixture was vortexed for 5 min and centrifuged at 20 187g for 15 min at 4 °C. The solution in the bottom layer was transferred to a 10 mL glass tube and evaporated to dryness under nitrogen. The residue was reconstituted with 1 mL of MeOH/HCl (41.5 mL/9.7 mL), vortexed for 5 min, and incubated overnight at 60 °C. Samples were mixed with 5 mL of hexane and 5 mL of saline, and vortexed for 5 min. The upper organic phase was taken, dried down with nitrogen gas, resuspended in 200 μL of hexane, and then transferred to an autosampler vial for GC–MS analysis. For more detailed methods regarding fatty acid profiling using GC–MS, see Supporting Information.
Total Serum Global Lipid Profiling by UPLC–MS
Total lipids in serum were extracted using the Folch method.18 Briefly, 25 μL of serum was mixed with 100 μL of chloroform and methanol (2:1 v/v) containing 2 μg triacylglycerol (50:1). The samples were incubated at room temperature for 5 min after vortexing. Following centrifugation (13 000g, 4 °C) for 10 min, the bottom layer was collected and then dried under a gentle stream of nitrogen gas. The samples were dissolved with 125 μL of solution containing isopropyl alcohol, acetonitrile, and water (2:1:1 v/v/v). Following vortex and centrifugation, 100 μL of supernatants were transferred to an autosampler vial. For more detailed methods regarding total serum global lipid profiling by UPLC–MS, see Supporting Information.
RNA Isolation from Liver Tissues and Gene Expression by Real-Time qPCR
RNA was isolated from mouse liver tissues using TRIzol Reagent and converted to cDNA using the High Capacity cDNA Archive Kit (Applied Biosystems; Foster City, CA) according to the manufacturer’s protocols. Real-time qPCR was performed with PerfeCTa SYBR Green SuperMix, UNG, ROX (Quanta BioSciences, Gaithersburg, MD). Fifty ng of cDNA template, 15 μL of 2× SYBR green Master Mix, 0.1 μM final concentrations of forward and reverse primers were added into 30 μL reactions. The reactions were divided in half to generate technical replicates and run on a CFX96 Touch Real-Time PCR Detection System (Bio-Rad, Hercules, CA). Data were analyzed using the ΔΔCT method as previously described.19 All experiments were performed in accordance with the Minimum Information for Publication of Quantitative Real-Time PCR Experiment (MIQE) guidelines.20 Details of the SYBR Green Primers used in the assays are summarized in Supplemental Table S1.
Data Analysis
All the experimental values are presented as mean ± s.d. Graphical illustrations and statistical analysis were performed with GraphPad Prism version 6.0 (GraphPad). P-values < 0.05 were considered significant.
Results
Evaluation of Body and Liver Weight of WT and CARKO Mice Following Short-Term TCPOBOP Exposure
The effects of short-term CAR activation on the body and liver weight of WT and CARKO mice were assessed using the specific mouse CAR ligand, TCPOBOP, at 48 or 72 h following a single IP dose of either DMSO or TCPOBOP. Resulting animal weights, presented as percent body weight compared to initial weight (A) and excised liver wet weights for each mouse, presented as liver to body percentage (B), are shown in Figure 1.
Figure 1.
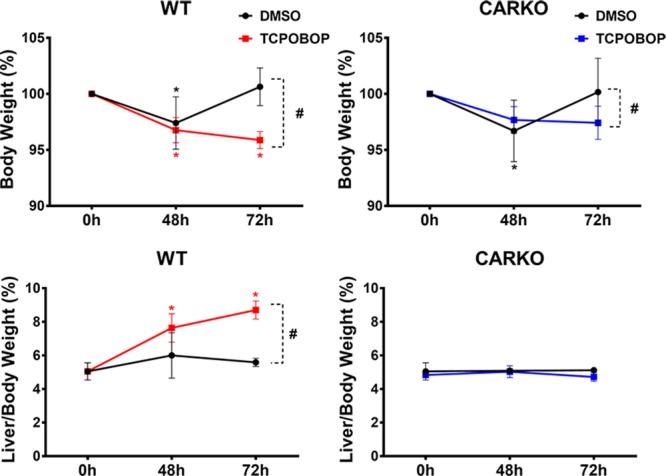
Body weights were measured for all mice prior to treatment (0 h) and following DMSO or TCPOBOP at the time of harvest (48 and 72 h). Livers were harvested and the weight recorded for untreated (0 h) and treated (48 and 72 h) mice. Body weight percentage for WT and CARKO mice (top) was calculated by comparing the body weight at the indicated time point to the initial weight at 0 h. Liver/body weight percentage (bottom) was calculated by comparing the liver weight to the body weight on the day of harvest. Data are represented as the mean of biological replicates ± s.d. Significance between initial weight and each time point indicated by * (p < 0.05). Significance between DMSO and TCPOBOP treatment at each time point indicated by # (p < 0.05).
At 72 h post exposure to TCPOBOP, both WT and CARKO animals exhibited significantly lower body weights when compared to their respective DMSO controls (Figure 1, top). Liver to body weight ratios revealed that only WT mice treated with TCPOBOP exhibited significant liver weight gain relative to their vehicle control DMSO counterparts (Figure 1, bottom). The latter results indicate that the gain in liver weights were a direct result of CAR activation, as were the subsequent phenotypic effects noted below related to overall glucose and lipid profiles.
Expression of Known CAR Target Genes Involved in Xenobiotic Metabolism in Response to TCPOBOP
To confirm efficacy of the experimental design, expression of several hallmark CAR-regulated, hepatic target genes was assessed using qPCR. Among the transcripts measured, expression of phase I xenobiotic gene transcripts, cytochrome p450s (Cyp2b10, Cyp3a11, and Cyp1a1), and the phase II transcript, UDP glucuronosyltransferase 1 family, polypeptide A1 (Ugt1a1), were markedly up-regulated in WT but not CARKO mice following both 48 and 72 h exposures to TCPOBOP (Figure S1A and S1B). Although glutathione S-transferase, pi 1 (Gstp1) expression levels were not significantly altered by treatments in either group of mice (Figure S1B), the transcript for growth arrest and DNA-damage-inducible beta (Gadd45B), a CAR target gene associated with cell growth and apoptotic responses, was significantly increased in WT mice treated with TCPOBOP treatment, but not in CARKO animals (Figure S1C). These results affirm the efficacy of the experimental model with respect to CAR activation responses.
Determination of Glucose Concentration and Metabolites in Serum
To evaluate serum glucose levels after short-term exposure to TCPOBOP, glucose concentrations from WT and CARKO mouse serum were measured using a glucose colorimetric assay. The results demonstrated a significant decrease in glucose concentrations at both 48 and 72 h in WT mice following TCPOBOP treatment compared to their respective DMSO controls, effects not apparent in CARKO mice (Figure 2).
Figure 2.
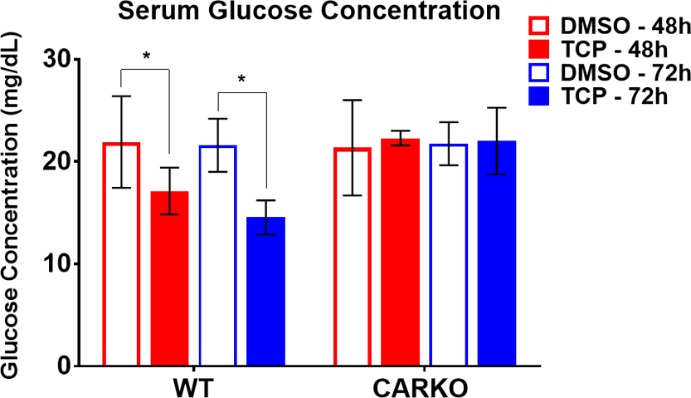
Serum glucose comparisons. Serum glucose concentration for WT and CARKO mice treated with DMSO or TCPOBOP at 48 and 72 h using the glucose colorimetric assay kit (* p < 0.05).
Metabolic Profiling by 1H NMR Analysis in Liver Aqueous Extract Samples
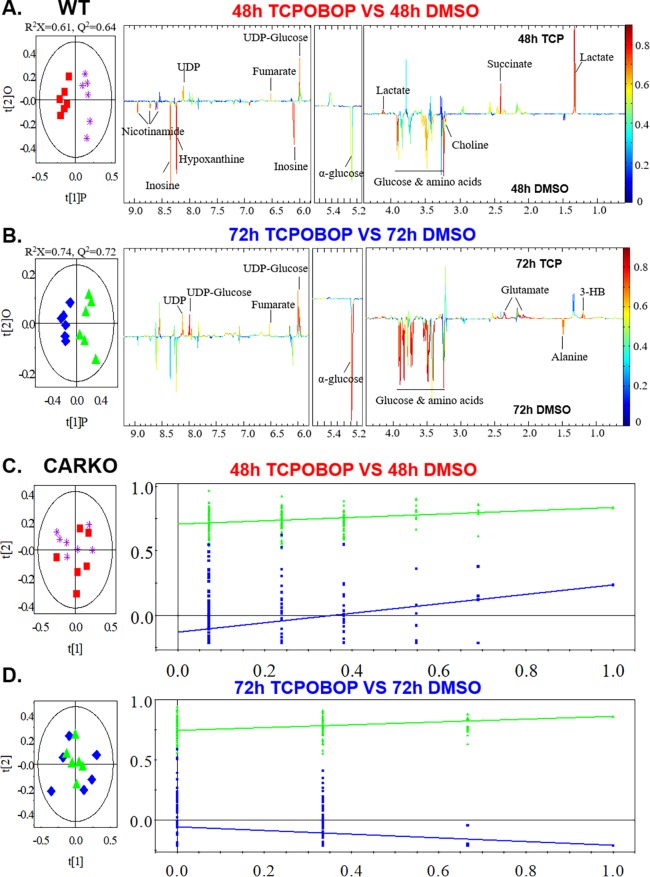
The effect of short-term CAR activation on the liver energy metabolome was determined by using 1H NMR analysis following tissue harvest at 48 and 72 h. An overview of global metabolite changes was initially constructed by principal component analysis (PCA), using normalized NMR data to visualize the correlation between different groups and exclude abnormal data points. Orthogonal partial least-squares discriminant analysis (OPLS-DA) of NMR data was subsequently performed to further enhance the separation between DMSO and TCPOBOP groups in WT or CARKO mice. The cross-validated score plots demonstrated that significant intergroup metabolomic separations were apparent in both 48 and 72 h treated WT mice (Figure 3A,B), but not in CARKO mice (Figure 3C,D). Further, the corresponding OPLS-DA correlation coefficient plots provided insight into the relative contribution of the metabolites. Compared to the DMSO group, the quality indicators of OPLS-DA for the R2X and Q2 parameters among the 48 h TCPOBOP group of WT mice were 0.61 and 0.64, respectively. Likewise, the variance derived from the 72 h WT mouse group presented as R2X = 0.74 and Q2 = 0.72. Therefore, the values for R2X and Q2 > 0.4 in the models clearly indicate the wellness of fit for the NMR data (Figure 3A,B). The results from the model evaluation with CV-ANOVA and permutation tests further suggested that the models constructed from the spectra data at 48 and 72 h were distinctive with respect to their metabolite profiles, and their CAR dependency.
Figure 3.
Mouse liver tissue was extracted and subjected to 1H NMR. Multivariate data analysis was performed to evaluate the differences between DMSO and TCPOBOP treated WT mice at 48 (A) and 72 h (B) time points as well as CARKO mice at 48 (C) and 72 h (D). OPLS-DA scores (left) and coefficient-coded loadings plots (right) for the models were obtained from NMR data. The OPLS-DA models were validated using a 7-fold cross validation method, and the quality of the model was described by the parameters R2X and Q2 values. Color-coded correlation coefficient loading plots were employed to indicate the significance of the metabolite contribution to the class separation with a “hot” color (e.g., red) being more significant than a “cold” color (e.g., blue). A cutoff value of |r| > 0.707 (r > +0.707 and r < −0.707) was chosen for the correlation coefficient as significant based on the discrimination significance (p ≤ 0.05).
The metabolites exhibiting statistical discrimination between the DMSO and TCPOBOP-treated WT groups are labeled in the corresponding color-coded coefficient plots (Figure 3A,B). Typical 600 MHz 1H NMR spectra and metabolite assignments of the liver samples are shown in Figure S2. Compared to DMSO-treated WT mice, the liver NMR spectra demonstrated that levels of lactate, UDP, UDP-glucose, ketone bodies and tricarboxylic acid cycle (TCA cycle) products, including succinate, were significantly up-regulated at 48 h with TCPOBOP treatment, whereas the levels of hepatic glucose, inosine and amino acids were suppressed. These pattern alterations were not observed in CARKO mice. Interestingly, at 72 h the level of lactate in TCPOBOP-treated WT mice was similar to the DMSO-treated WT mice, whereas glutamate was moderately elevated. The levels of both glucose and amino acids remained suppressed with the longer time interval TCPOBOP treatment, indicating that shorter-term TCPOBOP exposure selectively triggers CAR-specific metabolic responses.
Hepatic mRNA Analysis Related to Glucose Metabolism
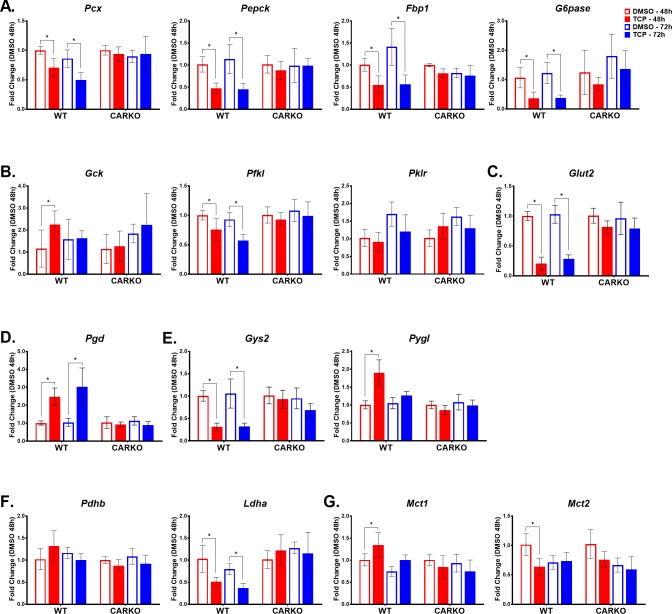
To mechanistically examine CAR’s potential role as a transcriptional regulator of glucose metabolism, qPCR analysis was used to assess hepatic transcript levels for several genes functional in gluconeogenesis and glycolysis. As previously reported and consistent with the current data, longer-term treatments with the CAR activators PB and TCPOBOP inhibited hepatic mRNA levels of Pepck and G6pase in mouse livers.21 In addition, our data demonstrated that mRNA expression levels of other key gluconeogenic enzymes, namely pyruvate carboxylase (Pcx) and fructose-1,6-bisphosphatase (Fbp1), were significantly down-regulated in TCPOBOP-treated WT mice at both 48 and 72 h time points (Figure 4A). There were no significant changes in expression of these transcripts in the CARKO mice. On the other hand, the expression level of glucokinase (Gck), the first rate-limiting enzyme in the glycolysis pathway, converting glucose to glucose-6-phosphate (glucose-6P), was significantly and selectively up-regulated in WT mice following 48 h of TCPOBOP treatment, levels that then normalized after 72 h of treatment (Figure 4B). Interestingly, the transcript level for a downstream enzyme in glycolysis, phosphofructokinase (Pfkl), was significantly suppressed in TCPOBOP-treated WT mice at both 48 and 72 h, an effect that was CAR specific. However, the expression of pyruvate kinase (Pklr), which converts phosphoenolpyruvate to pyruvate in the last step of glycolysis, remained unchanged in both WT and CARKO mice treated with TCPOBOP when compared to the respective DMSO controls (Figure 4B). Also of note, following TCPOBOP treatment, the hepatic mRNA expression level of glucose transporter 2 (Glut2), an important glucose sensor and bidirectional transporter, was significantly down-regulated in WT mice at both 48 and 72 h, whereas no significant change occurred in CARKO mice. Importantly, these results imply that CAR functions to regulate transport of glucose across the cell membrane (Figure 4C).
Figure 4.
TCPOBOP treatment significantly alters expression of several genes involved in the transport and metabolism of glucose and monocarboxylic acids at both 48 and 72 h time points in WT mice alone indicating CAR specificity. Real-time qPCR was performed to determine the mRNA expression levels of genes involved in the following pathways: gluconeogenesis (A), glycolysis (B), glucose transport (C), pentose phosphate pathway (D), glycogen metabolism (E), pyruvate metabolism (F), and monocarboxylic transport (G). Data are represented as the mean of biological replicates ± s.d. Significance between DMSO and TCPOBOP treatment groups at each time point indicated by * (p < 0.05).
Glucose-6-P, a product of glucose, is a primary substrate for number of metabolic pathways, including the pentose phosphate pathway (PPP).22 Our results show that TCPOBOP-treated WT mice exhibited significantly higher transcript levels for phosphogluconate dehydrogenase (Pgd), the second dehydrogenase in the PPP, whereas expression levels of Pgd in the CARKO mice were unchanged (Figure 4D). Glucose-6-P is also the principal substrate and product for glycogenesis and glycogenolysis, respectively. Glycogen synthase 2 (Gys2) catalyzes the rate-limiting step in the synthesis of glycogen from UDP-glucose. Conversely, glycogen phosphorylase (Pygl) catalyzes the conversion of glycogen to glucose-6-P. According to the NMR data, levels of UDP-glucose in the liver increase following treatment with TCPOBOP (Figures 3A,B). Interestingly, following CAR activation, Gys2 mRNA expression was significantly decreased at both 48 and 72 h, whereas Pygl expression was significantly increased only at 48 h, with no significant changes noted in CARKO mice (Figure 4E). These data support CAR’s role as a regulator of both the synthesis and degradation of glycogen in the maintenance of energy homeostasis.
The NMR data analysis indicated elevated levels of lactate in the livers of WT mice 48 h following treatment with TCPOBOP. To determine a possible mechanism, mRNA expression of genes involved in monocarboxylate metabolism were investigated. Results clearly demonstrated that TCPOBOP treatment inhibited the expression of lactate dehydrogenase A (Ldha), which converts pyruvate to lactate in liver, at both 48 and 72 h, but did not alter the expression of pyruvate dehydrogenase beta (Pdhb), responsible for the oxidative decarboxylation of pyruvate (Figure 4F). Monocarboxylate transporters 1–4 (Mct) function in the transport of lactate, pyruvate, and ketone bodies across the cell membranes and are important for maintaining normal metabolic homeostasis. Of note, in 48 h TCPOBOP-treated WT mice, the expression of Mct1, whose substrates include l-lactate, pyruvate, hydroxybutyrate, and acetoacetate, was significantly up-regulated, whereas the expression of Mct2, which has a higher affinity for both pyruvate and lactate than Mct1, was significantly down-regulated (Figure 4G). In CARKO mice, TCPOBOP treatments failed to produce significant changes in either Mct1 or Mct2 expression when compared to their DMSO-treated controls. Thus, the data suggest that CAR functions to modulate these transporters for maintenance of energy homeostasis and intracellular pH balance.
Hepatic Fatty Acid Composition Analysis
The hepatic fatty acid compositions of the WT and CARKO mice treated with DMSO or TCPOBOP was determined by GC–MS and the data are presented in Figure 5. CAR activation by TCPOBOP in WT mice led to significantly increased hepatic levels of several fatty acids, including saturated fatty acids (C16:0 and C18:0), monosaturated fatty acid (C18:1n9) and polyunsaturated fatty acid (C18:2), at 48 and 72 h, compared with the DMSO-treated control group (Figure 5A). The concentration of C16:0 was initially increased at 48 h but recovered to control levels after 72 h (Figure 5A). No changes in hepatic fatty acid composition were observed in CARKO mice after short-term treatment with TCPOBOP, indicating that these changes are CAR specific (Figure 5B).
Figure 5.
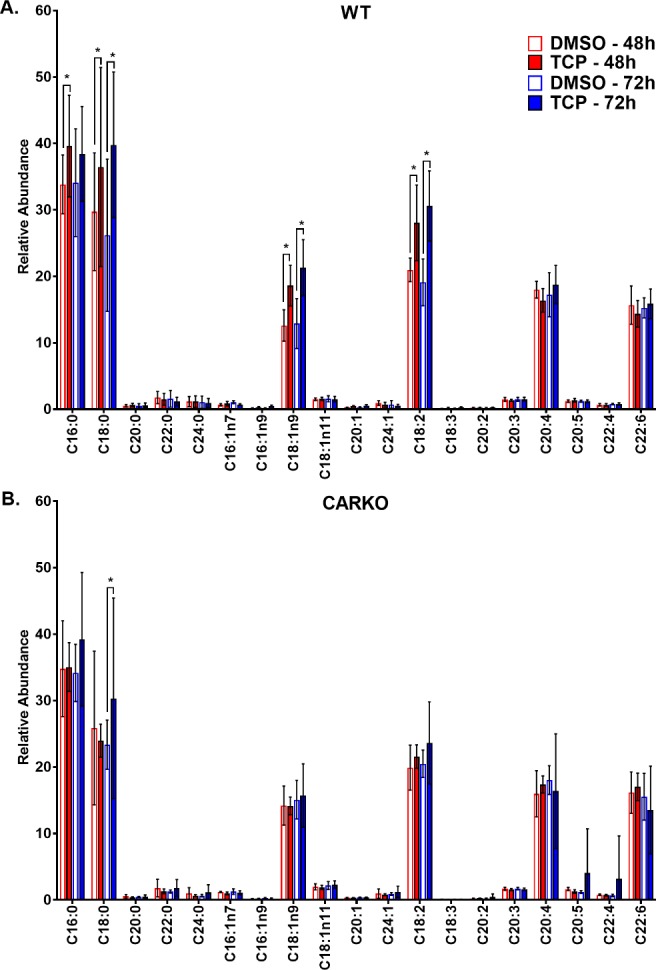
GC–MS fatty acid profile of mouse liver tissue from WT (A) and CARKO (B) mice treated with DMSO and TCPOBOP at 48 and 72 h time points. Data are represented as the mean of biological replicates and standard deviation. Significance between DMSO and TCPOBOP treatments at each time point indicated by * (p < 0.05).
Hepatic mRNA Analysis Related to Fatty Acid Metabolism
In response to the increased levels of FAs in the TCPOBOP-treated WT mouse liver, we examined mRNA transcript levels for several key enzymes associated with hepatic fatty acid synthesis, beta-fatty acid oxidation and lipogenesis. Enzymes controlling de novo fatty acid biosynthesis, specifically fatty acid synthase (Fasn) and acetyl-CoA carboxylase 1 (Acaca), exhibited statistically significant enhanced mRNA levels 48 h after CAR activation by TCPOBOP. However, the expression levels of Fasn and Acaca were dynamic over time, initially elevated at 48 h following TCPOBOP treatment and then decreased at 72 h (Figure 6A). Further, the mRNA levels for sterol regulatory element binding protein-1 (Srebp-1), a key factor regulating the transcription of downstream targets, Fasn and Acaca, was significantly decreased in WT mouse livers following TCPOBOP treatment at 48 h and further reduced at 72 h (Figure 6B). In addition, expression of stearoyl-CoA desaturase-1 (Scd-1), a key enzyme in unsaturated fatty acid synthesis, was significantly decreased in WT mice following 72 h exposure to TCPOBOP treatment (Figure 6B). These altered gene expression patterns were not evident in CARKO mice following TCPOBOP treatment, confirming these responses as CAR specific.
Figure 6.
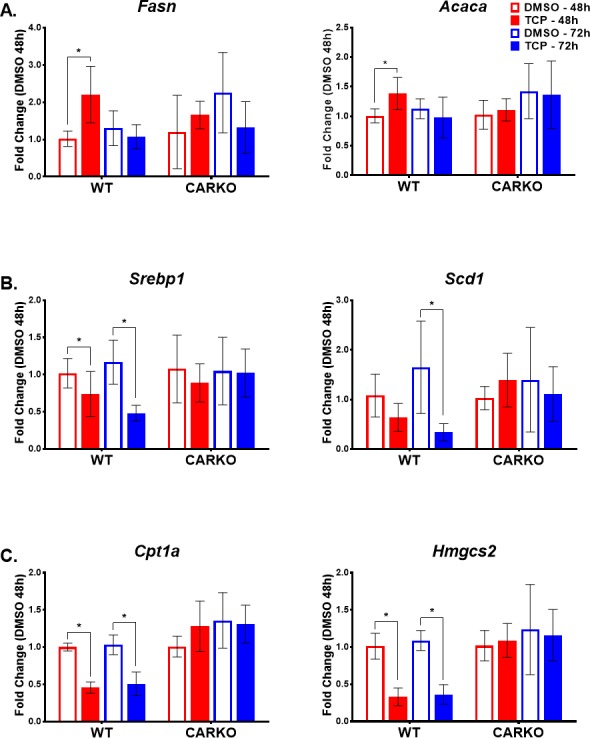
TCPOBOP treatment significantly alters expression of several genes involved in fatty acid metabolism and transport at both 48 and 72 h time points in WT mice alone indicating CAR specificity. Real-time qPCR was performed to determine the mRNA expression levels of genes involved in regulating: fatty acid synthesis (A), lipid biosynthesis and homeostasis (B), and upstream and downstream pathways of β-oxidation (C). Data are represented as the mean of biological replicates ± s.d. Significance between DMSO and TCPOBOP treatment groups at each time point indicated by * (p < 0.05).
Previous reports speculated that the increase in TCA intermediates such as fumarate, malate, and α-ketoglutarate following CAR activation is a result of increased beta-oxidation of fatty acids, thus providing increased amounts of acetyl-CoA as fuel for the TCA cycle.8 However, TCPOBOP-treated WT mice, at both 48 and 72 h, exhibited a significant reduction in the expression of carnitine palmitoyltransferase 1A (Cpt1a), a key enzyme involved in the carnitine-dependent transport of fatty acids across the mitochondrial inner membrane, utilized for beta-oxidation (Figure 6C). Further, and possibly as a result of decreased beta-oxidation, HmgCoA synthase 2 (Hmgcs2), an important enzyme regulating the conversion of acetoacetyl-CoA to beta-hydroxy-B-methylgluctaryl-CoA in the first step of ketogenesis, was down-regulated in WT mice with CAR activation, and this effect was CAR specific (Figure 6C).
Lipid Profiling by UPLC–MS Analysis in Serum
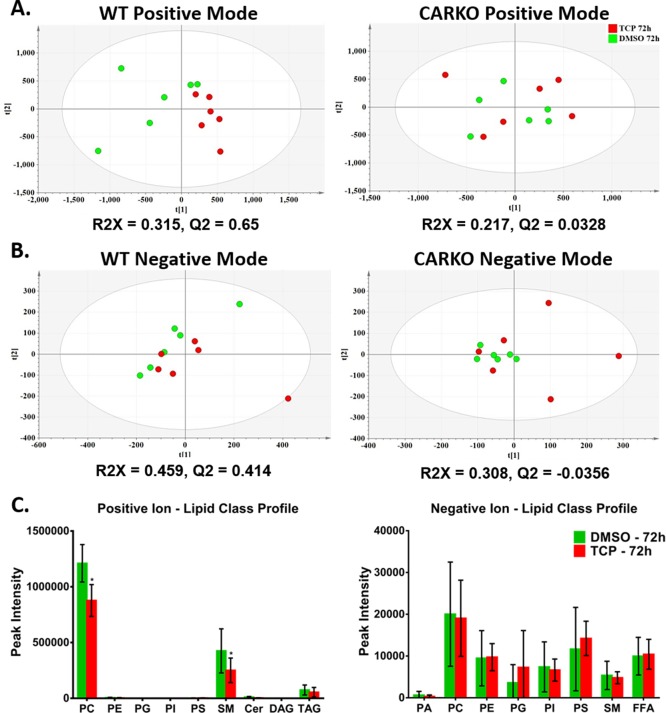
Initially, our serum GC–MS analysis identified lowered cholesterol levels in WT mice following 72 h TCPOBOP treatment, but not in CARKO mice (data not shown). To further assess the lipid metabolism profile in serum, we used UPLC–MS analysis to conduct comparative serum metabolomics profiling in serum harvested from WT mice or CARKO mice in the absence and presence of TCPOBOP 72 h treatments. Initially, PCA indicated distinct clustering in the WT mice, but not in CARKO mice (Figure 7A and B). To highlight the metabolic differentials between 72 h DMSO and TCPOBOP-treated groups in WT or CARKO mice, OPLS-DA was performed. These analyses resulted in acceptable R2X and Q2 scores (R2X or Q2 > 0.4), but only in WT mice, providing strong support for the model quality in this CAR-dependent group, but not for the CARKO mice (Figure 7A and 7B).
Figure 7.
Serum lipid composition for WT and CARKO mice were determined using UPLC–MS. PCA was used to examine differences for both positive (A) and negative (B) ion modes between DMSO and TCPOBOP treatment group for both WT and CARKO mice at 72 h. OPLS-DA was performed to determine the quality of each model (R2X and Q2). For WT mice, lipid class profiles (C) for positive and negative ion modes reveal altered profiles with TCPOBOP for PC and SM, specifically. Data are represented as the mean of biological replicates ± s.d. Significance between DMSO and TCPOBOP treatment groups at each time point indicated by * (p < 0.05). [Phosphatidic acid (PA), phosphatidylcholine (PC), phosphatidyl ethanolamine (PE), phosphatidyl glyercol (PG), phosphatidyl inositol (PI), phosphatidyl serine (PS), sphingomyelin (SM), diacylglycerides (DAG) and triacylycerides (TAG)].
To obtain total changes of lipid composition in serum, LipidView software was used for automated data processing and lipid species identification. We compared total serum lipid classes in the WT mice, in the absence or presence of 72 h TCPOBOP treatment. The results revealed that levels of phosphatidylcholine (PC) and sphingomyelin (SM) lipid classes were significantly decreased in the TCPOBOP-treated group of WT mice compared with the DMSO group (Figure 7C). No significant differences were identified between levels of any other serum lipid in either the TCPOBOP-treated group or DMSO-control group.
Hepatic mRNA Analysis Related to CAR-Mediated Alterations in Lipid Metabolism
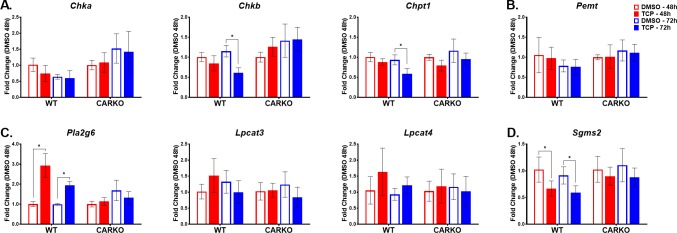
To mechanistically assess these CAR-mediated changes, we evaluated changes in hepatic transcript levels in WT and CARKO mice for key genes involved in PC and SM biosynthesis and/or degradation. Short-term TCPOBOP treatment in WT mice significantly suppressed the expression of choline kinase b (Chkb) and choline phosphotransferase 1 (Chpt1) mRNAs, responsible for PC synthesis from choline (Figure 8A). Additional pathways for PC synthesis derive from phosphatidyl ethanolamine (PE) methylation by the phosphatidylethanolamine N-methyltransferase (Pemt) and lyso-PC reacylation by lyso-PC acyltransferases (Lpcats). Treatment with TCPOBOP did not effect the expression of Pemt and Lpcats in either WT or CARKO mice (Figure 8B and C, respectively). However, CAR activation by TCPOBOP likely enhances PC degradation in WT mice by increasing the expression of phospholipase A2 group VI, (Pla2g6) (Figure 7C). Further, SM is synthesized in the liver by the transfer of phosphorylcholine from PC to a ceramide in a reaction catalyzed by sphingomyelin synthases 2 (Sgms2). Our data indicated that Sgms2 expression significantly declined after both 48 and 72 h TCPOBOP treatments in WT mice, patterns not detected in CARKO mice (Figure 8D).
Figure 8.
TCPOBOP treatment significantly alters expression of several genes involved in lipid metabolism at both 48 and 72 h time points in WT mice alone indicating CAR specificity. Real-time qPCR was performed to determine the mRNA expression levels of genes involved in regulating: PC synthesis from choline (A) and PE (B), PC reacytilation/degradation (C) and SM synthesis (D). Data are represented as the mean of biological replicates ± s.d. Significance between DMSO and TCPOBOP treatment groups at each time point indicated by * (p < 0.05).
Discussion
It is increasingly important to recognize CAR’s potential to impact a myriad of biological responses, including hepatic xenobiotic and endobiotic metabolism, rodent liver tumor promotion and alterations in energy and lipid homeostasis. In the current study, we combined multiple metabolomics analyses with mechanistically targeted gene expression measures to assess the comparative systems biology of CAR activation in WT and CARKO transgenic mice. The analyses enabled a global view of the metabolomics and biological pathway differences caused by short-term, 48 and 72 h TCPOBOP exposures. As implied by previous reports, the current results demonstrate that CAR activation indeed results in marked changes in endocrine biology. However, the comprehensive metabolomics analyses employed here, together with the shorter-term CAR activation window, enabled identification of metabolic profiles in both serum and liver tissues that differ significantly from previous reports. The results relating to glucose metabolism, glycolytic pathways, fatty acid metabolism, total lipid and thyroid hormone regulation are discussed below.
Glucose Metabolism
Results obtained from both NMR and glucose colorimetric assays demonstrated that glucose levels in both liver tissue and serum of WT mice were significantly reduced after 48 and 72 h TCPOBOP exposures, and that these effects were CAR-dependent (Figure 2 and 3). Activation of CAR negatively impacted the liver’s capacity to generate glucose, similar to the effect of insulin, and mechanistically these effects result from CAR’s suppression of gluconeogenic gene expression.23,24 The results presented in the current investigation confirm that activation of CAR with TCPOBOP inhibits transcript expression levels for key enzymes involved in gluconeogenesis, PCX, PEPCK, FBP1, and G6Pase (Figure 9). It was previously noted that CAR suppresses glucose production by competing with FOXO1, PGC1 and HNF4A for binding within gluconeogenic gene promoters.10,11 More recently, it was reported that the ubiquitination and degradation of PGC-1 facilitated by CAR also contributes to the gluconeogenesis inhibition.25
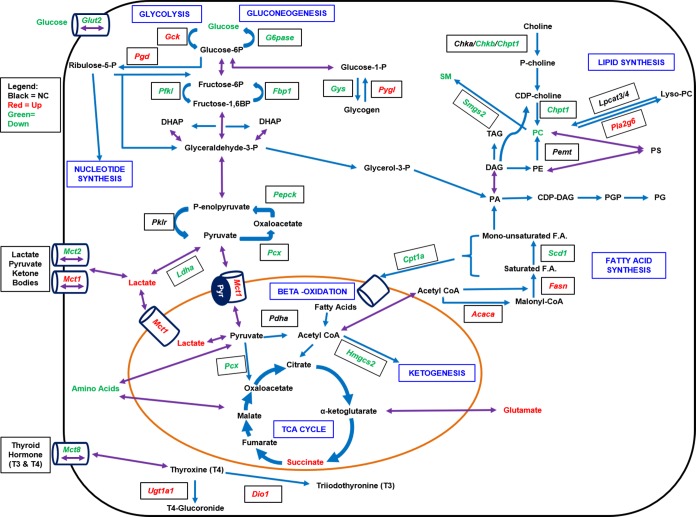
Figure 9.
Several pathways are involved in energy metabolism and homeostasis including gluconeogenesis, glycolysis, lipogenesis, fatty acid synthesis and beta-oxidation. As well, thyroid hormone metabolism impacts energy homeostasis. Activation of CAR differentially regulates several genes in these pathways. Red color signifies a measured increase in mRNA expression in WT mice at 48 and/or 72 h with TCPOBOP, whereas green indicates a decrease in expression levels.
It is noteworthy that our data suggest that increased expression of Gck, the first enzyme involved in glycolysis, together with Pgd, an enzymatic step forwarding to the pentose phosphate pathway (PPP), facilitates an increased consumption and utilization of glucose following TCPOBOP-mediated CAR activation. The pentose phosphate pathway utilizes glucose-6-P as its primary substrate, resulting in the formation of ribose 5-phosphate (R5P) for the synthesis of nucleotides, RNA, and DNA, providing subsequent support of cell growth and proliferation function, as well as formation of NADPH for metabolic biosynthetic reactions.26 Consequently, the current NMR results strongly support the idea that CAR activation can directly modulate the pentose phosphate pathway. Consistent with this interpretation are the increased levels of UDP metabolites detected in WT mice following 48 and 72 h CAR activation with TCPOBOP. UDP metabolites contribute importantly to galactose glycolysis and other metabolic pathways. In contrast to the CAR-mediated up-regulation of UDP metabolites, CAR activation resulted in significantly decreased levels of nicotinamide, hypoxanthine, and inosine (48 h; Figure 3). Further investigation will be required to determine more specifically CAR’s role in regulating these latter metabolites, which are involved in nucleotide synthesis downstream of the pentose phosphate pathway.
Following CAR’s activation with TCPOBOP, transcript expression levels in liver for the bidirectional transporter and glucose sensor, Glut2, were significantly decreased in WT mice, an effect not apparent in CARKO mice. Mechanistically, it appears likely that this CAR-dependent effect contributes to a reduction in hepatic glucose uptake, inducing a state of starvation that subsequently leads to inhibition of glycogenesis and subsequent stimulation of glycogenolysis. In this scenario, mobilization of glycogen would serve as a source of energy to compensate for the decreased availability of hepatic glucose (Figure 9). Our qPCR results further revealed that expression of Gys2 was significantly decreased at both the 48 and 72 h TCPOBOP exposures in WT but not CARKO mice, and that expression of Pygl is significantly increased after 48 h of CAR activation. Therefore, CAR may function to influence the activity of these genes by decreasing the expression of protein phosphatase 1, regulatory subunit 3c (Ppp1r3c), whose activity is known to activate Gys2, reduce Pygl activity, and limit glycogen breakdown.27 Taken together with the increase in UDP-glucose metabolites, activation of CAR target genes may direct increased consumption of glycogen, maintaining systemic energy homeostasis and providing adequate levels of glucose-6-P for other essential metabolic pathways, including xenobiotic metabolism.
Regarding aerobic and anaerobic glycolysis, the NMR data demonstrated that CAR-specific activation results in significantly increased levels of lactate, ketone bodies, and the TCA cycle products, particularly succinate. Pyruvate is the end product of glycolysis and a key substrate for many metabolic processes, including gluconeogenesis. Through conversion to acetyl-CoA via aerobic glycolysis, pyruvate provides substrate for the TCA cycle and fatty acid synthesis.28 Further, pyruvate can interconvert to lactate or alanine to maintain energy homeostasis.28 In this regard, hepatic lactate levels were elevated in response to acute TCPOBOP treatment in WT but not CARKO mice. It is likely that elevated lactate results from the suppression of gluconeogenesis, as effected by CAR activation. In support of this view, hepatic expression of Ldha, which catalyzes the interconversion of pyruvate and lactate, was significantly down-regulated following short-term CAR activation with TCPOBOP. Elevated levels of lactate in WT mice were only observed at 48 h. Thus, acute CAR activation may also mediate the transport of lactate, pyruvate and ketone bodies across the cell membrane, resulting from enhanced Mct1 and decreased Mct2 expression, contributing to short-term normalization of these hepatic substrate levels (Figure 9).
Fatty Acid Metabolism
In addition to CAR’s effects on glucose levels and glycolytic pathways, activation of the receptor resulted in significant alterations in fatty acid metabolism. Fatty acids may be broken down to acetyl-CoA following β-oxidation to provide fuel for the TCA cycle and other metabolic processes. Dong et al. reported that treatment with TCPOBOP for one month improved hepatic steatosis by inhibiting hepatic lipogenesis and inducing β-oxidation.8 In a separate study, low density lipoprotein receptor (LDLR)-deficient mice treated with TCPOBOP exhibited a decrease in plasma cholesterol and triglycerides level.9 Conversely, another report indicated that CAR activation in mice contributed to increased serum triglycerides and suppression of liver β-oxidation.29 Our GC–MS fatty acid analysis of liver tissue revealed that treatment with TCPOBOP for 48 or 72 h increased specific hepatic fatty acid levels (C16:0, C18:0, C18:1n9, and C18:2) selectively in WT mice. In this respect, RNA expression for genes involved in fatty acid synthesis, Fasn and Acaca, was significantly increased at 48 h in WT mice, whereas RNA levels of Cpt1a, an important enzyme involved in the mitochondrial transport of FAs for β-oxidation, were decreased at both time points. Further, transcript levels for enzymes involved in downstream metabolic processes, such as ketogenesis (Hmgcs2) and de novo lipogenesis (Scd1 and Srebp1c), were significantly decreased by CAR activation, in WT but not CARKO mice (Figure 9). Interestingly, others reported that Srebp-1 affects non-DNA binding domains of PXR and CAR, inhibiting the receptors’ transcriptional activities through prevention of their respective interaction with nuclear coregulators.30 Our results indicate that CAR activation suppresses Srebp-1 transcription, predicted to diminish lipogenesis, but also enhance fatty acid synthesis (Figure 9). Thus, the mechanistic interplay of multiple pathways likely accounts for CAR’s regulation of fatty acid metabolism.
The effects of CAR activation in vivo appear to involve both acute and chronic metabolic regulation. In liver tissues, acute xenobiotic stress often results in transient, adaptive hepatomegaly and chronic CAR activation appears to significantly minimize this impact, reducing fatty liver histology.8 In our studies, WT mice analyzed either 48 or 72 h following treatment with a single dose of TCPOBOP exhibited fatty acid metabolic patterns consistent with acute morphologic hepatic alterations. In addition, hepatic gene expression assays detected corresponding alterations for key fatty acid metabolism pathways that likely contribute mechanistically to the elevated hepatic FA levels observed in TCPOBOP-treated WT mice. Although physiologically complex, these effects likely underlie the alterations in liver to body weight ratios we noted in our study (Figure 1).
Total Lipid Metabolism
Other investigators previously reported that CAR activation in mice decreased serum cholesterol and triglycerides.31 To assess the basis of these effects, the metabolomics approaches used here enabled analysis of CAR’s role as an integral regulator of total lipid metabolism, especially phospholipid metabolism.32 Analysis of serum lipid profiles in WT mice indicated that levels of phosphatidylcholine and sphingomyelin were significantly reduced following short-term TCPOBOP exposure. The majority of PC is obtained from choline, by catalysis of choline kinase a and b (Chka/b) and choline phosphotransferase 1 (Chpt1), via the CDP-choline pathway.33 Phosphatidylcholine is also produced by reacylation of lyso-PC via fatty acid remodeling, where in a bidirectional reaction, lyso-PC acyltransferases (Lpcats) catalyze reacylation at the sn-2 position of LPC using acyl-CoA, while the phospholipases A2s (Pla2s) release fatty acid from the sn-2 position of PC.34−36 Further, approximately 30 percent of liver PC is synthesized by sequential methylation of PE by the phosphatidylethanolamine N-methyltransferase (Pemt).33,37−39 Our results indicate that the effect of CAR activation on the levels of PC are principally mediated by two PC pathways. One involves decreasing PC synthesis by suppressing Chpt1and Chkb, while the other relates to acceleration of PC degradation through enhanced expression of the Pla2s, such as Pla2g6. CAR activation did not alter the expression of Pemt and Lpcat 3/4, indicating that down-regulated PC was not resulting from the reacylation of lyso-PC and methylation of PE (Figure 8).
Production of SM involves the transfer of phosphocholine from PC to ceramide. There are two Sgms isoforms identified in humans, Sgms1 and Sgms2, that contribute to SM synthesis.40 We focused our investigation on the expression of Sgms2, as it is expressed predominantly in liver. The results demonstrated that hepatic Sgms2 expression was abrogated by short-term CAR activation. Therefore, the reduction of serum SM levels observed here is likely a consequence of decreased SM synthesis and reduced availability of PC in the liver.
Thyroid Hormone Metabolism
It is important to consider the effect of CAR activation on thyroid hormones (TH) since TH is a key regulator of energy disposition, influencing hepatic lipid, cholesterol and carbohydrate metabolism. Reportedly, with CAR activation, 3-5-3′-5′-tetaidothyronine (T4) serum levels decrease, whereas 3-3-5′-triiodothyronine (T3), the more active form that binds to the thyroid hormone receptor (TR), is unaffected.41,42 Type 1 deiodinase (Dio1), a gene encodign a major enzyme responsible for the conversion of T4 into active T3 in the liver, catalyzes the conversion of T3 into T2 for clearance, and is a CAR regulated.23,43 In addition, through regulation of Phase II enzymes, CAR influences TH homeostasis via glucoronosyl transferases (UGT1A1, 2B1) and sulfotransferase (SULT1a1).41,42 In accord with these published results, in our studies WT mice treated with TCPOBOP demonstrated increased mRNA expression of Dio1 at 48 h as well as increased expression of Ugt1a1, at both 48 and 72 h, events likely enhancing the transformation, degradation and clearance of T4 (Figure S1B and S3A). Importantly, the expression of monocarboxylic transporter 8 (Mct8), which preferentially transports thyroid hormones across cell membranes, was significantly decreased with TCPOBOP treatment, specifically in WT mice (Figure S3B). Further, CAR is projected to compete with TR for their mutual heterodimerization partner, RXRα, and nuclear coregulators, to regulate gene expression.44 Taken collectively, activated CAR may inhibit the effect of TH both by reducing its availability and its ability to interact with target genes in the liver.
Conclusion
Through extensive analysis of metabolomics and gene expression data, our investigation substantiates the essential role for CAR in energy metabolism, through CAR’s regulation of pathways mediating the metabolism of glucose, lipids and fatty acids. These broad aspects of CAR’s modulation of the energy metabolome provide insight and therapeutic relevance for liver diseases such as steatohepatitis and diabetes. One issue that arises is the relevance of TCPOBOP, a synthetic CAR ligand, used as a model CAR activator in the current study. Several other modes of CAR activation are of functional consequence. Early reports demonstrated that CAR is a regulator of thyroid metabolism during caloric restriction41 and that CAR regulates serum triglyceride levels under conditions of metabolic stress.29 More recently, the discovery that CAR activation can be modulated through the epidermal growth factor receptor (EGFR) signaling pathway underscores further endogenous modes of CAR regulation.45 This pathway is also of relevance to human xenobiotic exposures. For example, certain polychlorinated biphenyls disrupt EGFR signaling, and these exposures are associated with toxicant-induced steatohepatitis.46,47 It is likely that other classes of toxicants also perturb these signaling pathways and effect CAR function. The underlying molecular mechanisms regulating energy metabolism by CAR involve cross-talk with other nuclear receptors, including PXR, LXR, FXR, PPAR and TH, as well as the interactions with insulin- or glucagon-responsive transcription factors such as HNF4α, C/EBPα, PGC-1, and FOXO1. CAR interplays with these transcription factors, altering the concerted regulation of hepatic genes that encode key enzymes in energy metabolism. Our own ChIP-exo investigations further demonstrate that within mouse liver, activated CAR binds directly to loci of several genes associated with energy metabolism, including Gck, Fbp1 and Ldha.48 Additional investigations are ultimately required to validate these and other CAR targets and to more thoroughly integrate CAR’s role as a key biological regulator of energy metabolism.
Acknowledgments
The authors thank Dr. Wen Xie (University of Pittsburgh School of Pharmacy) for providing the CAR/PXR double knockout mice. The authors also gratefully acknowledge the contributions of the Metabolomics and NMR facility cores at Penn State. This research was supported by grants from the National Institute of General Medical Sciences, GM066411 (CJO), the NIH shared instrumentation program, 1S10OD021750 (ADP) and the United States Department of Agriculture (Project 4607; CJO).
Glossary
Abbreviations
- TCPOBOP/TCP
1,4-Bis-[2-(3,5-dichloropyridyloxy)]benzene,3,3′,5,5′-tetrachloro-1,4-bis(pyridyloxy)benzene
- DMSO
dimethyl sulfoxide
- NMR
nuclear magnetic resonance
- UPLC–MS
ultraperformance liquid chromatography–mass spectrometry
- GC–MS
gas chromatography–mass spectrometry
- PCA
principal component analysis
- OPLS-DA
orthogonal partial least-squares discriminant analysis.
Supporting Information Available
The Supporting Information is available free of charge on the ACS Publications website at DOI: 10.1021/acs.jproteome.8b00566.
Supporting Methods; Figures S1–S3; Table S1; Supporting References (PDF)
Author Contributions
# F.C., D.M.C., and T.C. contributed equally to this work. All authors contributed to the design and execution of the experiments and data analysis. F.C., D.C., T.C., and C.O. contributed to the manuscript preparation.
The authors declare no competing financial interest.
Notes
Additional data are available at the NIH Common Fund’s Metabolomics Data Repository and Coordinating Center (supported by NIH grant, U01-DK097430) Web site, the Metabolomics Workbench, http://www.metabolomicsworkbench.org, where it has been assigned Project ID PR000708. The data can be accessed directly via its Project DOI: 10.21228/M8596T.
Supplementary Material
References
- Omiecinski C. J.; Vanden Heuvel J. P.; Perdew G. H.; Peters J. M. Xenobiotic metabolism, disposition, and regulation by receptors: from biochemical phenomenon to predictors of major toxicities. Toxicol. Sci. 2011, 120 (Suppl 1), S49–75. 10.1093/toxsci/kfq338. [DOI] [PMC free article] [PubMed] [Google Scholar]
- Yang H.; Wang H. Signaling control of the constitutive androstane receptor (CAR). Protein Cell 2014, 5 (2), 113–23. 10.1007/s13238-013-0013-0. [DOI] [PMC free article] [PubMed] [Google Scholar]
- Yan J.; Chen B.; Lu J.; Xie W. Deciphering the roles of the constitutive androstane receptor in energy metabolism. Acta Pharmacol. Sin. 2015, 36 (1), 62–70. 10.1038/aps.2014.102. [DOI] [PMC free article] [PubMed] [Google Scholar]
- Gao J.; Xie W. Pregnane X receptor and constitutive androstane receptor at the crossroads of drug metabolism and energy metabolism. Drug Metab. Dispos. 2010, 38 (12), 2091–5. 10.1124/dmd.110.035568. [DOI] [PMC free article] [PubMed] [Google Scholar]
- Gao J.; Xie W. Targeting xenobiotic receptors PXR and CAR for metabolic diseases. Trends Pharmacol. Sci. 2012, 33 (10), 552–8. 10.1016/j.tips.2012.07.003. [DOI] [PMC free article] [PubMed] [Google Scholar]
- Lahtela J. T.; Arranto A. J.; Sotaniemi E. A. Enzyme inducers improve insulin sensitivity in non-insulin-dependent diabetic subjects. Diabetes 1985, 34 (9), 911–6. 10.2337/diab.34.9.911. [DOI] [PubMed] [Google Scholar]
- Gao J.; He J.; Zhai Y.; Wada T.; Xie W. The constitutive androstane receptor is an anti-obesity nuclear receptor that improves insulin sensitivity. J. Biol. Chem. 2009, 284 (38), 25984–92. 10.1074/jbc.M109.016808. [DOI] [PMC free article] [PubMed] [Google Scholar]
- Dong B.; Saha P. K.; Huang W.; Chen W.; Abu-Elheiga L. A.; Wakil S. J.; Stevens R. D.; Ilkayeva O.; Newgard C. B.; Chan L.; Moore D. D. Activation of nuclear receptor CAR ameliorates diabetes and fatty liver disease. Proc. Natl. Acad. Sci. U. S. A. 2009, 106 (44), 18831–6. 10.1073/pnas.0909731106. [DOI] [PMC free article] [PubMed] [Google Scholar]
- Sberna A. L.; Assem M.; Xiao R.; Ayers S.; Gautier T.; Guiu B.; Deckert V.; Chevriaux A.; Grober J.; Le Guern N.; Pais de Barros J. P.; Moore D. D.; Lagrost L.; Masson D. Constitutive androstane receptor activation decreases plasma apolipoprotein B-containing lipoproteins and atherosclerosis in low-density lipoprotein receptor-deficient mice. Arterioscler., Thromb., Vasc. Biol. 2011, 31 (10), 2232–9. 10.1161/ATVBAHA.110.222497. [DOI] [PMC free article] [PubMed] [Google Scholar]
- Kodama S.; Koike C.; Negishi M.; Yamamoto Y. Nuclear receptors CAR and PXR cross talk with FOXO1 to regulate genes that encode drug-metabolizing and gluconeogenic enzymes. Mol. Cell. Biol. 2004, 24 (18), 7931–40. 10.1128/MCB.24.18.7931-7940.2004. [DOI] [PMC free article] [PubMed] [Google Scholar]
- Miao J.; Fang S.; Bae Y.; Kemper J. K. Functional inhibitory cross-talk between constitutive androstane receptor and hepatic nuclear factor-4 in hepatic lipid/glucose metabolism is mediated by competition for binding to the DR1 motif and to the common coactivators, GRIP-1 and PGC-1alpha. J. Biol. Chem. 2006, 281 (21), 14537–46. 10.1074/jbc.M510713200. [DOI] [PubMed] [Google Scholar]
- Kachaylo E. M.; Yarushkin A. A.; Pustylnyak V. O. Constitutive androstane receptor activation by 2,4,6-triphenyldioxane-1,3 suppresses the expression of the gluconeogenic genes. Eur. J. Pharmacol. 2012, 679 (1–3), 139–43. 10.1016/j.ejphar.2012.01.007. [DOI] [PubMed] [Google Scholar]
- Roth A.; Looser R.; Kaufmann M.; Blattler S. M.; Rencurel F.; Huang W.; Moore D. D.; Meyer U. A. Regulatory cross-talk between drug metabolism and lipid homeostasis: constitutive androstane receptor and pregnane X receptor increase Insig-1 expression. Mol. Pharmacol. 2008, 73 (4), 1282–9. 10.1124/mol.107.041012. [DOI] [PubMed] [Google Scholar]
- Yu T.; Bai Y. Analyzing LC/MS metabolic profiling data in the context of existing metabolic networks. Curr. Metabolomics 2013, 1 (1), 83–91. 10.2174/2213235X130107. [DOI] [PMC free article] [PubMed] [Google Scholar]
- Fiehn O. Metabolomics--the link between genotypes and phenotypes. Plant Mol. Biol. 2002, 48 (1–2), 155–71. 10.1023/A:1013713905833. [DOI] [PubMed] [Google Scholar]
- Saini S. P.; Sonoda J.; Xu L.; Toma D.; Uppal H.; Mu Y.; Ren S.; Moore D. D.; Evans R. M.; Xie W. A novel constitutive androstane receptor-mediated and CYP3A-independent pathway of bile acid detoxification. Mol. Pharmacol. 2004, 65 (2), 292–300. 10.1124/mol.65.2.292. [DOI] [PubMed] [Google Scholar]
- Zhang L.; Hatzakis E.; Nichols R. G.; Hao R.; Correll J.; Smith P. B.; Chiaro C. R.; Perdew G. H.; Patterson A. D. Metabolomics Reveals that Aryl Hydrocarbon Receptor Activation by Environmental Chemicals Induces Systemic Metabolic Dysfunction in Mice. Environ. Sci. Technol. 2015, 49 (13), 8067–77. 10.1021/acs.est.5b01389. [DOI] [PMC free article] [PubMed] [Google Scholar]
- Folch J.; Lees M.; Sloane Stanley G. H. A simple method for the isolation and purification of total lipides from animal tissues. J. Biol. Chem. 1957, 226 (1), 497–509. [PubMed] [Google Scholar]
- Livak K. J.; Wills Q. F.; Tipping A. J.; Datta K.; Mittal R.; Goldson A. J.; Sexton D. W.; Holmes C. C. Methods for qPCR gene expression profiling applied to 1440 lymphoblastoid single cells. Methods 2013, 59 (1), 71–9. 10.1016/j.ymeth.2012.10.004. [DOI] [PMC free article] [PubMed] [Google Scholar]
- Bustin S. A.; Benes V.; Garson J. A.; Hellemans J.; Huggett J.; Kubista M.; Mueller R.; Nolan T.; Pfaffl M. W.; Shipley G. L.; Vandesompele J.; Wittwer C. T. The MIQE guidelines: minimum information for publication of quantitative real-time PCR experiments. Clin. Chem. 2009, 55 (4), 611–22. 10.1373/clinchem.2008.112797. [DOI] [PubMed] [Google Scholar]
- Manenti G.; Dragani T. A.; Della Porta G. Effects of phenobarbital and 1,4-bis[2-(3,5-dichloropyridyloxy)]benzene on differentiated functions in mouse liver. Chem.-Biol. Interact. 1987, 64 (1–2), 83–92. 10.1016/0009-2797(87)90062-7. [DOI] [PubMed] [Google Scholar]
- Denko N. C. Hypoxia, HIF1 and glucose metabolism in the solid tumour. Nat. Rev. Cancer 2008, 8 (9), 705–13. 10.1038/nrc2468. [DOI] [PubMed] [Google Scholar]
- Konno Y.; Negishi M.; Kodama S. The roles of nuclear receptors CAR and PXR in hepatic energy metabolism. Drug Metab. Pharmacokinet. 2008, 23 (1), 8–13. 10.2133/dmpk.23.8. [DOI] [PubMed] [Google Scholar]
- Wada T.; Gao J.; Xie W. PXR and CAR in energy metabolism. Trends Endocrinol. Metab. 2009, 20 (6), 273–9. 10.1016/j.tem.2009.03.003. [DOI] [PubMed] [Google Scholar]
- Gao J.; Yan J.; Xu M.; Ren S.; Xie W. CAR Suppresses Hepatic Gluconeogenesis by Facilitating the Ubiquitination and Degradation of PGC1alpha. Mol. Endocrinol. 2015, 29 (11), 1558–70. 10.1210/me.2015-1145. [DOI] [PMC free article] [PubMed] [Google Scholar]
- Perl A.; Hanczko R.; Telarico T.; Oaks Z.; Landas S. Oxidative stress, inflammation and carcinogenesis are controlled through the pentose phosphate pathway by transaldolase. Trends Mol. Med. 2011, 17 (7), 395–403. 10.1016/j.molmed.2011.01.014. [DOI] [PMC free article] [PubMed] [Google Scholar]
- Rezen T.; Tamasi V.; Lovgren-Sandblom A.; Bjorkhem I.; Meyer U. A.; Rozman D. Effect of CAR activation on selected metabolic pathways in normal and hyperlipidemic mouse livers. BMC Genomics 2009, 10, 384. 10.1186/1471-2164-10-384. [DOI] [PMC free article] [PubMed] [Google Scholar]
- Gray L. R.; Tompkins S. C.; Taylor E. B. Regulation of pyruvate metabolism and human disease. Cell. Mol. Life Sci. 2014, 71 (14), 2577–604. 10.1007/s00018-013-1539-2. [DOI] [PMC free article] [PubMed] [Google Scholar]
- Maglich J. M.; Lobe D. C.; Moore J. T. The nuclear receptor CAR (NR1I3) regulates serum triglyceride levels under conditions of metabolic stress. J. Lipid Res. 2009, 50 (3), 439–45. 10.1194/jlr.M800226-JLR200. [DOI] [PubMed] [Google Scholar]
- Roth A.; Looser R.; Kaufmann M.; Meyer U. A. Sterol regulatory element binding protein 1 interacts with pregnane X receptor and constitutive androstane receptor and represses their target genes. Pharmacogenet. Genomics 2008, 18 (4), 325–37. 10.1097/FPC.0b013e3282f706e0. [DOI] [PubMed] [Google Scholar]
- Sberna A. L.; Assem M.; Gautier T.; Grober J.; Guiu B.; Jeannin A.; Pais de Barros J. P.; Athias A.; Lagrost L.; Masson D. Constitutive androstane receptor activation stimulates faecal bile acid excretion and reverse cholesterol transport in mice. J. Hepatol. 2011, 55 (1), 154–61. 10.1016/j.jhep.2010.10.029. [DOI] [PubMed] [Google Scholar]
- Cave M. C.; Clair H. B.; Hardesty J. E.; Falkner K. C.; Feng W.; Clark B. J.; Sidey J.; Shi H.; Aqel B. A.; McClain C. J.; Prough R. A. Nuclear receptors and nonalcoholic fatty liver disease. Biochim. Biophys. Acta, Gene Regul. Mech. 2016, 1859 (9), 1083–99. 10.1016/j.bbagrm.2016.03.002. [DOI] [PMC free article] [PubMed] [Google Scholar]
- Li Z.; Vance D. E. Phosphatidylcholine and choline homeostasis. J. Lipid Res. 2008, 49 (6), 1187–94. 10.1194/jlr.R700019-JLR200. [DOI] [PubMed] [Google Scholar]
- Li Z.; Agellon L. B.; Vance D. E. Phosphatidylcholine homeostasis and liver failure. J. Biol. Chem. 2005, 280 (45), 37798–802. 10.1074/jbc.M508575200. [DOI] [PubMed] [Google Scholar]
- Lands W. E. Metabolism of glycerolipides; a comparison of lecithin and triglyceride synthesis. J. Biol. Chem. 1958, 231 (2), 883–8. [PubMed] [Google Scholar]
- Moessinger C.; Klizaite K.; Steinhagen A.; Philippou-Massier J.; Shevchenko A.; Hoch M.; Ejsing C. S.; Thiele C. Two different pathways of phosphatidylcholine synthesis, the Kennedy Pathway and the Lands Cycle, differentially regulate cellular triacylglycerol storage. BMC Cell Biol. 2014, 15, 43. 10.1186/s12860-014-0043-3. [DOI] [PMC free article] [PubMed] [Google Scholar]
- DeLong C. J.; Shen Y. J.; Thomas M. J.; Cui Z. Molecular distinction of phosphatidylcholine synthesis between the CDP-choline pathway and phosphatidylethanolamine methylation pathway. J. Biol. Chem. 1999, 274 (42), 29683–8. 10.1074/jbc.274.42.29683. [DOI] [PubMed] [Google Scholar]
- Sundler R.; Akesson B. Regulation of phospholipid biosynthesis in isolated rat hepatocytes. Effect of different substrates. J. Biol. Chem. 1975, 250 (9), 3359–67. [PubMed] [Google Scholar]
- Reo N. V.; Adinehzadeh M.; Foy B. D. Kinetic analyses of liver phosphatidylcholine and phosphatidylethanolamine biosynthesis using (13)C NMR spectroscopy. Biochim. Biophys. Acta, Mol. Cell Biol. Lipids 2002, 1580 (2–3), 171–88. 10.1016/S1388-1981(01)00202-5. [DOI] [PubMed] [Google Scholar]
- Tafesse F. G.; Huitema K.; Hermansson M.; van der Poel S.; van den Dikkenberg J.; Uphoff A.; Somerharju P.; Holthuis J. C. Both sphingomyelin synthases SMS1 and SMS2 are required for sphingomyelin homeostasis and growth in human HeLa cells. J. Biol. Chem. 2007, 282 (24), 17537–47. 10.1074/jbc.M702423200. [DOI] [PubMed] [Google Scholar]
- Maglich J. M.; Watson J.; McMillen P. J.; Goodwin B.; Willson T. M.; Moore J. T. The nuclear receptor CAR is a regulator of thyroid hormone metabolism during caloric restriction. J. Biol. Chem. 2004, 279 (19), 19832–8. 10.1074/jbc.M313601200. [DOI] [PubMed] [Google Scholar]
- Qatanani M.; Zhang J.; Moore D. D. Role of the constitutive androstane receptor in xenobiotic-induced thyroid hormone metabolism. Endocrinology 2005, 146 (3), 995–1002. 10.1210/en.2004-1350. [DOI] [PubMed] [Google Scholar]
- Tien E. S.; Matsui K.; Moore R.; Negishi M. The nuclear receptor constitutively active/androstane receptor regulates type 1 deiodinase and thyroid hormone activity in the regenerating mouse liver. J. Pharmacol. Exp. Ther. 2007, 320 (1), 307–13. 10.1124/jpet.106.112706. [DOI] [PubMed] [Google Scholar]
- Sinha R. A.; Singh B. K.; Yen P. M. Thyroid hormone regulation of hepatic lipid and carbohydrate metabolism. Trends Endocrinol. Metab. 2014, 25 (10), 538–45. 10.1016/j.tem.2014.07.001. [DOI] [PubMed] [Google Scholar]
- Mutoh S.; Sobhany M.; Moore R.; Perera L.; Pedersen L.; Sueyoshi T.; Negishi M. Phenobarbital indirectly activates the constitutive active androstane receptor (CAR) by inhibition of epidermal growth factor receptor signaling. Sci. Signaling 2013, 6 (274), ra31. 10.1126/scisignal.2003705. [DOI] [PMC free article] [PubMed] [Google Scholar]
- Hardesty J. E.; Wahlang B.; Falkner K. C.; Clair H. B.; Clark B. J.; Ceresa B. P.; Prough R. A.; Cave M. C. Polychlorinated biphenyls disrupt hepatic epidermal growth factor receptor signaling. Xenobiotica 2017, 47 (9), 807–820. 10.1080/00498254.2016.1217572. [DOI] [PMC free article] [PubMed] [Google Scholar]
- Clair H. B.; Pinkston C. M.; Rai S. N.; Pavuk M.; Dutton N. D.; Brock G. N.; Prough R. A.; Falkner K. C.; McClain C. J.; Cave M. C. Liver Disease in a Residential Cohort With Elevated Polychlorinated Biphenyl Exposures. Toxicol. Sci. 2018, 164 (1), 39–49. 10.1093/toxsci/kfy076. [DOI] [PMC free article] [PubMed] [Google Scholar]
- Niu B.; Coslo D. M.; Bataille A. R.; Albert I.; Pugh B. F.; Omiecinski C. J. In vivo genome-wide binding interactions of mouse and human constitutive androstane receptors reveal novel gene targets. Nucleic Acids Res. 2018, 46 (16), 8385–8403. 10.1093/nar/gky692. [DOI] [PMC free article] [PubMed] [Google Scholar]
Associated Data
This section collects any data citations, data availability statements, or supplementary materials included in this article.


