Abstract
Wave-based optical coherence elastography (OCE) is a rapidly emerging technique for elasticity assessment of tissues having high displacement sensitivity and simple implementation. However, most current noncontact wave excitation techniques are unable to target a specific tissue site in 3D and rely on transversal scanning of the imaging beam. Here, we demonstrate that dye-loaded perfluorocarbon nanoparticles (“nanobombs”) excited by a pulsed laser can produce localized axially propagating longitudinal shear waves while adhering to the laser safety limit. A phase correction method was developed and implemented to perform sensitive nanobomb elastography using ~1.5 MHz Fourier domain mode locking laser. The nanobomb activation was also monitored by detecting photoacoustic signals. The highly localized elastic waves detected by the nanobomb OCE (nb-OCE) suggest possibility of high-resolution 3D elastographic imaging.
OCIS codes: (110.4500) Optical coherence tomography, (170.0110) imaging system, (150.1135) Algorithms
Changes in tissue viscoelasticity are often associated with development of different pathologies, and can, therefore, be a useful biomarker for monitoring disease onset and progression [1]. Wave-based optical coherence elastography (OCE) is an emerging powerful technique capable of nanometer-scale displacement sensitivity, which has enabled biomechanical assessments of tissues with minimal excitation forces [2], such as pneumatic, Lorentz, and acoustic radiation forces. However, these techniques usually cannot target localized tissue regions and are mainly focused on imaging transversely propagating elastic waves, which generally requires scanning the probe beam across the sample. On the other hand, functionalized magnetic nanoparticles (MNPs) have been proposed for targeted evaluation of tissue mechanical properties [3], the low frequency waves of which are sensitive to boundary conditions. To raise the frequency content of the induced elastic waves, optical excitation a pulsed laser was proposed to generate frequency content up to 12 kHz in murine skin [4]. To achieve both the spatial localization and the high frequency content of elastic waves, we recently used phase-changing perfluorocarbon (PFC) nanodroplets loaded with a visible dye - “nanobombs” - to generate transverse elastic waves under excitation with a Nd-YAG pulsed laser [5]. However, due to the limited temporal resolution [6], the longitudinal shear waves (LSWs), which propagated axially (i.e., along the optical axis of laser excitation), were not detected even though the nanobombs generated spherical forces that induces shear waves in all directions. The generation of longitudinal shear waves can allow elasticity quantification along depth without the need for transversal scanning, thus enabling simplified optical setups and probes. It has been shown that the wave amplitude of LSWs modulates along the force direction and propagates with much slower speed than compressional waves [7–10]. In addition, Yoon et al., performed photoacoustic imaging of a phantom inclusion labeled with optically-activated PFC nanodroplets [11], but the shear waves generated by the vaporization process of dye-loaded nanodroplets were not investigated. Here, we present a minimally invasive method for LSW-OCE using light excitation of nanobombs (nb-OCE). Proof-of-principle was presented by exciting nanobombs with a 1064 nm pulsed laser to induce LSWs in polyacrylamide (PAA) phantoms of different stiffness. A Fourier domain mode locked (FDML) laser with 4X buffer stages (OptoRes Gmbh, Munich, Germany), operating at ~1.5 MHz sweeping rate [12], was used to capture nanobomb-induced LSWs (nb-LSWs). The 4X buffering creates 4 A-line copies in each laser sweep, but the phase offsets across different buffered copies (i.e., OCT A-lines) can significantly degrade phase stability. Previously, Singh et al. [13] and Song et al. [14] demonstrated B-M mode imaging (repetitive B-mode frames at the same scanning line) that utilized the phase from the same buffer copies to preserve phase stability. Here, we utilized a calibration mirror to minimize the phase noise across buffered A-lines and address the phase jittering at the frame connection. Previous work reduced swept source (SS-OCT) phase jitter caused by imperfect synchronization between the A-line trigger and acquisition with a calibration mirror [15]. However, this technique has not been applied in a buffered FDML-based SS-OCT system. In addition, pulsed laser induced activation of nanobombs, and control agents used in this study were monitored by an ultrasound transducer. The photoacoustic signals produced by the laser-excited nanobombs were simultaneously acquired with the OCE measurements. To validate the LSW-nbOCE, air-pulse OCE [16] and the “gold standard” of uniaxial compressional testing were performed immediately after the nanobomb OCE measurements on 10% and 11% PAA phantoms which have different stiffness.
The nanobombs were prepared as described before [5] with two notable changes: (a) Epolight 3072 dye with absorption maximum at 1054 nm (Epolin) [17] was used in this study to allow excitation using a NIR laser, and (b) a different sonication process that resulted in smaller and more uniform nanobombs. Briefly, 1mg of the Epolight 3072 dye in 0.2 mL chloroform was mixed with the same lipid mixture as previously described before making a lipid cake [5]. After dehydration of the dye-containing lipid cake in deionized water, 125 μL of dodecafluoropentane (FluoroMed) was added and the suspension was sonicated for 20 seconds in benchtop ultrasonic bath (Fisher Scientific) followed by two 1 minute cycles of sonication separated by 20 seconds of vortexing; the sonication was carried out using VCX 500 ultrasound probe (Cole Palmer) at 25% maximum amplitude with a 2 mm tip. The suspension was washed twice with water at 3100 G for 15 minutes. The final pellet with nanobombs was re-suspended in 1 mL of deionized water. Blank PFC nanodroplets (containing no dye) were synthesized using the same protocol except no dye was added to the mixture. Finally, the dye alone was solubilized using the mixture of lipids described above to prepare control phantom with the dye only. Dye concentration in phantoms was adjusted using absorbance measurements. The size of nanobombs was measured by dynamic light scattering (Delsa Nano C, Beckman Coulter) and showed similar distributions for blank and dye-containing nanodroplets with average diameters 319 ± 84 nm and 284 ± 135 nm, respectively.
Two types of bi-layered phantoms (35 mm in diameter) of lower (10% PAA) and higher (11% PAA) stiffness (N=3 samples for each) were made by adapting a previously described recipe [17]. The bottom layer was made by mixing either 2 mL or 2.2 mL of 40% acrylamide solution (Ambion Inc.) to achieve 10% and 11% PAA, respectively, 0.12 mL of 438 mM solution of ammonium persulfate, 0.28 mL of Intralipid, 16 μL of tetramethyl ethylenediamine (TEMED, all from Sigma-Aldrich), and deionized water up to the 8 mL final volume. The mixture solidified after addition of the TEMED, resulting in a 10 mm bottom layer which did not have any embedded agents. The top 1.5 mm layer was cast over the solidified bottom layer. The bottom layer was made to minimize reflected waves from the boundary. The top layer contained the same mixture of reagents with an addition of either homogenously distributed nanobombs or control agents (e.g., PFC core nanodroplets without dye or the solubilized dye alone) that were added before solidification. To validate the Young’s modulus determined using nanobomb induced LSWs, the transversal elastic waves in the phantoms were measured by using an air-pulse based phase stabilized swept-source OCT system as reported in [18], and an uniaxial compressional testing instrument (Model 5943, Instron Corp.). The optical densities of dye-only, and nanobomb samples were measured as 2.8 ± 0.34 dB/mm, and 1.8 ± 0.34 dB/mm at 1064 nm (n=5 positions), respectively.
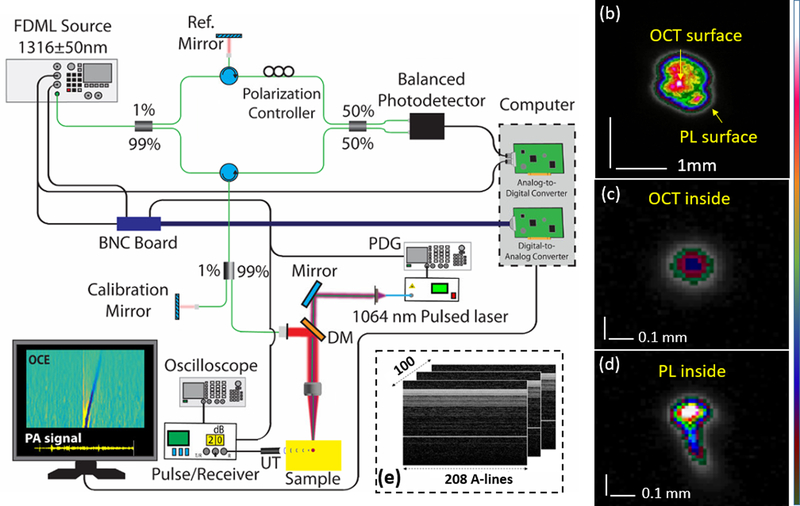
The ultra-fast OCT system has been previously described [13]. As shown in Fig. 1(a), the 4X buffered FDML swept source laser was co-aligned with a 1064 nm Nd:YAG pulsed laser, pulse duration of 6 ns (Polaris II, New Wave Research, Inc.), and a 3.5 MHz ultrasound transducer with a pulse receiver. The OCT system had an A-scan rate of ~1.5 MHz, scan wavelength of 1316 nm ± 50 nm, output power up to 160 mW, axial resolution of ~16 um, and sensitivity of 104 dB. The 1064 nm pulsed laser beam was co-aligned with the OCT beam using a dichroic mirror (DMSP 1200, Thorlabs, Inc.). The utilized average fluence of the laser pulse (n=5, each fluence) were 74 ± 3 mJ/cm2 and 42 ± 5 mJ/cm2 with the averaged pulsed laser energy of 0.81 mJ and 0.46 mJ, respectively. The corresponding beam widths at the sample’s surface were 1.17 ± 0.03 mm and 1.24 ± 0.07 mm that was quantified using 16/84 knife-edge width detection because the energy distribution of the pulsed laser was not Gaussian, as shown in Fig. 1(b). The focal point of the pulsed laser was shifted by ~1.5 mm into the sample (Fig. 1, c and d) due to the use of the same objective lens for OCT and the excitation laser; the lens is designed for 1315 nm. This focal shift also resulted in a relatively large laser beam size at the surface. The optical fluence of 74 mJ/cm2 was selected to perform nanobomb OCE for the phantom study. The B-scan trigger of the OCT system was synchronized with a single pulse of the pulsed laser and ultrasonic pulse-receiver device. So, each detected LSW was excited by a single laser pulse. The induced LSWs and photoacoustic (PA) signals were simultaneously detected by the MHz OCT system and the ultrasound transducer respectively. Continuous M-mode frames were acquired in groups of 100 to monitor displacements over ~13.3 ms. There were 208 A-lines per frame, as illustrated in Fig. 1(e), where the sample surface and a calibration mirror were fixed at an optical path difference (OPD) of 0.5 mm (top) and 2 mm (bottom), respectively.
Fig 1.
(a) The schematic of nanobomb OCE system incorporating photoacoustic signal detection setup. DM – dichroic mirror; PA – photoacoustic signal; PDG – pulse delay generator; UT – ultrasound transducer. Example beam profiles measured at the (b) OCT (sample surface) and (c-d) pulsed laser focal planes (1.5 mm beneath the surface), respectively. (e) Raw data. PL: pulsed laser.
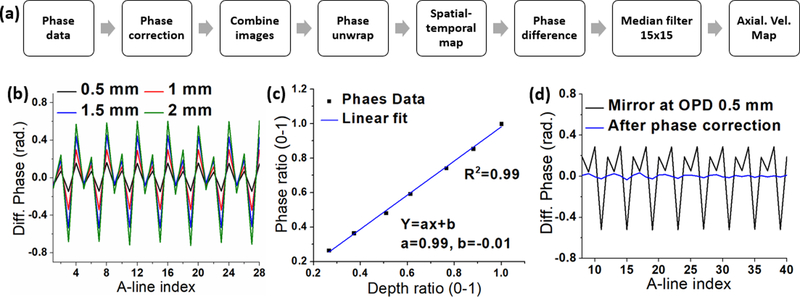
A data processing flow chart is shown in Fig. 2(a). Phase jitter, as shown in Fig. 2(b), was measured from a sample mirror at different OPDs. The results reveal a linear dependence of the phase jitter along depth, as plotted in Fig. 2(c). The phase ratio was defined as the ratio of the phase amplitude of sample mirror to the calibration mirror. The depth ratio was defined as the ratio of the depth position of the silver mirror to the calibration mirror. The depth ratio and phase ratio had a linear relationship (R2 = 0.99). Due to linear dependence of the phase jitter as a function of depth, the jitter can be corrected by using a calibration mirror [15]. The corrected phase is presented in Fig. 2(d). The improvement in phase stability, as quantified by one standard deviation, is plotted in Fig. 3(a). The phase stability of the silver mirror at an OPD of 0.5 mm improved from 16 mm/s to 5 mm/s (SNR of 42.4 dB), and from 65 mm/s to 2.5 mm/s at an OPD of 1.75 mm (SNR of 34.2dB). The nanobomb-induced LSW is barely visible because of the phase noise and phase jittering between buffers (compare Fig. 3 b and c). LSWs induced by laser excitation of nanobombs can be clearly seen after phase correction, demonstrating significant improvement in detecting the LSWs using the proposed phase correction strategy.
Fig 2.
(a) Data processing flow chart. (b) Phase jitter across buffered copies. (c) The linear dependence of the phase data vs. depth, and (d) the raw and corrected phases.
Fig 3.
(a) Improved phase stability as a function of OPD (single path). An example of the axial velocity map after laser excitation of nanobombs in 10% PAA phantom at 74 mJ/cm2 (b) before and after (c) the phase correction, where the red and black arrows indicate the LSWs and stripe artifacts, respectively.
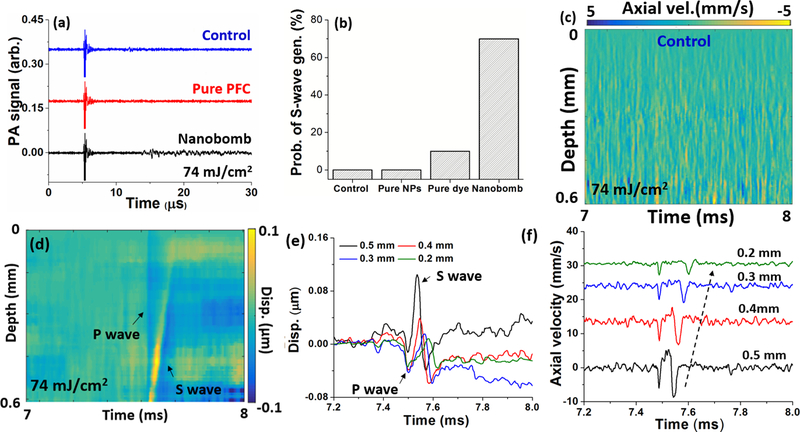
The PA signals induced by the pulsed laser as shown in Fig. 4(a) were acquired simultaneously with OCE measurements, where the phantoms with nanobombs show much stronger PA signals than the PAA alone and PAA phantoms with PFC cores without dye. This is expected since the control PAA phantoms and phantoms with pure PFC nanodroplets lack the absorptive dye. At the same pulsed laser fluence, nbOCE measurements were taken at 40 positions with 0.1 mm spacing between successive measurements for each phantom type. In Fig. 4(b), the success rate of exciting the LSWs in PAA alone, pure PFC nanodroplets, pure dye, and nanobomb phantoms were calculated separately (N=40 measurements for each type of phantom). The nanobomb phantom exhibited a 70% success rate of inducing LSWs after a single laser pulse excitation while the PAA, pure PFC nanodroplets, and pure dye phantoms had 0%, 0%, and 7% success rates, respectively. Example spatiotemporal maps of 10% PAA control and the one with nanobomb are presented in Fig. 4(c–d) demonstrating that the phase-transition of nanobombs is required for reliable induction of LSWs. The LSW is visible in Fig. 4(d) as a tilted strip in the displacement map, consisting of a rapid generation of a P-wave at 7.5 ms, followed by a slow shear wave generation (S-wave). The downward propagation was not detected due to the deterioration of phase stability with depth. The thermal expansion displacement is not evident due to much lower utilized pulsed laser fluence as compared with previous works [19–21]. Furthermore, the results indicate that the mechanical excitation force induced by the rapid liquid-to-gas phase transition of nanobomb contribute to the LSW generation at the lower fluence. To simplify the wave speed calculations, the low frequency noise was removed by calculating phase difference (i.e. axial velocity), such as in Fig. 4(f).
Fig 4.
The PA signals of (a) the PAA phantom alone (control), 10% PAA phantom with pure PFC nanodroplets (no dye), and 10% PAA phantom with nanobombs. (b) The success rate of LSWs excitation as measured by OCE. Spatiotemporal maps of (c) PAA controls and (d) nanobomb phantoms with the corresponding (e) displacement and (f) axial velocity profiles.
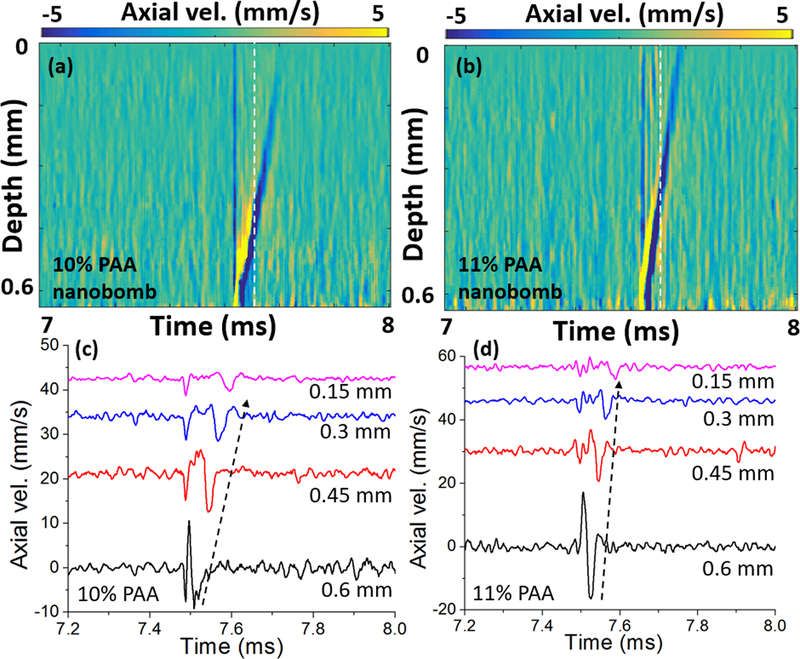
The spatiotemporal maps of nanobomb-induced LSWs (nb-LSW) in 10% (softer) and 11% (stiffer) PAA phantoms using 74 mJ/cm2 pulsed laser fluence are plotted in Fig. 5(a–b). The depth of the nanobombs bursting depends on the laser fluence inside the phantom (maximized at the focal plane). The axial velocity profiles of the two phantoms are plotted in Fig. 5(c–d), showing that nanobomb-induced LSWs have different S-wave speed in the phantoms corresponding to differences in their stiffness. In Fig. 6(a), spatial profiles retrieved from the dash-white line in Fig. 5(a–b) show FWHM wavelengths of 0.1 mm for both phantoms, indicating promising potential for a high-resolution elastographic imaging.
Fig 5.
Spatiotemporal maps of nb-LSWs excited by pulsed laser fluence of 74 mJ/cm2 in (a) 10% PAA and (b) 11% PAA phantoms with nanobombs, where the white dash-lines represent the measured spatial profiles in Fig. 6(a). The corresponding axial velocity profiles are shown in (c-d). The wave propagation is indicated by dashed black arrows.
Fig 6.
(a) Spatial profiles of LSWs indicated by the white dashed lines in Figs. 5(a–b). (b) Young’s modulus of 10% and 11% PAA phantoms measured by nanobomb, air-pulse, and mechanical compressional testing, where the error bars represent the inter-sample standard deviation (n = 3). (c) An example spatiotemporal map of nb-OCE excited by the pulsed laser fluence at 42 mJ/cm2.
The elastic moduli of the phantoms were calculated using the shear wave equation [22] for nb-OCE and the surface wave equation for air-pulse OCE [23] (Poisson ratio: 0.49 and material density: 1000 kg/m3). As shown in Fig. 6(b), the resulting Young’s moduli measured for 10% and 11% PAA phantoms (n=3, for each type) were 63.4 ± 2.9 kPa and 84.6 ± 6.4 kPa, respectively, as measured by LSW-nbOCE and 43.9 ± 8.1 kPa and 62.0 ± 6.7 kPa, respectively as measured by air-pulse OCE [16]. The Young’s moduli of 10% and 11% PAA phantoms measured by mechanical testing were 55.7 ± 14.6 for and 84.3 ± 11.2, respectively. More accurate Young’s moduli estimated by nb-OCE in comparison to the air-pulse method may be due to a higher frequency content of elastic waves generated by “nanobombs” as was previously shown by us [5].
It is important to note that in vivo nb-OCE would require laser fluences that are below the maximum permissible exposure (MPE). In the phantoms, a pulsed laser fluence of 74 mJ/cm2 was selected, which is lower than 100 mJ/cm2 MPE for skin, based on ANSI Z136.1–2007 [24]. The pulsed laser fluence at the in-focus location was calculated as 25.1 mJ/cm2 after accounting for optical attenuation. In addition, LSWs in a 10% PAA nanobomb phantom induced by 42 mJ/cm2 were successfully detected as shown in Fig. 6(c), demonstrating that nb-OCE requires safe laser energy for optical excitation. Previous work utilized similar pulse laser fluence for nanoparticle activation in PA imaging [11]. Even lower excitation energy could be feasible by increasing dye loading or by using a mixture of lower temperature boiling PFCs to reduce the energy required to initiate the liquid-gas phase transition of nanobombs.
In summary, our results demonstrate a new methodology for OCE where dye-loaded phase-changing PFC nanodroplets (nanobombs) produce highly localized LSWs with 1064 nm NIR excitation below the MPE for skin. The LSWs were detected by an ultra-fast OCT system, completing the all-optical elastography system. The phase noise of the buffered FDML laser was minimized to 2.5 mm/s while preserving the A-line rate at 1.5 MHz to capture nanobomb-induced LSWs. The Young’s moduli obtained from nb-OCE were in a good agreement with air-pulse OCE and the “gold standard” of uniaxial mechanical testing. This study is a critical first step towards new approaches for high-resolution 3D elastographic tissue characterization. We envision that nanobombs can be introduced systemically through intravenous injection and subsequent tissue extravasation, e.g. in tumor, similar to other nanoparticles [25, 26]. Therefore, functionalization of the nanobombs with targeting moieties can open new opportunities for elastography measurements in specific tissue locations that can be performed in combination with PA imaging.
Funding.
National Institute of Health grants 2R01EY022362, 1R01HL130804, and 1R21CA231561.
References
- 1.Parker KJ, Doyley MM, and Rubens DJ, Phys Med Biol 56, R1 (2011). [DOI] [PubMed] [Google Scholar]
- 2.Larin KV, and Sampson DD, Biomed Opt Express 8, 1172 (2017). [DOI] [PMC free article] [PubMed] [Google Scholar]
- 3.Huang PC, Pande P, Ahmad A, Marjanovic M, Spillman DR Jr., Odintsov B, and Boppart SA, IEEE J Sel Top Quantum Electron 22, 104 (2016). [DOI] [PMC free article] [PubMed] [Google Scholar]
- 4.Li C, Guan G, Zhang F, Nabi G, Wang RK, and Huang Z, Biomed Opt Express 5, 1403 (2014). [DOI] [PMC free article] [PubMed] [Google Scholar]
- 5.Liu CH, Nevozhay D, Schill A, Singh M, Das S, Nair A, Han Z, Aglyamov S, Larin KV, and Sokolov KV, Opt Lett 43, 2006 (2018). [DOI] [PMC free article] [PubMed] [Google Scholar]
- 6.Liu CH, Schill A, Raghunathan R, Wu C, Singh M, Han Z, Nair A, and Larin KV, Biomed Opt Express 8, 993 (2017). [DOI] [PMC free article] [PubMed] [Google Scholar]
- 7.Zhu J, Miao Y, Qi L, Qu Y, He Y, Yang Q, and Chen Z, Appl. Phys. Lett 110, 201101 (2017). [DOI] [PMC free article] [PubMed] [Google Scholar]
- 8.Catheline S, and Benech N, The Journal of the Acoustical Society of America 137, EL200–EL205 (2015). [DOI] [PubMed] [Google Scholar]
- 9.Zhu J, Yu J, Qu Y, He Y, Li Y, Yang Q, Huo T, He X, and Chen Z, Opt Lett 43, 2388 (2018). [DOI] [PubMed] [Google Scholar]
- 10.Baghani A, Eskandari H, Salcudean S, and Rohling R, IEEE transactions on ultrasonics, ferroelectrics, and frequency control 56, 1405–1418 (2009). [DOI] [PubMed] [Google Scholar]
- 11.Yoon H, Zhu YI, Yarmoska SK, and Emelianov SY, IEEE Trans Med Imaging (2018). [DOI] [PMC free article] [PubMed] [Google Scholar]
- 12.Wieser W, Biedermann BR, Klein T, Eigenwillig CM, and Huber R, Opt Express 18, 14685–14704 (2010). [DOI] [PubMed] [Google Scholar]
- 13.Singh M, Wu C, Liu CH, Li J, Schill A, Nair A, and Larin KV, Opt Lett 40, 2588 (2015). [DOI] [PMC free article] [PubMed] [Google Scholar]
- 14.Song S, Wei W, Hsieh BY, Pelivanov I, Shen TT, O’Donnell M, and Wang RK, Appl Phys Lett 108, 191104 (2016). [DOI] [PMC free article] [PubMed] [Google Scholar]
- 15.Vakoc BJ, Yun SH, Boer J. F. d., Tearney GJ, and Bouma BE, Opt. Express 13, 5483–5493 (2005). [DOI] [PMC free article] [PubMed] [Google Scholar]
- 16.Wang S, Larin KV, Li J, Vantipalli S, Manapuram RK, Aglyamov S, Emelianov S, and Twa MD, Laser Phys Lett 10 (2013). [DOI] [PMC free article] [PubMed] [Google Scholar]
- 17.Hannah AS, Luke GP, and Emelianov SY, Theranostics 6, 1866–1876 (2016). [DOI] [PMC free article] [PubMed] [Google Scholar]
- 18.Singh M, Li J, Vantipalli S, Wang S, Han Z, Nair A, Aglyamov SR, Twa MD, and Larin KV, IEEE J Sel Top Quantum Electron 22, 1 (2016). [DOI] [PMC free article] [PubMed] [Google Scholar]
- 19.Wang T, Pfeiffer T, Wu M, Wieser W, Amenta G, Draxinger W, van der Steen AFW, Huber R, and Soest GV, Opt Lett 42, 3466 (2017). [DOI] [PubMed] [Google Scholar]
- 20.Payne BP, Venugopalan V, Mikic BB, and Nishioka NS, J Biomed Opt. 8, 264 (2003). [DOI] [PubMed] [Google Scholar]
- 21.Payne BP, Venugopalan V, Mikic BB, and Nishioka NS, J Biomed Opt. 8, 273 (2003). [DOI] [PubMed] [Google Scholar]
- 22.Han Z, Li J, Singh M, Wu C, Liu CH, Wang S, Idugboe R, Raghunathan R, Sudheendran N, Aglyamov SR, Twa MD, and Larin KV, Phys. Med. Biol 60, 3531–3547 (2015). [DOI] [PMC free article] [PubMed] [Google Scholar]
- 23.Graff KF, Wave motion in elastic solids (Courier Corporation, 2012). [Google Scholar]
- 24.A. N. S. I. Standard, American National Standard for the Safe Use of Lasers (2007). [Google Scholar]
- 25.John R, Rezaeipoor R, Adie SG, Chaney EJ, Oldenburg AL, Marjanovic M, Haldar JP, Sutton BP, and Boppart SA, Proc Natl Acad Sci U S A 107, 8085–8090 (2010). [DOI] [PMC free article] [PubMed] [Google Scholar]
- 26.Rapoport NY, Kennedy AM, Shea JE, Scaife CL, and Nam KH, Journal of controlled release: official journal of the Controlled Release Society 138, 268–276 (2009). [DOI] [PMC free article] [PubMed] [Google Scholar]


