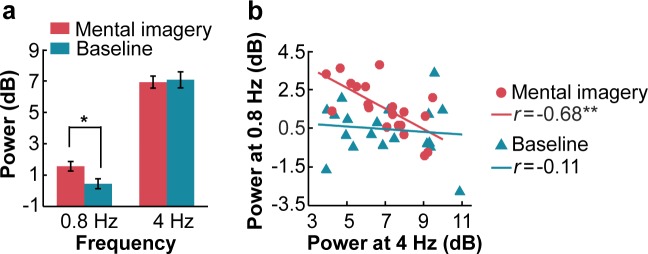
Figure 2. Power of spectral peaks at the imagery-rate frequency and stimulus-rate frequency.
(a) Mental imagery increased the peak power at the imagery-rate frequency of 0.8 Hz. No significant difference in peak power at 4 Hz was observed between the conditions. (b) A significant negative correlation was observed between the grand averaged power at 4 Hz and 0.8 Hz under the mental imagery condition but not under the baseline condition. **p<0.01, *p<0.05.

