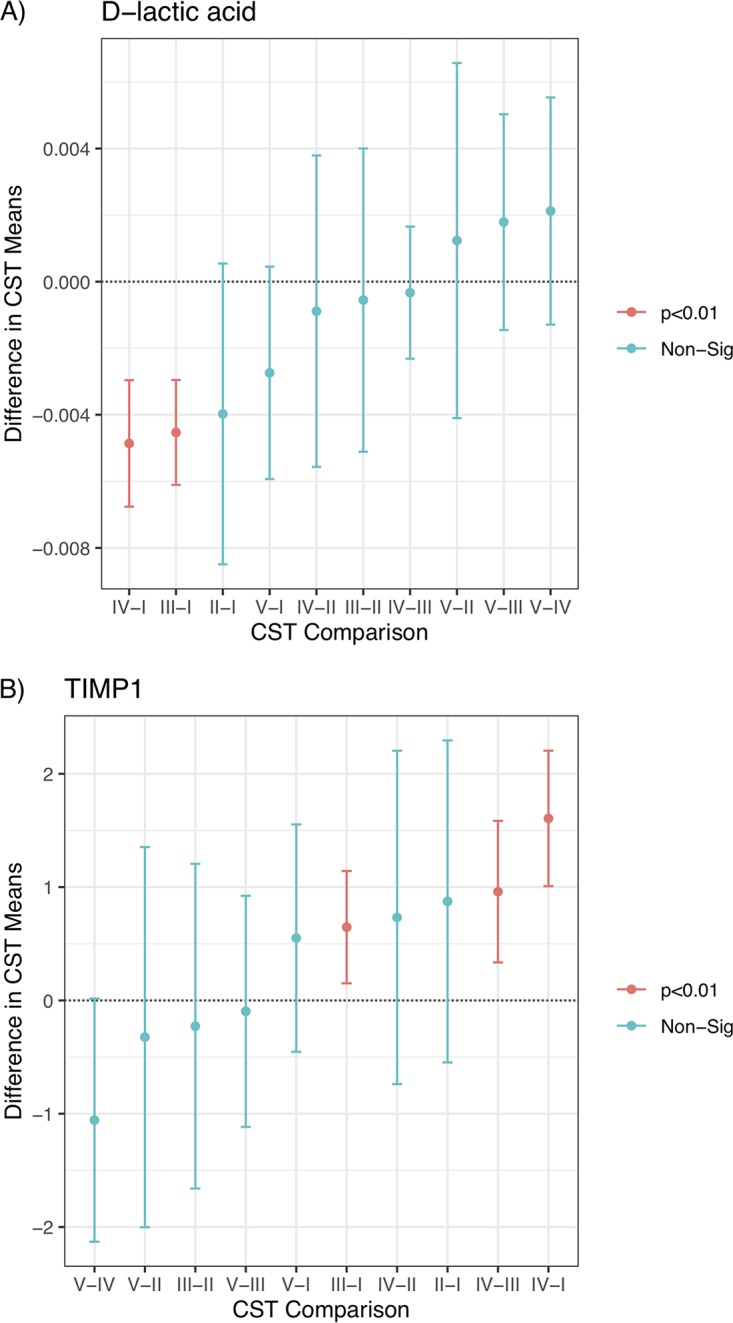
FIG 3.

Plot of the pairwise differences in CST means for d-lactic acid (A) and TIMP-1 (B). The x axis indicates which CSTs were compared, and the arithmetic relationships were plotted. The central point is the estimate, and the bars indicate the 95% confidence interval of the difference; significance is given by the color of the bar and calculated using a Tukey test. Non-Sig, nonsignificant.
