

In the original article, there was a mistake in Figure 3 as published. Despite careful examination of the text and references in the proof, we unfortunately failed to notice that the incorrect Figure 3 was used. The correct Figure 3 appears below.
Figure 3.
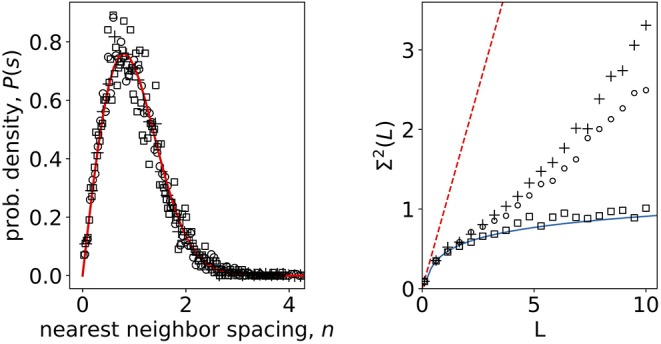
(Left) Nearest-neighbor spacing distribution of empirical correlation matrix eigenvalues of calcium signals in non-stimulatory and stimulatory regime. Open squares: shuffled, randomized data; open dots: 8 mM glucose; crosses 6 mM glucose; full line Wigner surmise (Equation 5). (Right) Number variance of eigenvalue spectra of calcium signals. Open squares: shuffled, randomized data; open dots: 8 mM glucose; crosses 6 mM glucose; full line RMT prediction Σ2(L) = 1/π2(log(2πL) + 1 + γ – π2/8) (Mehta, 2004); dashed line Poissonian limit Σ2(L) = L.
The authors apologize for this omission and state that this does not change the scientific conclusions of the article in any way. The original article has been updated.