

Abstract
Background
Identifying pregnancy‐associated risk factors before the development of major cardiovascular disease events could provide opportunities for prevention. The objective of this study was to determine the association between outcomes in first pregnancies and subsequent cardiovascular health.
Methods and Results
The Nulliparous Pregnancy Outcomes Study Monitoring Mothers‐to‐be Heart Health Study is a prospective observational cohort that followed 4484 women 2 to 7 years (mean 3.2 years) after their first pregnancy. Adverse pregnancy outcomes (defined as hypertensive disorders of pregnancy, small‐for‐gestational‐age birth, preterm birth, and stillbirth) were identified prospectively in 1017 of the women (22.7%) during this pregnancy. The primary outcome was incident hypertension (HTN). Women without adverse pregnancy outcomes served as controls. Risk ratios (RR) and 95% CIs were adjusted for age, smoking, body mass index, insurance type, and race/ethnicity at enrollment during pregnancy. The overall incidence of HTN was 5.4% (95% CI 4.7% to 6.1%). Women with adverse pregnancy outcomes had higher adjusted risk of HTN at follow‐up compared with controls (RR 2.4, 95% CI 1.8‐3.1). The association held for individual adverse pregnancy outcomes: any hypertensive disorders of pregnancy (RR 2.7, 95% CI 2.0‐3.6), preeclampsia (RR 2.8, 95% CI 2.0‐4.0), and preterm birth (RR 2.7, 95% CI 1.9‐3.8). Women who had an indicated preterm birth and hypertensive disorders of pregnancy had the highest risk of HTN (RR 4.3, 95% CI 2.7‐6.7).
Conclusions
Several pregnancy complications in the first pregnancy are associated with development of HTN 2 to 7 years later. Preventive care for women should include a detailed pregnancy history to aid in counseling about HTN risk.
Clinical Trial Registration
URL: http://www.clinicaltrials.gov Unique identifier: NCT02231398.
Keywords: adverse pregnancy outcomes, hypertension, risk, preeclampsia, preterm birth
Subject Categories: Hypertension, Preeclampsia
Clinical Perspective
What Is New?
Hypertensive disorders of pregnancy and preterm birth herald an increased risk of hypertension, particularly high (45.4% by the new criteria) in women who had an iatrogenic preterm birth, many of whom experienced hypertensive disorders of pregnancy.
When compared with women who developed other adverse pregnancy outcomes, women with hypertensive disorders of pregnancy, those diagnosed with preeclampsia, and women with an iatrogenic preterm birth had a higher risk of subsequent incident hypertension.
What Are the Clinical Implications?
The short time frame (2‐7 years) to the discovery of hypertension after pregnancy among a population of young women highlights the importance of a detailed pregnancy history in preventive health screening, early diagnosis, and intervention.
First pregnancies might be utilized as an early life stress test to identify women who may benefit from preventive and screening strategies for healthy behaviors and therapies.
Cardiovascular disease (CVD) is the leading cause of mortality among women in the United States and developed countries.1 Young women (<55 years old) in particular are experiencing an increase in CVD risk factor prevalence and severity, and CVD death rates have stagnated in young women compared with other groups.2 In addition, there is racial disparity in CVD: the US age‐adjusted death rate from coronary heart disease and stroke are markedly higher for non‐Hispanic black than for non‐Hispanic white women.1 Dyslipidemia, inflammation, and central adiposity are strongly related to CVD risk among women.3, 4, 5 Identification of pathophysiology unique to women has considerable potential to augment CVD prevention.6
Adverse pregnancy outcomes (APOs), such as hypertensive disorders of pregnancy (HDP) and preterm birth (PTB), were once regarded as obstetrical conditions with implications limited to pregnancy. However, mounting evidence suggests that, after controlling for traditional risk factors for these conditions, women who experience APOs are at higher risk for subsequent development of hypertension (HTN), CVD, and diabetes mellitus at younger ages than those without APOs.7, 8, 9, 10 Most studies have relied on retrospectively collected data and/or self‐reported reproductive history11, 12, 13, 14, 15, 16 and thus are prone to misclassification or recall bias. Additionally, these studies have lacked assessment of cardiometabolic status during the index pregnancy, which also limits understanding of CVD risk trajectory.
The nuMoM2b‐HHS (Nulliparous Pregnancy Outcomes Study—Monitoring Mothers‐to‐be Heart Health Study) was designed to overcome these limitations. It had a primary objective of establishing the association between pregnancy outcomes and subsequent cardiovascular health by analyzing data from a large cohort of women, with detailed clinical and biospecimen data available, who were followed prospectively from the beginning of their first pregnancy through 2 to 7 years postpartum.
Methods
The data that support the findings of this study are available from the data‐coordinating center on reasonable request.
Participants and Contact
The complete methods of the nuMoM2b‐HHS are described elsewhere.17 The study was approved by all local governing institutional review boards. Briefly, contacts were made and interviews performed by telephone or email at 6‐month intervals, beginning at least 6 months after delivery of the index pregnancy. During interviews, women updated contact information and answered questionnaires regarding any subsequent pregnancies, medications, medical conditions, and CVD events or diagnoses. Self‐reported APOs or CVD events subsequent to the index pregnancy were verified by obtaining medical records. Details about interval contacts are contained in the methods publication.17
Women were eligible to participate in an in‐person cardiovascular assessment if they participated in the nuMoM2b study18 (a prospective cohort of women in their first pregnancy recruited in the first trimester), had obstetrical delivery information from the index pregnancy, agreed to be contacted for future studies, did not subsequently withdraw consent during an interval contact, and were 18 years of age or older, at least 2 years from the delivery of their index pregnancy, and not currently pregnant. All participants gave written informed consent approved by each site's human subjects ethical review board.
An in‐person nuMoM2b‐HHS visit was conducted 2 to 7 years after the index pregnancy ended. Participants were asked to fast for 8 hours (including a long sleep period) before the visit. Demographic characteristics, health care information, current medication and supplement use, family and personal medical history (including a detailed CVD medical history), alcohol, tobacco, and drug use, and physical activity information were obtained. Participants completed validated self‐administered questionnaires detailing food intake and eating habits, sleep characteristics, perceived stress, depression, and gynecologic health. In general, we used questions previously demonstrated to be predictive of a clinical diagnosis and/or standardized in large cohort studies.19, 20 Blood pressure, anthropometric measurements, and biological specimens were collected at the visit using standardized protocols.
Measures, Outcomes, and Definitions
Pregnancy outcomes were recorded by study personnel at the time of delivery and verified by trained, certified clinical chart abstractors. For participants with HTN, proteinuria, or a related condition possibly consistent with HDP as noted in the medical record, the chart review was more extensive in order to classify HDP according to a priori study criteria or, in cases when uncertainty as to the diagnosis remained, adjudication by study investigators. HDP included all cases of preeclampsia (without severe features, with severe features, superimposed preeclampsia, or eclampsia regardless of the timing of onset) and antepartum gestational hypertension, with full details of the categorization procedure described elsewhere.21 Other APOs considered as exposures were PTB, small‐for‐gestational‐age birth, and stillbirth, defined per standard obstetrical definitions.18 PTB was defined as a live birth <37 weeks +0 days gestational age and based on prior study definitions, further subclassified as iatrogenic (medically indicated) PTB or spontaneous PTB. Small‐for‐gestational‐age birth was calculated using the Alexander growth curves from birth weight and gestational age at birth and defined at less than the 5th percentile.22 Gestational diabetes mellitus was defined as failing standard glucose tolerance testing during pregnancy without preexisting diabetes mellitus.23 Women with only gestational diabetes mellitus are not included in the current analysis of women with APOs. Analyses excluded women who experienced pregnancy loss before 20 weeks or pregnancy termination.
Blood pressure (BP) and anthropometric measures were obtained during the nuMoM2b‐HHS visit.17 Following a standard protocol, research personnel recorded 3 standardized BP measurements using calibrated automatic devices that were the same at each site. With the participant seated, BP measurements were recorded, and the average of the last 2 systolic and diastolic pressures were used for analysis.17
Body composition was assessed as body mass index (kg/m²) from measures of height and weight obtained using a regularly calibrated balance‐beam scale for weight and a stadiometer for height measurements. Waist circumference over the iliac crest was measured to the nearest 0.1 cm using a nonstretch study measuring tape. The measurement was taken twice, and if the difference between the 2 was >0.5 cm, a third measurement was recorded. For analyses, the third measurement (if performed) or average of the first 2 measurements was used.
The primary outcome of the study was HTN that developed subsequent to the index pregnancy, as determined by BP measurement or use of an antihypertensive medication for blood pressure control at the 2‐ to 7‐year postpartum study visit. HTN was chosen as the primary outcome due to its strong association with CVD risk and death.24 The diagnostic threshold for HTN was a systolic BP ≥140 mm Hg or a diastolic BP ≥90 mm Hg.25, 26 This diagnostic threshold, determined as a study outcome based on the criteria for HTN extant at the time the study was designed, was used for the primary analyses. Unless specified, incident HTN is diagnosed based on this definition. Recently updated guidelines, however, have redefined the lower threshold for HTN as a systolic BP ≥130 mm Hg or a diastolic BP ≥80 mm Hg.24 We performed a post hoc analysis using these thresholds as well.
Relevant cardiovascular health biomarkers were analyzed using banked frozen maternal serum (lipid panel) and whole blood (glucose) collected and processed at the nuMoM2b‐HHS study visit.17 Metabolic syndrome was defined as the presence of 3 of the following 5 criteria: elevated waist circumference, elevated triglycerides or taking medication to lower them, elevated fasting glucose or taking associated glucose‐lowering medication, elevated blood pressure or taking antihypertensive medication, reduced high‐density lipoprotein levels or taking associated medications.27
Statistical Considerations and Analysis
The sample size of ≈5000 participants with nuMoM2b‐HHS in‐person visits was determined a priori by considering detectable HTN risk ratios and detectable mean differences in various continuous measures of CVD risk at 2 to 7 years postpartum for specific APOs versus comparison groups. Details are described elsewhere.17 Briefly, assuming a 2% incidence of HTN at follow‐up for the non‐APO controls, unadjusted risk ratios from 2.1 to 2.7 for HTN among women with specific APOs would be detectable with 80% power, assuming prevalence of an individual APO ranging from 4% to 10%.
Index pregnancy characteristics and cardiovascular characteristics at follow‐up were summarized using means and standard deviations for continuous variables, and frequency and percentage for categorical variables. After exclusion of women with chronic HTN before the index pregnancy or missing HTN information at the study visit (Figure), univariate associations between APOs and HTN were tested using chi‐squared tests for categorical variables and t tests for continuous variables. The incidence of HTN 2 to 7 years after the index pregnancy was estimated using binomial proportions and Wald 95% CIs; exact Clopper‐Pearson CIs were used within small APO‐specific subgroups (n≤40).
Figure 1.
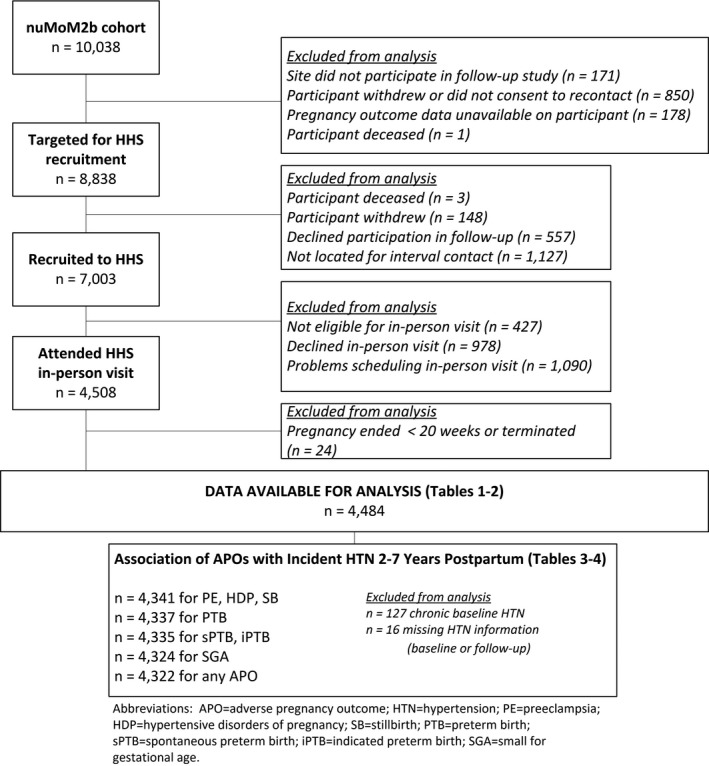
Flow diagram for participation in analysis. APO indicates adverse pregnancy outcome; HDP, hypertensive disorders of pregnancy; HHS, Heart Health Study; HTN, hypertension; iPTB, indicated preterm birth; nuMoM2b, Nulliparous Pregnancy Outcome Study—Monitoring Mothers‐to‐Be; PE, preeclampsia; PTB, preterm birth; sPTB, spontaneous preterm birth; SB, stillbirth; SGA, small for gestational age.
Poisson regression with robust standard errors28 was used to estimate the risk ratios (RR) and 95% CIs of incident HTN associated with any APOs. Unadjusted and adjusted (with the covariates of age, body mass index, type of health insurance at nuMoM2b enrollment, race/ethnicity, and smoking during the 3 months before pregnancy) associations were estimated. For these analyses, associations between selected APOs and HTN were tested using 3 comparison groups. Women with a specific APO were compared with (1) women who did not have any of the APOs in the index pregnancy, (2) women without the specific APO (ie, any other APO or no APO), and (3) only women with any other APO. These comparisons provide insight into relative contributions of each APO to the outcomes. We also performed a sensitivity analysis restricted to women who did not have a reported pregnancy between the end of the index pregnancy and the nuMoM2b‐HHS study visit.
We restricted these analyses to women who attended an in‐person visit in order to ensure the analyses were based on objective measures of the primary outcome. Women with missing data for the primary outcome, APOs, baseline HTN, or model covariates were excluded from analyses involving those data. Analyses were performed using SAS V9.4 (Cary, NC) and R (Vienna, Austria).29, 30
Results
After the exclusion criteria had been applied, 8838 of the original 10 038 women enrolled in the nuMoM2b cohort were eligible for nuMoM2b‐HHS, and 7003 (79.2%) completed at least 1 interval contact (Figure). Of these women, 4484 (64.0%) had an index pregnancy delivery at ≥20 weeks of gestation and attended the in‐person study visit. Table 1 displays the overall baseline characteristics of women who attended a study visit. The demographic characteristics of the nuMoM2b‐HHS cohort were representative of the overall nuMoM2b cohort18 and similar to women who did not participate in nuMoM2b‐HHS (Table S1). Rates of APOs in the nuMoM2b‐HHS cohort were also similar to the rates in the overall nuMoM2b cohort (Table S1).
Table 1.
Index Pregnancy Characteristics of nuMoM2b‐HHS Participants According to Index Pregnancy APOs
| Index Pregnancy Characteristics | All Participants (N=4484) | Index Pregnancy APOs* (Not Mutually Exclusive) | |||||||||
|---|---|---|---|---|---|---|---|---|---|---|---|
| No APO (N=3444) | Any APO (N=1017) | HDP (N=612) | Preeclampsia (N=298) | PTB (N=387) | sPTB (N=218) | sPTB <34 wk (N=57) | iPTB (N=167) | SGA (N=187) | SB (N=16) | ||
| Maternal age, mean (SD), y | 27.0 (5.6) | 27.0 (5.5) | 26.9 (5.8) | 26.9 (5.7) | 26.2 (6.0)† | 26.7 (6.0) | 26.7 (5.9) | 26.7 (6.1) | 26.7 (6.3) | 26.5 (6.3) | 27.7 (5.9) |
| Category, n (%) | |||||||||||
| 13 to 21 | 905 (20.2) | 678 (19.7) | 220 (21.6)† | 124 (20.3) | 81 (27.2)† | 90 (23.3)† | 51 (23.4) | 15 (26.3)† | 38 (22.8) | 51 (27.3)† | 3 (18.8) |
| 22 to 35 | 3272 (73.0) | 2544 (73.9) | 714 (70.2)† | 439 (71.7) | 195 (65.4)† | 263 (68.0)† | 149 (68.3) | 34 (59.6)† | 113 (67.7) | 120 (64.2)† | 11 (68.8) |
| >35 | 307 (6.8) | 222 (6.4) | 83 (8.2)† | 49 (8.0) | 22 (7.4)† | 34 (8.8)† | 18 (8.3) | 8 (14.0)† | 16 (9.6) | 16 (8.6)† | 2 (12.5) |
| Maternal race, n (%) | |||||||||||
| White non‐Hispanic | 2786 (62.1) | 2170 (63.0) | 606 (59.6)† | 385 (62.9)† | 153 (51.3)† | 218 (56.3)† | 128 (58.7) | 28 (49.1) | 90 (53.9)† | 87 (46.5)† | 8 (50.0) |
| Black non‐Hispanic | 618 (13.8) | 425 (12.3) | 189 (18.6)† | 115 (18.8)† | 75 (25.2)† | 76 (19.6)† | 38 (17.4) | 13 (22.8) | 38 (22.8)† | 45 (24.1)† | 3 (18.8) |
| Hispanic | 735 (16.4) | 585 (17.0) | 143 (14.1)† | 67 (10.9)† | 44 (14.8)† | 66 (17.1)† | 38 (17.4) | 11 (19.3) | 26 (15.6)† | 38 (20.3)† | 5 (31.3) |
| Asian | 135 (3.0) | 112 (3.3) | 22 (2.2)† | 13 (2.1)† | 5 (1.7)† | 6 (1.6)† | 3 (1.4) | 2 (3.5) | 3 (1.8)† | 6 (3.2)† | ··· |
| Other | 210 (4.7) | 152 (4.4) | 57 (5.6)† | 32 (5.2)† | 21 (7.0)† | 21 (5.4)† | 11 (5.0) | 3 (5.3) | 10 (6.0)† | 11 (5.9)† | ··· |
| Education level, n (%) | |||||||||||
| Less than high school graduate | 327 (7.3) | 219 (6.4) | 106 (10.4)† | 53 (8.7)† | 36 (12.1)† | 46 (11.9)† | 24 (11.0)† | 10 (17.5)† | 22 (13.2)† | 28 (15.0)† | 2 (12.5) |
| High school graduate or GED completed | 508 (11.3) | 372 (10.8) | 134 (13.2)† | 79 (12.9)† | 44 (14.8)† | 58 (15.0)† | 31 (14.2)† | 10 (17.5)† | 27 (16.2)† | 25 (13.4)† | 3 (18.8) |
| Some college credit, no degree | 889 (19.8) | 668 (19.4) | 217 (21.3)† | 137 (22.4)† | 78 (26.2)† | 90 (23.3)† | 45 (20.6)† | 11 (19.3)† | 44 (26.3)† | 36 (19.3)† | 2 (12.5) |
| Associate/technical degree | 501 (11.2) | 370 (10.7) | 126 (12.4)† | 80 (13.1)† | 37 (12.4)† | 50 (12.9)† | 28 (12.8)† | 6 (10.5)† | 21 (12.6)† | 22 (11.8)† | 4 (25.0) |
| Bachelor's degree | 1261 (28.1) | 1021 (29.7) | 234 (23.0)† | 143 (23.4)† | 59 (19.8)† | 87 (22.5)† | 51 (23.4)† | 12 (21.1)† | 36 (21.6)† | 31 (16.6)† | 5 (31.3) |
| Degree beyond bachelor's | 996 (22.2) | 792 (23.0) | 200 (19.7)† | 120 (19.6)† | 44 (14.8)† | 56 (14.5)† | 39 (17.9)† | 8 (14.0)† | 17 (10.2)† | 45 (24.1)† | ··· |
| Type of health insurance, n (%) | |||||||||||
| Commercial | 3087 (69.2) | 2412 (70.4) | 663 (65.8)† | 404 (66.2) | 164 (55.2)† | 232 (60.4)† | 139 (64.7) | 31 (55.4) | 92 (55.1)† | 121 (66.1) | 7 (43.8)† |
| Government/military | 1219 (27.3) | 898 (26.2) | 311 (30.9)† | 183 (30.0) | 121 (40.7)† | 140 (36.5)† | 69 (32.1) | 22 (39.3) | 70 (41.9)† | 57 (31.1) | 9 (56.3)† |
| Self‐pay/other | 152 (3.4) | 117 (3.4) | 34 (3.4)† | 23 (3.8) | 12 (4.0)† | 12 (3.1)† | 7 (3.3) | 3 (5.4) | 5 (3.0)† | 5 (2.7) | ··· |
| Smoked during 3 mo before pregnancy, n/N (%) | 718/4478 (16.0) | 516/3441 (15.0) | 196/1014 (19.3)† | 110/610 (18.0) | 63/297 (21.2)† | 83/386 (21.5)† | 47/217 (21.7)† | 17/57 (29.8)† | 36/167 (21.6)† | 33/186 (17.7) | 6/16 (37.5)† |
| Early pregnancy BMI, mean (SD), kg/m2 | 26.6 (6.5) | 26.0 (6.1) | 28.5 (7.6) † | 29.8 (7.8)† | 30.2 (8.2)† | 28.0 (7.4)† | 26.1 (5.9) | 28.0 (6.7)† | 30.5 (8.4)† | 26.4 (7.0) | 29.3 (9.2) |
| Category, n (%) | |||||||||||
| <25 | 2284 (51.8) | 1879 (55.6) | 395 (39.3)† | 193 (31.7)† | 91 (31.0)† | 161 (42.6)† | 110 (51.6) | 20 (36.4)† | 50 (30.7)† | 98 (53.6) | 7 (46.7) |
| 25 to <30 | 1081 (24.5) | 809 (23.9) | 263 (26.2)† | 165 (27.1)† | 83 (28.2)† | 101 (26.7)† | 57 (26.8) | 17 (30.9)† | 43 (26.4)† | 45 (24.6) | 4 (26.7) |
| ≥30 | 1042 (23.6) | 692 (20.5) | 346 (34.5)† | 250 (41.1)† | 120 (40.8)† | 116 (30.7)† | 46 (21.6) | 18 (32.7)† | 70 (42.9)† | 40 (21.9) | 4 (26.7) |
| Pregestational hypertension: n/N (%) | 127/4480 (2.8) | 81/3444 (2.4) | 46/1017 (4.5)† | 28/612 (4.6)† | 28/298 (9.4)† | 30/387 (7.8)† | 4/218 (1.8) | ··· | 26/167 (15.6)† | 8/187 (4.3) | 1/16 (6.3) |
| Pregestational diabetes mellitus, n/N (%) | 62/4482 (1.4) | 25/3443 (0.7) | 36/1017 (3.5) | 21/612 (3.4)† | 12/298 (4.0)† | 25/387 (6.5)† | 7/218 (3.2)† | 2/57 (3.5) | 18/167 (10.8)† | 1/187 (0.5) | 3/16 (18.8)† |
| Gestational diabetes mellitus, n/N (%) | 191/4422 (4.3) | 127/3419 (3.7) | 63/981 (6.4)† | 37/591 (6.3)† | 25/286 (8.7)† | 23/362 (6.4)† | 16/211 (7.6)† | 7/55 (12.7)† | 7/149 (4.7) | 9/186 (4.8) | ··· |
APO indicates adverse pregnancy outcome; BMI, body mass index; GED, general equivalency degree; HDP, hypertensive disorders of pregnancy; iPTB, indicated preterm birth; n, number in category; N, sample size; nuMoM2b‐HHS, Nulliparous Pregnancy Outcome Study—Monitoring Mothers‐to‐Be—Heart Health Study; PTB, preterm birth; SB, stillbirth; SGA, small for gestational age; sPTB, spontaneous preterm birth.
*APO is defined as hypertensive disorders of pregnancy, preeclampsia, preterm birth, spontaneous preterm birth, indicated preterm birth, small for gestational age, or stillbirth.
Statistical significance for “No APO” vs each of the other categories reported as † P<0.05.
More than 1 in 5 women enrolled in nuMoM2b‐HHS had at least 1 APO during their index pregnancy (n=1017, 22.7%, Table 1). HDP was the most common APO (13.6%; 6.6% with preeclampsia and 7.0% with antepartum gestational HTN), while 8.6% of women had a PTB (4.9% spontaneous PTB and 3.7% iatrogenic PTB), 4.2% had a small‐for‐gestational‐age birth, and 0.4% had a stillbirth. Many of the 167 cases of iatrogenic PTB had concomitant HDP (59.9%), and the proportion was similar when only iatrogenic PTB <34 weeks of gestation was considered (61.5%).
Index pregnancy characteristics of women in the study, stratified by development of individual APOs, are displayed in Table 1. When compared with women who did not have an APO, women who developed an APO in the index pregnancy were more likely to have been younger than 21 or older than 35 years of age, have a body mass index ≥25 kg/m2 at index pregnancy enrollment, self‐identified as non‐Hispanic black, had a lower level of education, had government or military health insurance, and smoked during the 3 months before the pregnancy (all P<0.05). These associations were present for most individual APOs as well. Women who had APOs were also more likely to have been diagnosed with gestational diabetes mellitus during the pregnancy than women who did not develop APOs (6.4% versus 3.7% respectively, P<0.05).
Cardiovascular characteristics of the cohort 2 to 7 years postpartum are shown in Table 2 (characteristics for all subgroups in Table S2). The mean time between the end of the index pregnancy and the study visit was 3.2 years (SD 0.9). A total of 1573 women (35.1%) did not have a pregnancy in the intervening time before the study visit, 1931 (43.1%) had 1 intervening pregnancy, and 980 (21.9%) had 2 or more; 54.5% were overweight or obese, an increase of 6.4% from prepregnancy. Over one‐third of all participants either had high‐density lipoprotein cholesterol <1.3 mmol/L (<50 mg/dL) or were on a high‐density lipoprotein–raising medication (34.5%), whereas 12.0% had elevated triglycerides or were on lipid‐lowering medication. Twenty‐two women (0.49%) had had a verified cardiovascular event between the index pregnancy and the study visit, 7 of which (31.8%) had occurred among women who had had an APO in the index pregnancy (RR for cardiovascular events for women with APOs compared with women who did not have APOs 1.58, 95% CI 0.65‐3.87; Table S3).
Table 2.
Cardiovascular Characteristics 2 to 7 Years After Index Pregnancy
| Cardiovascular Characteristics 2 to 7 y After Index Pregnancy | All nuMoM2b‐HHS Participants (N=4484) |
|---|---|
| BMI, kg/m2, mean (SD) | 27.8 (7.7) |
| Category, n (%) | |
| <25 kg/m2 | 2028 (45.5) |
| 25 to <30 kg/m2 | 1081 (24.2) |
| ≥30 kg/m2 | 1351 (30.3) |
| Waist circumference over iliac crest, cm, mean (SD) | 96.2 (16.5) |
| ≥88 cm (non‐Asian) or ≥80 cm (Asian), n/N (%) | 2916/4461 (65.4) |
| Total cholesterol, mmol/L, mean (SD) | 4.7 (1.0) |
| N with data | 4403 |
| HDL‐C, mmol/L, mean (SD) | 1.4 (0.3) |
| N with data | 4403 |
| <1.3 mmol/L or on HDL‐raising medication, n/N (%) | 1517/4401 (34.5) |
| LDL‐C, mmol/L, mean (SD) | 2.8 (0.9) |
| N with data | 4399 |
| Glucose, mmol/L, mean (SD) | 5.1 (1.3) |
| N with data | 4395 |
| ≥5.6 mmol/L or on glucose‐lowering medication, n/N (%) | 718/4393 (16.3) |
| HbA1c, %, mean (SD) | 5.3 (0.7) |
| N with data | 4384 |
| Insulin, pmol/L, mean (SD) | 65.3 (89.0) |
| N with data | 4381 |
| Triglycerides, mmol/L, mean (SD) | 1.1 (0.7) |
| N with data | 4404 |
| ≥1.7 mmol/L or on lipid‐lowering medication, n/N (%) | 530/4402 (12.0) |
| Creatinine, mmol/L, mean (SD) | 13.1 (7.7) |
| N with data | 4425 |
| Albumin, mg/dL, mean (SD) | 1.8 (6.7) |
| N with data | 4425 |
| Metabolic syndrome*, n/N (%) | 732/4365 (16.8) |
BMI indicates body mass index; HbA1c, glycated hemoglobin; HDL‐C, high‐density lipoprotein cholesterol; LDL‐C, low‐density lipoprotein cholesterol; n, number in category; N, sample size; nuMoM2b‐HHS, Nulliparous Pregnancy Outcome Study—Monitoring Mothers‐to‐Be—Heart Health Study.
*Metabolic syndrome is defined as the presence of 3 of 5 of the following criteria: elevated waist circumference, elevated triglycerides or associated medication, elevated fasting glucose or associated medication, elevated blood pressure or associated medication, and reduced HDL‐C or associated medication.
The hypertensive status of all nuMoM2b‐HHS participants is provided in Table 3. HTN developed in 5.4% of women in the cohort after their index delivery. Of the 235 women meeting criteria for HTN, 196 (83.4%) were diagnosed by BP measurements at the study visit, and 39 (16.6%) by currently taking antihypertensive drugs. Utilizing the new diagnostic thresholds for HTN published in 2018,24 we determined the incidence of stage II HTN was 20.2%. Women who had been diagnosed with APOs in their first pregnancy had higher mean systolic and diastolic blood pressures (P<0.05) and higher prevalence of HTN by all definitions (P<0.05). The incidence of HTN in women with any APO was 10.8% but was 14.4% for women who had had preeclampsia during their index pregnancy. Under the newer HTN definitions, these rates were 31.2% and 38.5%, respectively (Table 3). Women with an iatrogenic PTB in their index pregnancy had HTN incidence of 45.4% by the 2018 criteria.
Table 3.
Incident Hypertension 2 to 7 Years After Index Pregnancy, According to Index Pregnancy APOs Among nuMoM2b‐HHS Participants Without Baseline Hypertension
| Cardiovascular Characteristics 2 to 7 y After Index Pregnancy | All Participants* (N=4341) | Index Pregnancy APOs (Not Mutually Exclusive) | |||||||||
|---|---|---|---|---|---|---|---|---|---|---|---|
| No APO (N=3355) | Any APO (N=967) | HDP (N=581) | Preeclampsia (N=270) | PTB (N=357) | sPTB (N=214) | sPTB <34 wk (N=57) | iPTB (N=141) | SGA (N=178) | SB (N=15) | ||
| Blood pressure, mean (SD), mm Hg | |||||||||||
| Systolic | 111.1 (10.7) | 110.4 (10.3) | 113.7 (11.3)† | 115.4 (11.4)† | 115.3 (11.8)† | 113.4 (11.1)† | 111.3 (10.5) | 112.0 (9.6) | 116.6 (11.3)† | 110.5 (11.0) | 117.6 (17.1) |
| Diastolic | 71.8 (9.6) | 71.0 (9.2) | 74.4 (10.4)† | 75.9 (10.5)† | 75.4 (10.8)† | 74.2 (10.6)† | 72.1 (9.9) | 73.5 (9.6)† | 77.4 (11.0)† | 71.9 (9.7) | 74.8 (13.4) |
| N with data | 4341 | 3355 | 967 | 581 | 270 | 357 | 214 | 57 | 141 | 178 | 15 |
| Hypertension definitions, n/N (%) | |||||||||||
| HHS: 140≤SBP/90≤DBP, or antihypertensive medication | 235/4341 (5.4) | 128/3355 (3.8) | 104/967 (10.8)† | 76/581 (13.1)† | 39/270 (14.4)† | 43/357 (12.0)† | 14/214 (6.5)† | 5/57 (8.8) | 29/141 (20.6)† | 9/178 (5.1) | 3/15 (20.0)† |
| AMA 2018: 130≤SBP/80≤DBP, or antihypertensive medication | 878/4341 (20.2) | 571/3355 (17.0) | 302/967 (31.2)† | 212/581 (36.5)† | 104/270 (38.5)† | 105/357 (29.4)† | 41/214 (19.2) | 13/57 (22.8) | 64/141 (45.4)† | 41/178 (23.0)† | 6/15 (40.0)† |
| MetSyn: 130≤SBP/85≤DBP, or antihypertensive medication | 501/4341 (11.5) | 300/3355 (8.9) | 198/967 (20.5)† | 142/581 (24.4)† | 68/270 (25.2)† | 74/357 (20.7)† | 28/214 (13.1)† | 8/57 (14.0) | 46/141 (32.6)† | 22/178 (12.4) | 4/15 (26.7)† |
AMA 2018 indicates hypertension guidelines from American College of Cardiology and American Medical Association 2018; APO, adverse pregnancy outcome; DBP, diastolic blood pressure; HDP, hypertensive disorders of pregnancy; HHS, Heart Health Study; iPTB, iatrogenic preterm birth; MetSyn, metabolic syndrome; n, number in category; N, sample size; nuMoM2b, Nulliparous Pregnancy Outcome Study—Monitoring Mothers‐to‐Be; PTB, preterm birth; SB, stillbirth; SBP, systolic blood pressure; SGA, small for gestational age; sPTB, spontaneous preterm birth.
*APO is defined as including hypertensive disorders of pregnancy, preterm birth, small for gestational age, or stillbirth.
Statistical significance † P<0.05 for “No APO” vs each of the other categories.
The association of APOs (HDP, PTB, and stillbirth) in the initial pregnancy remained associated with a greater likelihood to develop HTN 2 to 7 years after pregnancy after adjustment for covariates in multivariable regression (Table 4; unadjusted analyses reported in Table S4). Table 4 presents the RRs for APOs with HTN using 3 different reference groups: comparison 1 compares women with APOs to women without any APOs; comparison 2 compares women with APOs to women without that specific APO; and comparison 3 compares women with APOs to women with other APOs.
Table 4.
Association of Index Pregnancy APOs With Incident Hypertension 2 to 7 Years Later Among nuMoM2b‐HHS Participants Without Baseline Hypertension
| APOs* During Index Pregnancy | n/N (%)(95% CI) | Hypertension 2 to 7 y After Index Delivery‡ | |||
|---|---|---|---|---|---|
| n/N (%)(95% CI)§ | RR (95% CI)Comparison 1∥ | RR (95% CI)Comparison 2¶ | RR (95% CI)Comparison 3# | ||
| Hypertensive disorders of pregnancy** | 581/4341 (13.4%)(12.4%, 14.4%) | 76/581 (13.1%) (10.3%, 15.8%) | 2.7 (2.0, 3.6) | 2.5 (1.9, 3.3) | 1.6 (1.0, 2.4)†† |
| Preeclampsia | 270/4341 (6.2%)(5.5%, 6.9%) | 39/270 (14.4%)(10.3%, 18.6%) | 2.8 (2.0, 4.0) | 2.3 (1.7, 3.2) | 1.5 (1.0, 2.1)†† |
| Preterm birth | 357/4337 (8.2%)(7.4%, 9.0%) | 43/357 (12.0%)(8.7%, 15.4%) | 2.7 (1.9, 3.8) | 2.2 (1.6, 3.1) | 1.3 (0.9, 1.8) |
| Spontaneous preterm birth | 214/4335 (4.9%)(4.3%, 5.6%) | 14/214 (6.5%)(3.2%, 9.9%) | 1.6 (0.9, 2.8) | 1.2 (0.7, 2.1) | 0.6 (0.3, 1.1) |
| Iatrogenic preterm birth | 141/4335 (3.3%)(2.7%, 3.8%) | 29/141 (20.6%)(13.9%, 27.2%) | 4.1 (2.8, 6.2) | 3.3 (2.3, 4.8) | 2.1 (1.4, 3.1) |
| Small for gestational age | 178/4324 (4.1%)(3.5%, 4.7%) | 9/178 (5.1%)(1.8%, 8.3%) | 1.2 (0.6, 2.4) | 1.0 (0.5, 1.8) | 0.5 (0.3, 1.0)†† |
| Stillbirth | 15/4341 (0.3%)(0.2%, 0.5%) | 3/15 (20.0%)(4.3%, 48.1%) | 3.0 (0.9, 9.7) | 2.2 (0.7, 6.8) | 1.3 (0.4, 4.1) |
| Any APO | 967/4322 (22.4%) (21.1%, 23.6%) | 104/967 (10.8%)(8.8%, 12.7%) | 2.4 (1.8, 3.1) | … | … |
| No APO | 3355/4322 (77.6%)(76.4%, 78.9%) | 128/3355 (3.8%)(3.2%, 4.5%) | … | … | … |
APO indicates adverse pregnancy outcome; BMI, body mass index; n, number in category; N, sample size; nuMoM2b‐HHS, Nulliparous Pregnancy Outcome Study—Monitoring Mothers‐to‐Be—Heart Health Study; RR, risk ratio. Baseline hypertension is defined as prior diagnosis of hypertension per chart abstraction.
APO is defined as including hypertensive disorders of pregnancy, preterm birth, small for gestational age, or stillbirth.
Hypertension 2 to 7 y after index pregnancy is defined as HHS‐measured 140≤SBP/90≤DBP or self‐report of antihypertensive medication use.
For denominators ≤40, exact (Clopper‐Pearson) CIs are computed. Otherwise, Wald CIs are computed.
Risk ratio for the comparison of specific APO vs no APOs, adjusted for age and BMI at index pregnancy enrollment, race/ethnicity, type of health insurance, and smoking status during the 3 mo before index pregnancy.
Risk ratio for the comparison of specific APO vs absence of the specific APO, adjusted for age and BMI at index pregnancy enrollment, race/ethnicity, type of health insurance, and smoking status during the 3 mo before index pregnancy.
Risk ratio for the comparison of specific APO vs other APOs adjusted for age and BMI at index pregnancy enrollment, race/ethnicity, type of health insurance, and smoking status during the 3 mo before index pregnancy.
Hypertensive disorders of pregnancy include all cases of preeclampsia (mild, severe, or superimposed preeclampsia or eclampsia regardless of the timing of onset) and antepartum gestational hypertension.
Statistically significant value.
Compared with women without any APOs in the index pregnancy, women who had any APO had a higher risk of HTN 2 to 7 years later (RR 2.4, 95% CI 1.8‐3.1). Specific APOs (HDP, preeclampsia, and PTB; each compared with women without APOs) were also significantly associated with a higher incidence of subsequent HTN (Table 4, comparison 1). Although the risk was high for women with PTB overall, results suggest that women with an iatrogenic PTB had the highest risk of subsequent HTN (RR 4.1, 95% CI 2.8‐6.2). When iatrogenic PTB cooccurred with HDP, there was also an increased risk for subsequent HTN (RR 4.3, 95% CI 2.7‐6.7).
When compared with women who developed other APOs, women with HDP, those diagnosed with preeclampsia, and women with an iatrogenic PTB had a higher risk of subsequent incident hypertension (HDP: RR 1.6, 95% CI 1.0‐2.4; preeclampsia: RR 1.5, 95% CI 1.0‐2.1; iatrogenic PTB: RR 2.0, 95% CI 1.4‐3.0) (Table 4, comparison 3). These results were mildly attenuated when the newer thresholds for the diagnosis of HTN (>130/80) were used (Table S5).
To explore the degree to which the observed associations were related to pregnancies occurring between the index pregnancy and the nuMoM2b‐HHS study visit, we performed a sensitivity analysis limited to women who did not have any pregnancies between these times. The adjusted RRs were similar for women without intervening pregnancies and for those in the overall cohort (data not shown).
Discussion
In this prospective study of women enrolled during their initial pregnancy, women with at least 1 APO in their first pregnancy had a significantly higher risk of HTN at the follow‐up assessment than women without APOs. For the cohort in general, increased hypertension was apparent after only 2 to 7 years of follow‐up. Our cohort also had high rates of dyslipidemia at their study visits.
Although the prevalence of chronic HTN at the beginning of the first pregnancy was 2.8% for women in this cohort, the incidence of HTN only 2 to 7 years after the first pregnancy was 5.4%. The subgroup of women with a HDP had a 13.1% incidence of HTN. These frequencies are even higher (20.2% and 36.5%, respectively) when the new guidelines for the diagnosis of HTN are used.1 The short time frame to the development of hypertension after pregnancy among a population of young women highlights the potential importance of early diagnosis and intervention. These data support the growing recognition that first pregnancies might be utilized as an early life stress test to identify women who may benefit from preventive and screening strategies for healthy behaviors and therapies.7, 8, 9, 31
Our findings build and expand on the findings of prior research.32, 33 A systematic review of studies that included over 3 million women between 1960 and 2006 demonstrated that women who had preeclampsia had a relative risk of vascular disease of 3.7 after 14 years of mean follow‐up, as well as a relative risk of 2.2 and 1.8 for ischemic heart disease and venous thromboembolism, respectively.10 More recently, a study with a 4‐ to 12‐year follow‐up of 487 women demonstrated that those with a PTB developed relatively higher blood pressures and more atherogenic lipid profiles.34 In the Nurses’ Health Study II, women with self‐recalled HDP in their first pregnancy had higher rates of HTN, type 2 diabetes mellitus, and hypercholesterolemia within 5 years after their first birth.16 Higher mean BPs up to 20 years after pregnancy were also seen in 916 women with prior PTB.12 Using administrative records from deliveries in Florida, 1 report noted that women with HDP had twice the risk of cardiovascular readmissions within 3 years.35 Our results are consistent in revealing that HDP and PTB herald an increased risk of HTN. In contrast to other studies, our results are from prospectively gathered and validated data for both the pregnancy as well as the clinical outcomes. Because of this approach, we were able not only to provide estimates of association less prone to bias but also to identify additional granular associations, such as the particularly high risk of HTN (45.4% by the new criteria) in women who had an iatrogenic PTB—many of whom experienced HDP. The higher risk for iatrogenic PTB than for spontaneous PTB may be due to selection of a particularly vulnerable subgroup for preterm delivery, whereas the conditions surrounding spontaneous PTB are much more diverse. We are unaware of other groups reporting substantially increased rates of HTN for subgroups of women with particular APOs this soon after a woman's first delivery.
The interval between the index pregnancy and follow‐up in our study (mean of 3 years) was less than that in most other cohorts, documenting how soon these risks may present. One small case‐control study (n=142) revealed an elevated risk of hypertension at 2 years following delivery for women with preeclampsia.36 The high rates of HTN in some of our subgroups and the fact that 22 women already had a cardiac event within our follow‐up timeframe serve to underscore how critical it is to identify women with increased risk in the early postpartum time.
Bridging the disconnect between obstetric care and adult preventive care is needed.37 As it is clear that women with APOs are at increased risk of chronic diseases, more detailed pregnancy histories may be important in preventive health screening. The American Heart Association guidelines recommend that providers take a careful and detailed history of pregnancy complications that convey CVD risk and measure BP at annual health screenings.6 Our findings support these and similar recommendations from the American College of Obstetricians and Gynecologists38, 39 and further highlight the importance of gathering detailed information about pregnancy outcomes, given that APOs other than HDP are clearly, and to different extents, associated with incident HTN.
The prospective nature of our large and socioeconomically diverse cohort is a clear strength. We began following women in the first trimester of their initial pregnancy, thus limiting recall bias of items such as early pregnancy high body mass index and health conditions developed during pregnancy. The rigorous collection of information both from the index pregnancy and afterwards is another strength.18 Carefully ascertained and verified pregnancy outcomes and cardiovascular outcomes at follow‐up lend validity to the associations identified in this study. Additionally, consistent objective measurement of risk factors between the index pregnancy and the nuMoM2b‐HHS study visit, rather than self‐report, is another strength.
Our results are subject to limitations typical of observational cohort studies. We attempted to overcome several potential biases by using a priori definitions, data collection beginning in the first trimester of pregnancy, and robust follow‐up. It is possible that the women who responded to interval contacts but did not attend an in‐person visit would have differed in their outcomes compared with women who did return. Based on similar demographic characteristics among women who did and did not have visits, this is less likely (Table S1). It is also possible that behaviors and life events, including subsequent pregnancies, during the intervening years between the first pregnancy and the in‐person visit had a greater impact on the development of cardiovascular risk than outcomes of the first pregnancy. However, such associations do not negate the identified relationships between the first pregnancy and subsequent development of adverse outcomes. In fact, when the analysis was confined to women with no intervening pregnancies, the relationship between APOs and CVD risk persisted.
In conclusion, pregnancy complications during a woman's first pregnancy are associated with increased incidence of HTN within 2 to 7 years, much earlier than previously observed. Identification of high‐risk APO combinations and subtypes can guide postpartum counseling, health assessments, and referrals to ensure appropriate monitoring for cardiovascular risk factor development. Furthermore, engaging women who have had APOs to assess the efficacy of lifestyle and other interventions to prevent CVD offers the possibility of improving future cardiovascular health in a focused and personalized manner.40
Sources of Funding
This study is supported by cooperative agreement funding from the National Heart, Lung, and Blood Institute and the Eunice Kennedy Shriver National Institute of Child Health and Human Development: U10‐HL119991; U10‐HL119989; U10‐HL120034; U10‐HL119990; U10‐HL120006; U10‐HL119992; U10‐HL120019; U10‐HL119993; and U10‐HL120018. Support was also provided by the National Institutes of Health: Office of Research on Women's Health through U10‐HL‐119991; Office of Behavioral and Social Sciences Research through U10‐HL119991 and U10‐HL119992; and the National Center for Advancing Translational Sciences through UL‐1‐TR000124, UL‐1‐TR000153, UL‐1‐TR000439, and UL‐1‐TR001108; and the Barbra Streisand Women's Cardiovascular Research and Education Program, and the Erika J. Glazer Women's Heart Research Initiative, Cedars‐Sinai Medical Center, Los Angeles. The content of this article is solely the responsibility of the authors and does not necessarily represent the official views of the National Institutes of Health.
Disclosures
None.
Supporting information
Appendix S1. The Members of nuMoM2b Heart Health Study Network
Table S1. Index Pregnancy Characteristics of Original nuMoM2b Participants, nuMoM2b‐HHS Participants Included in Analyses, and nuMoM2b and nuMoM2b‐HHS Participants Not Included in Analyses
Table S2. Cardiovascular Characteristics 2 to 7 Years After nuMoM2b Index Pregnancy, According to Index Pregnancy APOs
Table S3. Major Cardiovascular Events Experienced Within 2 to 7 Years After Index Pregnancy
Table S4. Association of nuMoM2b Index Pregnancy APOs With Incident Hypertension 2 to 7 Years Later Among nuMoM2b‐HHS Participants Without Baseline Hypertension (Covariate Unadjusted)
Table S5. Association of nuMoM2b Index Pregnancy APOs With Incident Hypertension (AMA 2018) 2 to 7 Years Later Among nuMoM2b‐HHS Participants Without Baseline Hypertension (Covariate Adjusted)
(J Am Heart Assoc. 2019;8:e013092 DOI: 10.1161/JAHA.119.013092.)
References
- 1. Benjamin EJ, Virani SS, Callaway CW, Chamberlain AM, Chang AR, Cheng S, Chiuve SE, Cushman M, Delling FN, Deo R, de Ferranti SD, Ferguson JF, Fornage M, Gillespie C, Isasi CR, Jimenez MC, Jordan LC, Judd SE, Lackland D, Lichtman JH, Lisabeth L, Liu S, Longenecker CT, Lutsey PL, Mackey JS, Matchar DB, Matsushita K, Mussolino ME, Nasir K, O'Flaherty M, Palaniappan LP, Pandey A, Pandey DK, Reeves MJ, Ritchey MD, Rodriguez CJ, Roth GA, Rosamond WD, Sampson UKA, Satou GM, Shah SH, Spartano NL, Tirschwell DL, Tsao CW, Voeks JH, Willey JZ, Wilkins JT, Wu JH, Alger HM, Wong SS, Muntner P; American Heart Association Council on Epidemiology and Prevention Statistics Committee and Stroke Statistics Subcommittee . Heart disease and stroke statistics—2018 update: a report from the American Heart Association. Circulation. 2018;137:e67–e492. [DOI] [PubMed] [Google Scholar]
- 2. Garcia M, Mulvagh SL, Merz CN, Buring JE, Manson JE. Cardiovascular disease in women: clinical perspectives. Circ Res. 2016;118:1273–1293. [DOI] [PMC free article] [PubMed] [Google Scholar]
- 3. Folsom AR, Kaye SA, Sellers TA, Hong CP, Cerhan JR, Potter JD, Prineas RJ. Body fat distribution and 5‐year risk of death in older women. JAMA. 1993;269:483–487. [PubMed] [Google Scholar]
- 4. Gordon T, Castelli WP, Hjortland MC, Kannel WB, Dawber TR. Diabetes, blood lipids, and the role of obesity in coronary heart disease risk for women. The Framingham Study. Ann Intern Med. 1977;87:393–397. [DOI] [PubMed] [Google Scholar]
- 5. Manson JE, Colditz GA, Stampfer MJ, Willett WC, Rosner B, Monson RR, Speizer FE, Hennekens CH. A prospective study of obesity and risk of coronary heart disease in women. N Engl J Med. 1990;322:882–889. [DOI] [PubMed] [Google Scholar]
- 6. Mosca L, Benjamin EJ, Berra K, Bezanson JL, Dolor RJ, Lloyd‐Jones DM, Newby LK, Pina IL, Roger VL, Shaw LJ, Zhao D, Beckie TM, Bushnell C, D'Armiento J, Kris‐Etherton PM, Fang J, Ganiats TG, Gomes AS, Gracia CR, Haan CK, Jackson EA, Judelson DR, Kelepouris E, Lavie CJ, Moore A, Nussmeier NA, Ofili E, Oparil S, Ouyang P, Pinn VW, Sherif K, Smith SC Jr, Sopko G, Chandra‐Strobos N, Urbina EM, Vaccarino V, Wenger NK. Effectiveness‐based guidelines for the prevention of cardiovascular disease in women–2011 update: a guideline from the American Heart Association. Circulation. 2011;123:1243–1262. [DOI] [PMC free article] [PubMed] [Google Scholar]
- 7. Rich‐Edwards JW, McElrath TF, Karumanchi SA, Seely EW. Breathing life into the lifecourse approach: pregnancy history and cardiovascular disease in women. Hypertension. 2010;56:331–334. [DOI] [PMC free article] [PubMed] [Google Scholar]
- 8. Sattar N, Greer IA. Pregnancy complications and maternal cardiovascular risk: opportunities for intervention and screening? BMJ. 2002;325:157–160. [DOI] [PMC free article] [PubMed] [Google Scholar]
- 9. Smith GN, Walker MC, Liu A, Wen SW, Swansburg M, Ramshaw H, White RR, Roddy M, Hladunewich M. A history of preeclampsia identifies women who have underlying cardiovascular risk factors. Am J Obstet Gynecol. 2009;200:58.e51–58. [DOI] [PubMed] [Google Scholar]
- 10. Bellamy L, Casas JP, Hingorani AD, Williams DJ. Pre‐eclampsia and risk of cardiovascular disease and cancer in later life: systematic review and meta‐analysis. BMJ. 2007;335:974. [DOI] [PMC free article] [PubMed] [Google Scholar]
- 11. Lewis CE, Funkhouser E, Raczynski JM, Sidney S, Bild DE, Howard BV. Adverse effect of pregnancy on high density lipoprotein (HDL) cholesterol in young adult women. The CARDIA Study. Coronary Artery Risk Development in Young Adults. Am J Epidemiol. 1996;144:247–254. [DOI] [PubMed] [Google Scholar]
- 12. Catov JM, Lewis CE, Lee M, Wellons MF, Gunderson EP. Preterm birth and future maternal blood pressure, inflammation, and intimal‐medial thickness: the CARDIA study. Hypertension. 2013;61:641–646. [DOI] [PMC free article] [PubMed] [Google Scholar]
- 13. Holzman C, Bullen B, Fisher R, Paneth N, Reuss L. Pregnancy outcomes and community health: the pouch study of preterm delivery. Paediatr Perinat Epidemiol. 2001;15(suppl 2):136–158. [DOI] [PubMed] [Google Scholar]
- 14. Gunderson EP, Lewis CE, Tsai AL, Chiang V, Carnethon M, Quesenberry CP Jr, Sidney S. A 20‐year prospective study of childbearing and incidence of diabetes in young women, controlling for glycemia before conception: the Coronary Artery Risk Development in Young Adults (CARDIA) Study. Diabetes. 2007;56:2990–2996. [DOI] [PMC free article] [PubMed] [Google Scholar]
- 15. Gunderson EP, Chiang V, Lewis CE, Catov J, Quesenberry CP Jr, Sidney S, Wei GS, Ness R. Long‐term blood pressure changes measured from before to after pregnancy relative to nonparous women. Obstet Gynecol. 2008;112:1294–1302. [DOI] [PMC free article] [PubMed] [Google Scholar]
- 16. Stuart JJ, Tanz LJ, Missmer SA, Rimm EB, Spiegelman D, James‐Todd TM, Rich‐Edwards JW. Hypertensive disorders of pregnancy and maternal cardiovascular disease risk factor development: an observational cohort study. Ann Intern Med. 2018;169:224–232. [DOI] [PMC free article] [PubMed] [Google Scholar]
- 17. Haas DM, Ehrenthal DB, Koch MA, Catov JM, Barnes SE, Facco F, Parker CB, Mercer BM, Bairey‐Merz CN, Silver RM, Wapner RJ, Simhan HN, Hoffman MK, Grobman WA, Greenland P, Wing DA, Saade GR, Parry S, Zee PC, Reddy UM, Pemberton VL, Burwen DR; National Heart L, Blood Institute nuMoM2b Heart Health Study Network . Pregnancy as a window to future cardiovascular health: design and implementation of the nuMoM2b Heart Health Study. Am J Epidemiol. 2016;183:519–530. [DOI] [PMC free article] [PubMed] [Google Scholar]
- 18. Haas DM, Parker CB, Wing DA, Parry S, Grobman WA, Mercer BM, Simhan HN, Hoffman MK, Silver RM, Wadhwa P, Iams JD, Koch MA, Caritis SN, Wapner RJ, Esplin MS, Elovitz MA, Foroud T, Peaceman AM, Saade GR, Willinger M, Reddy UM. A description of the methods of the nulliparous pregnancy outcomes study: monitoring mothers‐to‐be (nuMoM2b). Am J Obstet Gynecol. 2015;212:539.e1–539.e24. [DOI] [PMC free article] [PubMed] [Google Scholar]
- 19. Heckbert SR, Kooperberg C, Safford MM, Psaty BM, Hsia J, McTiernan A, Gaziano JM, Frishman WH, Curb JD. Comparison of self‐report, hospital discharge codes, and adjudication of cardiovascular events in the Women's Health Initiative. Am J Epidemiol. 2004;160:1152–1158. [DOI] [PubMed] [Google Scholar]
- 20. Vikse BE, Irgens LM, Bostad L, Iversen BM. Adverse perinatal outcome and later kidney biopsy in the mother. J Am Soc Nephrol. 2006;17:837–845. [DOI] [PubMed] [Google Scholar]
- 21. Facco FL, Parker CB, Reddy UM, Silver RM, Koch MA, Louis JM, Basner RC, Chung JH, Nhan‐Chang CL, Pien GW, Redline S, Grobman WA, Wing DA, Simhan HN, Haas DM, Mercer BM, Parry S, Mobley D, Hunter S, Saade GR, Schubert FP, Zee PC. Association between sleep‐disordered breathing and hypertensive disorders of pregnancy and gestational diabetes mellitus. Obstet Gynecol. 2017;129:31–41. [DOI] [PMC free article] [PubMed] [Google Scholar]
- 22. Alexander GR, Himes JH, Kaufman RB, Mor J, Kogan M. A United States national reference for fetal growth. Obstet Gynecol. 1996;87:163–168. [DOI] [PubMed] [Google Scholar]
- 23. Committee on Practice Bulletins—Obstetrics . ACOG Practice Bulletin no. 190: gestational diabetes mellitus. Obstet Gynecol. 2018;131:e49–e64. [DOI] [PubMed] [Google Scholar]
- 24. Whelton PK, Carey RM, Aronow WS, Casey DE, Collins KJ, Dennison Himmelfarb C, DePalma SM, Gidding S, Jamerson KA, Jones DW, MacLaughlin EJ, Muntner P, Ovbiagele B, Smith SC, Spencer CC, Stafford RS, Taler SJ, Thomas RJ, Williams KA, Williamson JD, Wright JT. 2017 ACC/AHA/AAPA/ABC/ACPM/AGS/APhA/ASH/ASPC/NMA/PCNA guideline for the prevention, detection, evaluation, and management of high blood pressure in adults: a report of the American College of Cardiology/American Heart Association Task Force on Clinical Practice Guidelines. Hypertension. 2018;71:e13–e115. [DOI] [PubMed] [Google Scholar]
- 25. James PA, Oparil S, Carter BL, Cushman WC, Dennison‐Himmelfarb C, Handler J, Lackland DT, LeFevre ML, MacKenzie TD, Ogedegbe O, Smith SC Jr, Svetkey LP, Taler SJ, Townsend RR, Wright JT Jr, Narva AS, Ortiz E. 2014 evidence‐based guideline for the management of high blood pressure in adults: report from the panel members appointed to the Eighth Joint National Committee (JNC 8). JAMA. 2014;311:507–520. [DOI] [PubMed] [Google Scholar]
- 26. Joint National Committee . The seventh report of the joint national committee on prevention, detection, evaluation, and treatment of high blood pressure. 2004. [PubMed]
- 27. Grundy SM, Cleeman JI, Daniels SR, Donato KA, Eckel RH, Franklin BA, Gordon DJ, Krauss RM, Savage PJ, Smith SC Jr, Spertus JA, Costa F; American Heart Association; National Heart, Lung, and Blood Institute . Diagnosis and management of the metabolic syndrome: an American Heart Association/National Heart, Lung, and Blood Institute scientific statement. Circulation. 2005;112:2735–2752. [DOI] [PubMed] [Google Scholar]
- 28. Zou G. A modified Poisson regression approach to prospective studies with binary data. Am J Epidemiol. 2004;159:702–706. [DOI] [PubMed] [Google Scholar]
- 29. R: a language and environment for statistical computing. 2009;3. Available at: http://www.R-project.org. Accessed July 8, 2010.
- 30. Højsgaard S, Halekoh U, Yan J. The R package geepack for generalized estimating equations. Journal of Statistical Software. 2005;15:11. [Google Scholar]
- 31. Ehrenthal DB, Catov JM. Importance of engaging obstetrician/gynecologists in cardiovascular disease prevention. Curr Opin Cardiol. 2013;28:547–553. [DOI] [PMC free article] [PubMed] [Google Scholar]
- 32. Berends AL, de Groot CJ, Sijbrands EJ, Sie MP, Benneheij SH, Pal R, Heydanus R, Oostra BA, van Duijn CM, Steegers EA. Shared constitutional risks for maternal vascular‐related pregnancy complications and future cardiovascular disease. Hypertension. 2008;51:1034–1041. [DOI] [PubMed] [Google Scholar]
- 33. Rich‐Edwards JW, Fraser A, Lawlor DA, Catov JM. Pregnancy characteristics and women's future cardiovascular health: an underused opportunity to improve women's health? Epidemiol Rev. 2014;36:57–70. [DOI] [PMC free article] [PubMed] [Google Scholar]
- 34. Catov JM, Dodge R, Barinas‐Mitchell E, Sutton‐Tyrrell K, Yamal JM, Piller LB, Ness RB. Prior preterm birth and maternal subclinical cardiovascular disease 4 to 12 years after pregnancy. J Womens Health (Larchmt). 2013;22:835–843. [DOI] [PMC free article] [PubMed] [Google Scholar]
- 35. Jarvie JL, Metz TD, Davis MB, Ehrig JC, Kao DP. Short‐term risk of cardiovascular readmission following a hypertensive disorder of pregnancy. Heart. 2018;104:1187–1194. [DOI] [PMC free article] [PubMed] [Google Scholar]
- 36. Melchiorre K, Sutherland GR, Liberati M, Thilaganathan B. Preeclampsia is associated with persistent postpartum cardiovascular impairment. Hypertension. 2011;58:709–715. [DOI] [PubMed] [Google Scholar]
- 37. Roberts JM, Catov JM. Pregnancy is a screening test for later life cardiovascular disease: now what? Research recommendations. Womens Health Issues. 2012;22:e123–e128. [DOI] [PubMed] [Google Scholar]
- 38. Irgens HU, Reisaeter L, Irgens LM, Lie RT. Long term mortality of mothers and fathers after pre‐eclampsia: population based cohort study. BMJ. 2001;323:1213–1217. [DOI] [PMC free article] [PubMed] [Google Scholar]
- 39. ACOG committee opinion no. 736: optimizing postpartum care. Obstet Gynecol. 2018;131:e140–e150. [DOI] [PubMed] [Google Scholar]
- 40. Greenland P, Fuster V. Cardiovascular risk factor control for all. JAMA. 2017;318:130–131. [DOI] [PubMed] [Google Scholar]
Associated Data
This section collects any data citations, data availability statements, or supplementary materials included in this article.
Supplementary Materials
Appendix S1. The Members of nuMoM2b Heart Health Study Network
Table S1. Index Pregnancy Characteristics of Original nuMoM2b Participants, nuMoM2b‐HHS Participants Included in Analyses, and nuMoM2b and nuMoM2b‐HHS Participants Not Included in Analyses
Table S2. Cardiovascular Characteristics 2 to 7 Years After nuMoM2b Index Pregnancy, According to Index Pregnancy APOs
Table S3. Major Cardiovascular Events Experienced Within 2 to 7 Years After Index Pregnancy
Table S4. Association of nuMoM2b Index Pregnancy APOs With Incident Hypertension 2 to 7 Years Later Among nuMoM2b‐HHS Participants Without Baseline Hypertension (Covariate Unadjusted)
Table S5. Association of nuMoM2b Index Pregnancy APOs With Incident Hypertension (AMA 2018) 2 to 7 Years Later Among nuMoM2b‐HHS Participants Without Baseline Hypertension (Covariate Adjusted)