Abstract
Aims
Identification of invasive and radionuclide imaging markers of coronary plaque vulnerability by a single, widely available non-invasive technique may provide the opportunity to identify vulnerable plaques and vulnerable patients in broad populations. Our aim was to assess whether radiomic analysis outperforms conventional assessment of coronary computed tomography angiography (CTA) images to identify invasive and radionuclide imaging markers of plaque vulnerability.
Methods and results
We prospectively included patients who underwent coronary CTA, sodium-fluoride positron emission tomography (NaF18-PET), intravascular ultrasound (IVUS), and optical coherence tomography (OCT). We assessed seven conventional plaque features and calculated 935 radiomic parameters from CTA images. In total, 44 plaques of 25 patients were analysed. The best radiomic parameters significantly outperformed the best conventional CT parameters to identify attenuated plaque by IVUS [fractal box counting dimension of high attenuation voxels vs. non-calcified plaque volume, area under the curve (AUC): 0.72, confidence interval (CI): 0.65–0.78 vs. 0.59, CI: 0.57–0.62; P < 0.001], thin-cap fibroatheroma by OCT (fractal box counting dimension of high attenuation voxels vs. presence of low attenuation voxels, AUC: 0.80, CI: 0.72–0.88 vs. 0.66, CI: 0.58–0.73; P < 0.001), and NaF18-positivity (surface of high attenuation voxels vs. presence of two high-risk features, AUC: 0.87, CI: 0.82–0.91 vs. 0.65, CI: 0.64–0.66; P < 0.001).
Conclusion
Coronary CTA radiomics identified invasive and radionuclide imaging markers of plaque vulnerability with good to excellent diagnostic accuracy, significantly outperforming conventional quantitative and qualitative high-risk plaque features. Coronary CTA radiomics may provide a more accurate tool to identify vulnerable plaques compared with conventional methods. Further larger population studies are warranted.
Keywords: radiomics, coronary CT angiography, intravascular ultrasound, optical coherence tomography, sodium-fluoride positron emission tomography
Introduction
Several imaging markers of plaque vulnerability have been linked to acute coronary events.1,2 Invasive imaging modalities, such as intravascular ultrasound (IVUS) and optical coherence tomography (OCT) are capable of depicting distinct morphologic markers of plaque vulnerability, which have been validated by histology and clinical investigations.3–6
Recently, sodium-fluoride positron emission tomography (NaF18-PET) has been introduced as a radionuclide imaging modality to identify inflammation and microcalcifications in coronary atherosclerotic plaques which are hallmarks of plaque vulnerability.2,7 It would be desirable to have a widely available non-invasive imaging modality, capable of identifying invasive, and/or radionuclide imaging markers of plaque vulnerability.
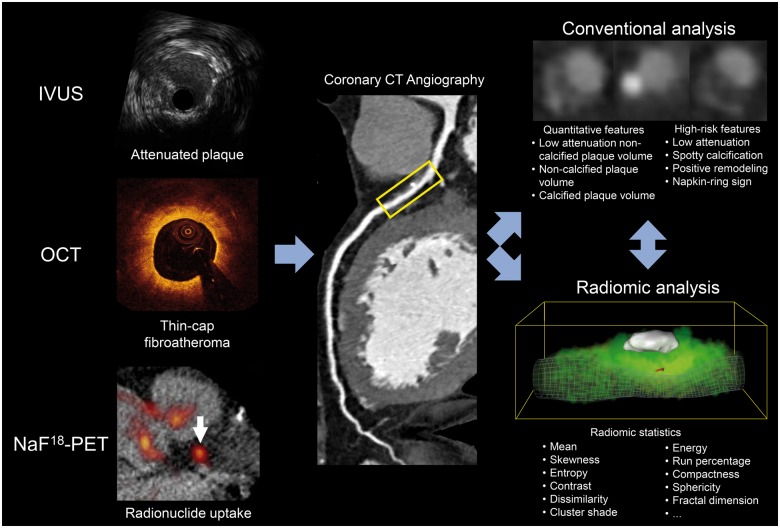
Coronary computed tomography angiography (CTA) is an established non-invasive imaging modality capable of depicting plaque morphology and composition.8 However, visually detectable adverse plaque characteristics based on coronary CTA show only a modest correlation with IVUS, OCT, or NaF18-PET derived features.9 CT datasets contain more information than what is comprehensible by visual inspection.10 This extra information can be extracted using radiomics: the process of obtaining quantitative metrics from radiological images to create big-data datasets, where each lesion is characterized by hundreds of different parameters.11 This technique has been shown to identify complex qualitative morphologies such as the napkin-ring sign on coronary CTA datasets with excellent diagnostic accuracy.12 However, there is no information on whether coronary CTA derived radiomic features could identify invasive and radionuclide imaging markers. Identification of these imaging biomarkers non-invasively by a single, widely available non-invasive technique may provide an opportunity to identify vulnerable plaques and vulnerable patients in daily clinical practice. Therefore, we sought to assess whether coronary CTA radiomics could outperform conventional quantitative and qualitative markers of plaque vulnerability to identify invasive and radionuclide imaging markers of high-risk plaques described by IVUS, OCT, and NaF18-PET (Figure 1).
Figure 1.
Schematic illustration of the applied methods to compare conventional vs. radiomic CT parameters to identify invasive and radionuclide imaging markers of plaque vulnerability. CT, computed tomography; IVUS, intravascular ultrasound; NaF18-PET, sodium-fluoride positron emission tomography; OCT, optical coherence tomography.
Methods
Study population
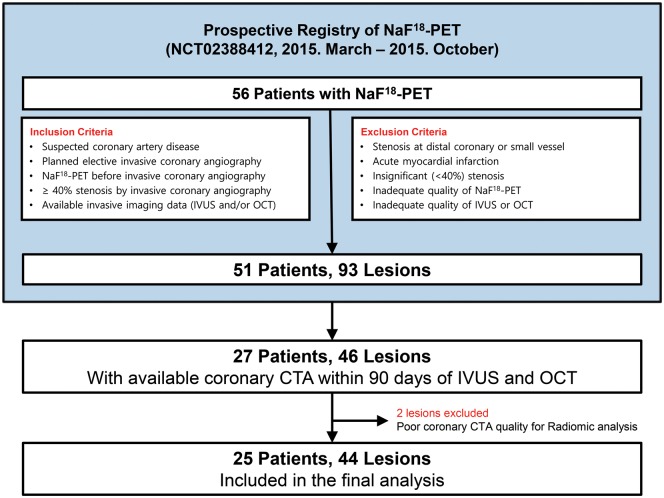
Our patient population is a substudy of a previous investigation assessing the correlation between NaF18-PET activity and invasive imaging biomarkers of high-risk lesions.9 The current study is a post hoc retrospective analysis of patients who have also undergone coronary CTA due to suspected coronary artery disease between March and October of 2015 within 90 days prior to invasive angiography. In total, 27 patients with at least one moderate (40–70%) stenosis on the proximal or mid-portion of any major coronary artery were included in our study. All patients underwent NaF18-PET and invasive coronary angiography. During the invasive procedure, both IVUS and OCT was performed. Two patients were excluded due to inadequate image quality of imaging procedures. Overall, 44 plaques of 25 patients using all four imaging modalities were investigated (Figure 2). The study protocol was approved by the institutional review board and was in accordance with the Declaration of Helsinki. All patients provided written informed consent before enrolment (ClinicalTrials.gov Identifier: NCT02388412). The authors had full access to all the data in the study and take responsibility for its integrity and analysis. The analysis of each imaging modality was done by a single-experienced specialist from each core laboratory.
Figure 2.
A study flowchart. Median intervals from NaF18-PET and coronary CTA to invasive coronary angiography were 0 and 45 days, respectively. CTA, computed tomography angiography; IVUS, intravascular ultrasound; NaF18-PET, sodium-fluoride positron emission tomography; OCT, optical coherence tomography.
Qualitative coronary CTA analysis
Coronary CTA images were obtained in accordance with the Society of Cardiovascular Computed Tomography Guidelines, with a 64-detector row scanner platform (Somatom Definition; Siemens Medical Solutions, Forchheim, Germany).13 The following conventional morphologic adverse plaque characteristics were reported by a core lab (Severance Cardiovascular Hospital, Seoul, Republic of Korea) blinded to all other results: low attenuation plaque (density ≤30 HU), positive remodelling (remodelling index ≥1.1), spotty calcification (density >130 HU and diameter <3 mm), and napkin-ring sign (ring-like attenuation pattern with peripheral high attenuation tissue surrounding a central lower attenuation area).8,14 Lesions with at least two of the four morphologic adverse plaque characteristics were regarded as two-feature positive high-risk plaque on coronary CTA.9
Quantitative coronary CTA analysis
Each coronary plaque was segmented blinded to other imaging modality results using a semi-automated software tool (QAngioCT Research Edition; Medis medical imaging systems bv, Leiden, The Netherlands) at a designated core laboratory (Semmelweis University, Budapest, Hungary). Lumen and vessel contours were manually adjusted if necessary. Using the segmented datasets, voxels containing plaque were exported as a DICOM image (QAngioCT 3D workbench, Medis medical imaging systems bv, Leiden, The Netherlands). Based on the Hounsfield units (HU) values, the volume of low attenuation non-calcified plaque (<30 HU), non-calcified plaque (30–130 HU), and calcified plaque volume (>130 HU) was calculated.15,16
Radiomic coronary CTA analysis
Four different classes of radiomic features were used in our analysis. First-order statistics discard all spatial information and calculate parameters which describe different aspects of the distribution of HU values. Grey level co-occurrence matrices (GLCM) enumerate the frequency of similar value voxels co-occurring next to each other in the given lesion, while grey level run length matrices (GLRLM) describe how often a given number of similar value voxels are situated next to one another.17,18 For these calculations, similar value voxels need to be grouped together. This is done through discretization of HU values to a given number of bins. In our analysis, we discretized the lesions into 2, 8, 32 equally sized (range of values were equally wide) bins creating three replicas of the image. All GLCM and GLRLM metrics were calculated using all three types of binning. Geometry-based statistics were calculated on the original image, as well as each discretized component.
Radiomic features were analysed at a core facility (Semmelweis University, Budapest, Hungary). Overall 935 different radiomic parameters were calculated using the Radiomics Image Analysis (RIA) software package in the R environment.19 Of these parameters, 44 were first-order statistics; 342 were statistics calculated from GLCM; 33 were statistics extracted from GLRLM, while 516 were geometry-based statistical parameters.12 The median time to calculate all 935 parameters for each plaque was: 7.3 (range: 3.8–12.6) min.
NaF18-PET analysis
All patients underwent NaF18-PET before invasive angiography. Electrocardiography-gated NaF18-PET images were obtained using a dedicated PET/CT scanner (Biograph 40 TruePoint; Siemens Healthcare, Germany) 60 min after the injection of 3 MBq/kg of NaF18. Images were reconstructed in four frames and fused with the non-enhanced CT images. Diastolic phases (frames of 50–75% and 75–100% of the R–R intervals) were evaluated blinded to all other results at a core facility (Seoul National University Hospital—Nuclear Medicine, Seoul, Republic of Korea). Maximum standard uptake value was measured and corrected for blood pool activity measured in the inferior vena cava to provide tissue-to-background ratio measurements. The highest tissue-to-background ratio value measured on two diastolic-phase images was adopted for the final analysis. Plaques with NaF18 uptakes higher than 25% were considered as NaF18-positive lesions.2,9
Invasive coronary angiography and intracoronary imaging
Selective invasive coronary angiography was performed utilizing standard techniques. IVUS images were acquired according to the American College of Cardiology Clinical Expert Consensus Document on Standards for Acquisition, Measurement, and Reporting of Intravascular Ultrasound Studies.20,21 The presence of echo attenuation (hypoechoic plaque with deep ultrasound attenuation) was analysed blindly at a core lab (Seoul National University Hospital—CV Research Institute, Seoul, Republic of Korea). All OCT data were assessed blindly at a core laboratory for the presence of thin-cap fibroatheroma (TCFA).9
Statistical analysis
Continuous variables are presented as medians and interquartile ranges, whereas categorical variables are reported as frequencies and percentages. Calculating diagnostic accuracy on the whole dataset, would be overly optimistic and ungeneralizable to other datasets. Therefore, we conducted a stratified five-fold cross-validation with 1000 repeats, which decreases the bias of overfitting and provides a robust estimate of the expected performance in real life.22 A receiver operating characteristics (ROC) curve was calculated for each repeat resulting in overall 1000 ROC curves. These ROC curves were averaged to model the diagnostic performance on the whole population. Area under the curve (AUC) was calculated as an overall measure of diagnostic accuracy. To compare the diagnostic accuracy of conventional and radiomic coronary CTA features, we calculated the two-sided Wilcoxon signed-rank test to compare the distribution of AUC values resulting from the repeated cross-validations. We calculated confidence intervals (CIs) as the 2.5 and 97.5 percentile of the AUC distribution resulting from the repeated cross-validations. All statistical calculations were done in the python environment using the Scikit-learn package.23
Results
Distribution of individual IVUS, OCT, and NaF18-PET imaging markers of plaque vulnerability
Overall, 44 plaques were analysed (Table 1); 30/44 (68.2%) plaques showed attenuation on IVUS, 7/44 (15.9%) showed TCFA on OCT, and in 11/44 (25.0%) cases >25% NaF18 uptake was present. All plaques which were TCFA by OCT also showed attenuation on IVUS. Out of the 30 attenuated plaques 8/30 (26.7%) showed radionuclide uptake on NaF18-PET; however, none of the TCFA plaques showed >25% NaF18 uptake.
Table 1.
Patient and lesion characteristics
| Patient characteristics | |
| Age (years) | 62 (IQR: 59–69) |
| Male | 23 (92) |
| Body mass index (kg/m2) | 25 (IQR: 22–27) |
| Cardiovascular risk factors | |
| Hypertension | 12 (48.0) |
| Diabetes mellitus | 8 (32.0) |
| Hypercholesterolaemia | 18 (72.0) |
| Current smoker | 6 (24.0) |
| Lesion characteristics | |
| Lesion locations | |
| Left main to LAD | 34 (77.3) |
| LCx | 3 (6.8) |
| RCA | 7 (15.9) |
| Quantitative coronary angiography | |
| Reference vessel diameter (mm) | 3.3 (IQR: 2.9–3.6) |
| Minimal lumen diameter (mm) | 1.7 (IQR: 1.4–2.3) |
| Diameter stenosis (%) | 45 (IQR: 33–52) |
| Lesion length (mm) | 11.2 (IQR: 7.9–14.5) |
Continuous variables are presented as median and interquartile ranges, whereas categorical parameters are shown as frequencies and percentages.
IQR, interquartile range; LAD, left anterior descending artery; LCx, left circumflex artery; RCA, right coronary artery.
Table 2.
Diagnostic accuracy of best conventional and radiomic feature to identify invasive and radionuclide imaging markers of plaque vulnerability
| Outcomes | Best conventional and radiomic parameter | AUC | P-value |
|---|---|---|---|
| IVUS-attenuated plaque | Conventional: non-calcified plaque volume | 0.59 (0.57–0.62) | P < 0.001 |
| Radiomics: fractal box counting dimension of high attenuation voxelsa | 0.72 (0.65–0.78) | ||
| OCT-TCFA | Conventional: presence of low attenuation | 0.66 (0.58–0.73) | P < 0.001 |
| Radiomics: fractal box counting dimension of high attenuation voxelsb | 0.80 (0.72–0.88) | ||
| NaF18-PET positivity | Conventional: presence of two high-risk features | 0.65 (0.64–0.66) | P < 0.001 |
| Radiomics: surface of high attenuation voxelsb | 0.87 (0.82–0.91) |
Values in parenthesis indicate confidence intervals.
AUC, area under the curve; IVUS, intravascular ultrasound; NaF18-PET, NaF18-positron emission tomography; OCT-TCFA, optical coherence tomography identified thin-cap fibroatheroma.
Component 30 when discretizing to 32 equally sized bins.
Component 8 when discretizing to eight equally sized bins.
Diagnostic accuracy radiomic features to identify attenuated plaques on IVUS
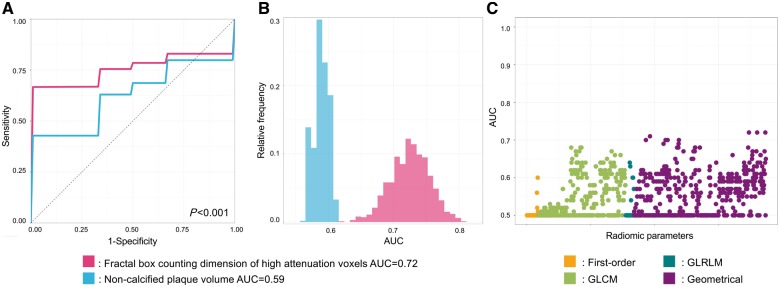
Among radiomic metrics, 35/935 (3.7%) had AUC values between 0.70 and 0.79 and 311/935 (33.3%) had values between 0.60 and 0.69 to identify IVUS-attenuated plaque. Among radiomic metrics fractal box counting dimension of high attenuation (component 30 when discretizing to 32 equally sized bins) voxels showed the best diagnostic accuracy to identify attenuated plaques on IVUS (AUC: 0.72; CI: 0.65–0.78), whereas among the conventional CT metrics, non-calcified plaque volume showed the best discriminatory value (AUC: 0.59; CI: 0.57–0.62), P < 0.001 (Figure 3 and Table 2).
Figure 3.
Diagnostic evaluation of radiomics and conventional CT parameters to identify attenuated plaques on IVUS. (A) Average receiver operating characteristic curves of the best radiomic (pink): fractal box counting dimension of high attenuation voxels (component 30 when discretizing to 32 equally sized bins); and the best conventional (blue) parameter: non-calcified plaque volume, which were calculated by averaging the receiver operating characteristic curves after 1000 repeats of the five-fold cross-validation process. (B) Distribution of the AUC values calculated during the five-fold cross-validation process repeated 1000 times. Dashed lines indicate the means of the AUC distributions. Results are based on the analysis of 44 plaques of 25 patients. (C) Manhattan-plot of radiomic features’ AUC values. Radiomic parameters are situated in consecutive order on the x axis, while their corresponding AUC values to identify attenuated plaques on IVUS are shown on the y axis. AUC, area under the curve; GLCM, grey level co-occurrence matrix; GLRLM, grey level run length matrix.
Diagnostic accuracy of radiomic features to identify OCT-TCFA
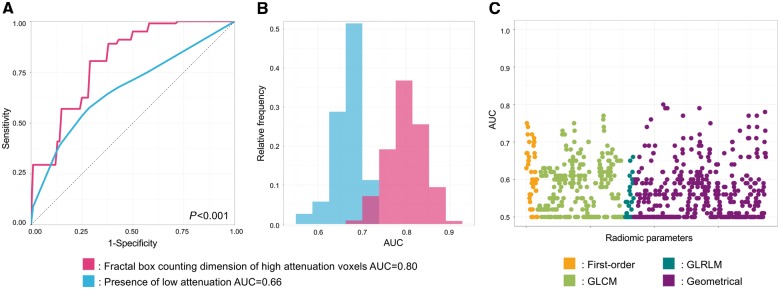
Overall, 1/935 (0.1%) of all radiomic parameters had AUC values between 0.80 and 0.89, 44/935 (4.7%) between 0.70 and 0.79 and 219/935 (23.4%) had values between 0.60 and 0.69 to identify OCT-TCFA. Fractal box counting dimension of high attenuation (component 8 when discretizing to eight equally sized bins) voxels had the best diagnostic accuracy to identify OCT-TCFA (AUC: 0.80; CI: 0.72–0.88), while the presence of low attenuation plaque showed the best discriminatory power among conventional metrics (AUC: 0.66; CI: 0.58–0.73), P < 0.001 (Figure 4 and Table 2).
Figure 4.
Diagnostic evaluation of radiomics and conventional CT parameters to identify OCT-TCFA. (A) Average receiver operating characteristic curves of the best radiomic (pink): fractal box counting dimension of high attenuation voxels (component 8 when discretizing to eight equally sized bins); and the best conventional (blue) parameter: presence of low attenuation, which were calculated by averaging the receiver operating characteristic curves after 1000 repeats of the five-fold cross-validation process. Panel b: distribution of the AUC values calculated during the five-fold cross-validation process repeated 1000 times. Dashed lines indicate the means of the AUC distributions. Results are based on the analysis of 44 plaques of 25 patients. (C) Manhattan-plot of radiomic features’ AUC values. Radiomic parameters are situated in consecutive order on the x axis, while their corresponding AUC values to identify OCT-TCFA are shown on the y axis. AUC, area under the curve; GLCM, grey level co-occurrence matrix; GLRLM, grey level run length matrix.
Diagnostic accuracy of radiomic features to identify increased NaF18 uptake
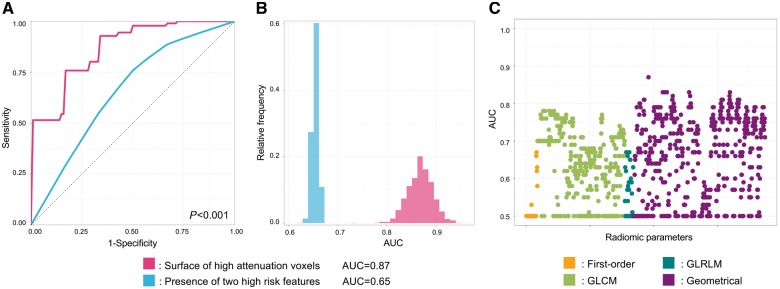
Overall, 30/935 (3.2%) of the radiomic parameters had AUC values between 0.80 and 0.89, 331/935 (35.4%) had values between 0.70 and 0.79 and 232/935 (24.8%) had values between 0.60 and 0.69 to identify NaF18-positivity. Out of the radiomic parameters, the surface of high attenuation (component 8 when discretizing to eight equally sized bins) voxels had the best diagnostic accuracy (AUC: 0.87; CI: 0.82–0.91), while the presence of two high-risk features on CTA had the best discriminatory power (AUC: 0.65; CI: 0.64–0.66) among conventional parameters to identify marked radionuclide uptake using NaF18-PET, P < 0.001 (Figure 5 and Table 2).
Figure 5.
Diagnostic evaluation of radiomics and conventional CT parameters to identify radionuclide activity on NaF18-PET. (A) Receiver operating characteristic curves of the best radiomic (pink): surface of high attenuation voxels (component 8 when discretizing to eight equally sized bins); and the best conventional (blue) parameter: presence of two high-risk features, which were calculated by averaging the receiver operating characteristic curves after 1000 repeats of the five-fold cross-validation process. (B) Distribution of the AUC values calculated during the five-fold cross-validation process repeated 1000 times. Dashed lines indicate the means of the AUC distributions. Results are based on the analysis of 44 plaques of 25 patients. (C) Manhattan-plot of radiomic features’ AUC values. Radiomic parameters are situated in consecutive order on the x axis, while their corresponding AUC values to identify radionuclide activity on NaF18-PET are shown on the y axis. AUC, area under the curve; GLCM, grey level co-occurrence matrix; GLRLM, grey level run length matrix.
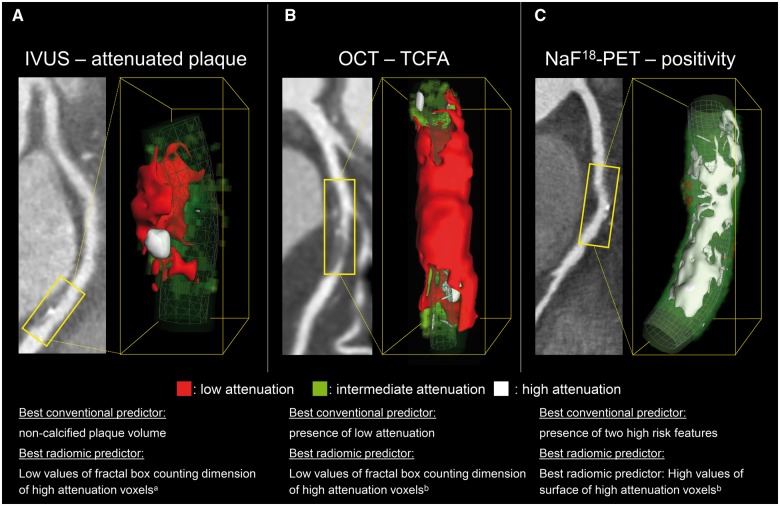
Representative volume rendered CT images of coronary plaques showing attenuation on IVUS, TCFA on OCT, and positivity on NaF18-PET can be found in Figure 6.
Figure 6.
Representative curved multiplanar and volume rendered CT images of three coronary plaques corresponding to specific invasive and radionuclide imaging markers of plaque vulnerability. (A) A coronary lesion which scored the lowest on fractal box counting dimension of high attenuation voxels (component 30 when discretizing to 32 equally sized bins) which was indicative of attenuated plaque on IVUS [AUC: 0.72 (0.65–0.78)]. (B) Depicts a coronary plaque which scored the lowest on fractal box counting dimension of high attenuation voxels (component 8 when discretizing to eight equally sized bins) which was suggestive of OCT-TCFA [AUC: 0.80 (0.72–0.88)]. (C) A coronary lesion which had a high surface of high attenuation voxels (component 8 when discretizing to eight equally sized bins) which was the best parameter to identify NaF18-PET positivity [AUC: 0.87 (0.82–0.91)]. AUC, area under the curve; IVUS, intravascular ultrasound; NaF18-PET, NaF18-positron emission tomography; OCT-TCFA, optical coherence tomography identified thin-cap fibroatheroma. aComponent 30 when discretizing to 32 equally sized bins. bComponent 8 when discretizing to eight equally sized bins.
Discussion
We demonstrated that radiomics can increase the diagnostic accuracy of coronary CTA to identify specific invasive and radionuclide imaging markers of plaque vulnerability. Coronary CTA radiomics showed a good diagnostic accuracy to identify IVUS-attenuated plaques and excellent diagnostic accuracy to identify OCT-TCFA and NaF18-positivity (AUC: 0.72, 0.80, and 0.87, respectively). Furthermore, radiomics outperformed conventional CT metrics to identify these invasive and radionuclide imaging markers (P < 0.001 all).
It seems that by utilizing radiomics, the amount of information accessible in CT images can be greatly increased. Radiological examinations are evaluated mostly by visual inspection in current clinical care. As opposed to this practice, in the current project, we treated radiological images as 3D datasets and extracted hundreds of quantitative parameters from coronary plaques. This strategy resulted in significantly better discriminatory power to identify invasive and radionuclide markers of plaque vulnerability. Radiomics utilizes texture and geometrical analysis to derive novel imaging biomarkers. By measuring how many times a given value voxel pairs occur next to each other, or how many times similar values occur next to each other in a given direction, probability matrices can be calculated which resemble the spatial distribution of the voxel values. The analysis of these matrices leads to new imaging biomarkers, such as heterogeneity, contrast, or spatial fragmentation. Based on our results, it seems that these parameters have a better discriminative capability to identify invasive and radionuclide markers of plaque vulnerability than visual inspection and conventional quantitative assessment.
Coronary CTA for many years was regarded as a rule-out test for obstructive coronary artery disease due to its excellent negative predictive value.24,25 However, its unique ability to non-invasively image atherosclerotic lesions holds great potential to identify high-risk plaques. With the newest guidelines promoting coronary CTA as the first-line test in the management of patients with stable chest pain, the number of examinations will further increase.26 Therefore, the next challenge will be to correctly identify high-risk lesions to improve patient risk assessment. Invasive and radionuclide imaging techniques can identify high-risk lesions; however, their invasive nature and their costs preclude the use of these techniques in daily routine. While CT might not have sufficient spatial resolution, its capability to acquire isotropic 3D data non-invasively creates a unique opportunity to analyse complex spatial image patterns using radiomics.
Invasive imaging modalities with sub-millimetre spatial resolution allow the morphological assessment of coronary plaques. Specific IVUS and OCT imaging markers have been linked to histology and patient outcomes. Our results are in line with previous findings that conventional assessment of coronary CTA only allows identification of invasive imaging markers of plaque vulnerability with moderate accuracy.27 However, in the current study, we showed that radiomic features significantly outperformed conventional metrics, therefore, potentially allowing the non-invasive identification of invasive imaging markers plaque vulnerability.
For both IVUS-attenuated plaque and OCT-TCFA fractal box counting dimension of high attenuation voxels had the highest AUC values. Attenuated plaques based on IVUS are resembled by a hypoechoic plaque area with low ultrasound attenuation indicating the presence of lipids. TCFA-s identified using OCT have a similar spatial pattern; however, the superior spatial resolution of OCT allows the assessment of fibrous-cap thickness, therefore, allowing the identification of TCFA. While the spatial resolution of state-of-the-art coronary CTA-s preclude the identification of the fibrous-cap, the large lipid pools of these lesions have low CT attenuation. As the low attenuation voxels of the lipid pools are situated in the central portion of the plaque, next to each other, the remaining higher attenuation voxels (relative to other voxel values in the plaque, but not necessarily representing calcification) are limited in number and occupy limited space. On the other hand, plaques that do not exhibit large lipid pools have more high attenuation voxels, which can occupy any position inside the plaque in a complex spatial pattern, which can be described using fractal dimensions. Fractal dimensions quantify the spatial complexity of structures. Fractal dimensions are calculated by magnifying the image and assessing how many voxels the given abnormality occupies in relation to the degree of zoom.11 In case of plaques with large lipid pool, the high attenuation voxels are relatively few in number and have limited space to occupy. Therefore, these plaques have low value of fractal box counting dimension of high attenuation voxels. On the other hand, stable plaques, which do not restrict the spatial distribution of high attenuation voxels have higher values for this radiomic parameter. These characteristics might explain that the fractal box counting dimension of high attenuation voxels resulted a good discriminatory power to identify invasive markers of plaque vulnerability.
Even though coronary CTA is an anatomical imaging modality, it seems that radiomics can identify plaques with inflammation and microcalcifications identified using NaF18-PET (AUC = 0.87), both of which are currently regarded as undetectable using coronary CTA. Visual assessment might not be sufficient to distinguish these features. However, it was recently demonstrated that by using simple quantitative metrics it is indeed possible to quantify vascular inflammation using CT, which previously was thought impossible.28 Importantly microscopic calcium formations are too small to be identified using conventional CTA techniques. However, it seems that radiomics can identify unique spatial patterns specific for sodium-fluoride uptake. Among the calculated radiomics parameters the surface of high attenuation voxels (relative to other voxel values in the plaque, but not necessarily voxel values above the calcification threshold) had the highest AUC value to identify increased radionuclide uptake. Even though the spatial resolution of CTA images precludes the identification of microcalcifications, voxels containing microcalcifications may have higher HU values. Furthermore, these high CT number voxels have large surfaces, since they are not grouped in one cluster as opposed to calcified plaques, which also contain high attenuation voxels but overall have smaller surfaces since the voxels are next to each other. These characteristics may have resulted in the excellent diagnostic accuracy of surface of high attenuation voxels to identify increased radionuclide uptake. As there are no plaques showing both invasive and radionuclide imaging markers of plaque vulnerability, the capability of coronary CTA radiomics to identify NaF18-positive is independent of its ability to identify morphologic vulnerability.
A limitation of our study is the relatively small sample size, which might lead to overly optimistic diagnostic results. However, considering that four different imaging techniques were utilized in all patients, we believe that our patient cohort is unique and the sample size is reasonable. To compensate for the limited sample size, we calculated all diagnostic scores using a five-fold cross-validation with 1000 repeats. This technique explicitly simulates the population’s AUC value of each parameter and provides a robust estimate of diagnostic accuracy. Furthermore, our results are based on a single centre study setting where the results were analysed in a core lab. Therefore, the application of our results to general populations is limited as studies have shown that image acquisition, reconstruction, and analysis may have a significant effect on the reproducibility of radiomic features.29–32 However, further investigations are necessary for radiomics to be applicable to clinical care. Larger sample size prospective studies are needed, where the number of patients would allow to build multi-parametric machine learning models, which could robustly identify imaging markers of plaque vulnerability. Furthermore, multi-centre longitudinal studies are warranted to assess the prognostic value of radiomic image markers.
In conclusion, our results suggest that radiomics may be able to identify invasive and radionuclide imaging markers of plaque vulnerability with good to excellent diagnostic accuracy. It seems that there is minimal overlap between anatomical vulnerability features of invasive imaging modalities and NaF18-positivity, which is also reflected by our findings that different radiomic parameters were predictive for these features. Advanced texture analysis of CT images holds magnitudes more information than currently perceivable by clinical visual assessment. These CT radiomic information may allow to identify invasive and radionuclide imaging markers from conventional CT images. Identification of these vulnerability markers by a single, widely available non-invasive technique may provide an opportunity to identify vulnerable plaques and vulnerable patients in broad populations without invasive procedures or costly radionuclide tests. Further studies are warranted to assess the true potential of radiomics to aid precision phenotyping of coronary disease.
Funding
The study was supported by a grant of the Ministry of Health & Welfare, Republic of Korea (grant number: HI14C1277) and was also was supported by the National Research, Development and Innovation Office of Hungary (NKFIA; NVKP-16-1-2016-0017). Furthermore, the research was financed by the Higher Education Institutional Excellence Program of the Ministry of Human Capacities in Hungary, within the framework of the Therapeutic Development thematic programme of the Semmelweis University.
Conflict of interest: M.K. is the creator and developer of the free open-source Radiomics Image Analysis (RIA) software package which was used for radiomic analysis. All remaining authors have declared no conflicts of interest.
References
- 1. Stone GW, Maehara A, Lansky AJ, de Bruyne B, Cristea E, Mintz GS. et al. A prospective natural-history study of coronary atherosclerosis. N Engl J Med 2011;364:226–35. [DOI] [PubMed] [Google Scholar]
- 2. Joshi NV, Vesey AT, Williams MC, Shah AS, Calvert PA, Craighead FH. et al. 18F-fluoride positron emission tomography for identification of ruptured and high-risk coronary atherosclerotic plaques: a prospective clinical trial. Lancet 2014;383:705–13. [DOI] [PubMed] [Google Scholar]
- 3. Koskinas KC, Ughi GJ, Windecker S, Tearney GJ, Raber L.. Intracoronary imaging of coronary atherosclerosis: validation for diagnosis, prognosis and treatment. Eur Heart J 2016;37:524–35a-c. [DOI] [PubMed] [Google Scholar]
- 4. Tearney GJ, Regar E, Akasaka T, Adriaenssens T, Barlis P, Bezerra HG. et al. Consensus standards for acquisition, measurement, and reporting of intravascular optical coherence tomography studies: a report from the International Working Group for Intravascular Optical Coherence Tomography Standardization and Validation. J Am Coll Cardiol 2012;59:1058–72. [DOI] [PubMed] [Google Scholar]
- 5. Calvert PA, Obaid DR, O'Sullivan M, Shapiro LM, McNab D, Densem CG. et al. Association between IVUS findings and adverse outcomes in patients with coronary artery disease: the VIVA (VH-IVUS in Vulnerable Atherosclerosis) Study. JACC Cardiovasc Imaging 2011;4:894–901. [DOI] [PubMed] [Google Scholar]
- 6. Cheng JM, Garcia-Garcia HM, de Boer SP, Kardys I, Heo JH, Akkerhuis KM. et al. In vivo detection of high-risk coronary plaques by radiofrequency intravascular ultrasound and cardiovascular outcome: results of the ATHEROREMO-IVUS study. Eur Heart J 2014;35:639–47. [DOI] [PubMed] [Google Scholar]
- 7. Dweck MR, Chow MW, Joshi NV, Williams MC, Jones C, Fletcher AM. et al. Coronary arterial 18F-sodium fluoride uptake: a novel marker of plaque biology. J Am Coll Cardiol 2012;59:1539–48. [DOI] [PubMed] [Google Scholar]
- 8. Kolossváry M, Szilveszter B, Merkely B, Maurovich-Horvat P.. Plaque imaging with CT—a comprehensive review on coronary CT angiography based risk assessment. Cardiovasc Diagn Ther 2017;7:489–506. [DOI] [PMC free article] [PubMed] [Google Scholar]
- 9. Lee JM, Bang JI, Koo BK, Hwang D, Park J, Zhang J. et al. Clinical relevance of (18)F-sodium fluoride positron-emission tomography in noninvasive identification of high-risk plaque in patients with coronary artery disease. Circ Cardiovasc Imaging 2017;10:e006704. [DOI] [PubMed] [Google Scholar]
- 10. Gillies RJ, Kinahan PE, Hricak H.. Radiomics: images are more than pictures, they are data. Radiology 2016;278:563–77. [DOI] [PMC free article] [PubMed] [Google Scholar]
- 11. Kolossvary M, Kellermayer M, Merkely B, Maurovich-Horvat P.. Cardiac computed tomography radiomics: a comprehensive review on radiomic techniques. J Thorac Imaging 2018;33:26–34. [DOI] [PubMed] [Google Scholar]
- 12. Kolossvary M, Karady J, Szilveszter B, Kitslaar P, Hoffmann U, Merkely B. et al. Radiomic features are superior to conventional quantitative computed tomographic metrics to identify coronary plaques with napkin-ring sign. Circ Cardiovasc Imaging 2017;10:e006843. [DOI] [PMC free article] [PubMed] [Google Scholar]
- 13. Leipsic J, Abbara S, Achenbach S, Cury R, Earls JP, Mancini GJ. et al. SCCT guidelines for the interpretation and reporting of coronary CT angiography: a report of the Society of Cardiovascular Computed Tomography Guidelines Committee. J Cardiovasc Comput Tomogr 2014;8:342–58. [DOI] [PubMed] [Google Scholar]
- 14. Maurovich-Horvat P, Schlett CL, Alkadhi H, Nakano M, Otsuka F, Stolzmann P. et al. The napkin-ring sign indicates advanced atherosclerotic lesions in coronary CT angiography. JACC Cardiovasc Imaging 2012;5:1243–52. [DOI] [PubMed] [Google Scholar]
- 15. Karolyi M, Szilveszter B, Kolossvary M, Takx RA, Celeng C, Bartykowszki A. et al. Iterative model reconstruction reduces calcified plaque volume in coronary CT angiography. Eur J Radiol 2017;87:83–9. [DOI] [PubMed] [Google Scholar]
- 16. Hoffmann U, Moselewski F, Nieman K, Jang IK, Ferencik M, Rahman AM. et al. Noninvasive assessment of plaque morphology and composition in culprit and stable lesions in acute coronary syndrome and stable lesions in stable angina by multidetector computed tomography. J Am Coll Cardiol 2006;47:1655–62. [DOI] [PubMed] [Google Scholar]
- 17. Haralick RM, Shanmugam K, Dinstein I.. Textural features for image classification. IEEE Trans Syst, Man, Cybern 1973;SMC-3:610–21. [Google Scholar]
- 18. Galloway MM. Texture analysis using gray level run lengths. Comput Graph Image Process 1975;4:172–9. [Google Scholar]
- 19. Kolossváry M. RIA: Radiomics Image Analysis Toolbox for Grayscale Images 2017. https://CRAN.R-project.org/package=RIA (22 February 2019, date last accessed).
- 20. Maehara A, Mintz GS, Bui AB, Walter OR, Castagna MT, Canos D. et al. Morphologic and angiographic features of coronary plaque rupture detected by intravascular ultrasound. J Am Coll Cardiol 2002;40:904–10. [DOI] [PubMed] [Google Scholar]
- 21. Mintz GS, Nissen SE, Anderson WD, Bailey SR, Erbel R, Fitzgerald PJ. et al. American College of Cardiology Clinical Expert Consensus Document on Standards for Acquisition, Measurement and Reporting of Intravascular Ultrasound Studies (IVUS). A report of the American College of Cardiology Task Force on Clinical Expert Consensus Documents. J Am Coll Cardiol 2001;37:1478–92. [DOI] [PubMed] [Google Scholar]
- 22. Kim JH. Estimating classification error rate: repeated cross-validation, repeated hold-out and bootstrap. Comput Stat Data Anal 2009;53:3735–45. [Google Scholar]
- 23. Pedregosa F, Varoquaux G, Gramfort A, Michel V, Thirion B, Grisel O. et al. Scikit-learn: machine learning in python. J Mach Learn Res 2011;12:2825–30. [Google Scholar]
- 24. Marwick TH, Cho I, Ó Hartaigh B, Min JK.. Finding the gatekeeper to the cardiac catheterization laboratory: coronary CT angiography or stress testing? J Am Coll Cardiol 2015;65:2747–56. [DOI] [PMC free article] [PubMed] [Google Scholar]
- 25. Yang L, Zhou T, Zhang R, Xu L, Peng Z, Ding J. et al. Meta-analysis: diagnostic accuracy of coronary CT angiography with prospective ECG gating based on step-and-shoot, Flash and volume modes for detection of coronary artery disease. Eur Radiol 2014;24:2345–52. [DOI] [PubMed] [Google Scholar]
- 26.National Institute for Health and Care Excellence (NICE). Chest Pain of Recent Onset: Assessment and Diagnosis [CG95]. 2016. https://www.nice.org.uk/guidance/cg95/chapter/recommendations (23 February 2019, date last accessed). [PubMed]
- 27. Maurovich-Horvat P, Schlett CL, Alkadhi H, Nakano M, Stolzmann P, Vorpahl M. et al. Differentiation of early from advanced coronary atherosclerotic lesions: systematic comparison of CT, intravascular US, and optical frequency domain imaging with histopathologic examination in ex vivo human hearts. Radiology 2012;265:393–401. [DOI] [PubMed] [Google Scholar]
- 28. Antonopoulos AS, Sanna F, Sabharwal N, Thomas S, Oikonomou EK, Herdman L. et al. Detecting human coronary inflammation by imaging perivascular fat. Sci Transl Med 2017;9:eaal2658. [DOI] [PubMed] [Google Scholar]
- 29. Berenguer R, Pastor-Juan MDR, Canales-Vazquez J, Castro-Garcia M, Villas MV, Mansilla Legorburo F. et al. Radiomics of CT features may be nonreproducible and redundant: influence of CT acquisition parameters. Radiology 2018;288:407–15. [DOI] [PubMed] [Google Scholar]
- 30. Altazi BA, Zhang GG, Fernandez DC, Montejo ME, Hunt D, Werner J. et al. Reproducibility of F18-FDG PET radiomic features for different cervical tumor segmentation methods, gray-level discretization, and reconstruction algorithms. J Appl Clin Med Phys 2017;18:32–48. [DOI] [PMC free article] [PubMed] [Google Scholar]
- 31. Shafiq-Ul-Hassan M, Zhang GG, Latifi K, Ullah G, Hunt DC, Balagurunathan Y. et al. Intrinsic dependencies of CT radiomic features on voxel size and number of gray levels. Med Phys 2017;44:1050–62. [DOI] [PMC free article] [PubMed] [Google Scholar]
- 32. Kolossvary M, Szilveszter B, Karady J, Drobni ZD, Merkely B, Maurovich-Horvat P.. Effect of image reconstruction algorithms on volumetric and radiomic parameters of coronary plaques. J Cardiovasc Comput Tomogr 2018;doi:10.1016/j.jcct.2018.11.004. [DOI] [PubMed] [Google Scholar]


