

Abstract
Short precorneal residence time and poor transocular membrane permeability are the major challenges associated with topical ocular drug delivery. In the present research, the efficiency of the electrolyte-triggered sol-to-gel–forming system of natamycin (NT) transfersomes was investigated for enhanced and prolonged ophthalmic delivery. Transfersomes were optimized by varying the molar ratios of phospholipid, sorbitan monostearate (Span) and tocopheryl polyethylene glycol succinate (TPGS). NT transfersome formulations (FNs) prepared with a 1:1 molar ratio of phospholipid-to-Span and low levels of TPGS showed optimal morphometric properties, and were thus selected to fabricate the in situ gelling system. Gellan gum–based (0.3% w/v) FN-loaded formulations (FNGs) immediately formed an in situ gel in the simulated tear fluid, with considerable viscoelastic characteristics. In vitro cytotoxicity in corneal epithelial cells and corneal histology studies demonstrated the ocular safety and cytocompatibility of these optimized formulations. Transcorneal permeability of NT from these formulations was significantly higher than in the control suspension. Moreover, the ocular disposition studies of NT, from the FNs and FNGs, in New Zealand male albino rabbits demonstrated the superiority of the electrolyte-sensitive FNGs in terms of NT delivery to the ocular tissues.
Introduction
Drug delivery to the eye, through the topical route, has been an intricate conundrum owing to its complex structure with various static and dynamic barriers (Urtti, 2006; Patel et al., 2013; Rowe-Rendleman et al., 2014). Rapid clearance from the precorneal space and limited corneal permeability of the drugs from conventional dosage forms are responsible for low ocular bioavailability (<5%) (Urtti, 2006; Ali and Byrne, 2008; Huang et al., 2018). Several formulation strategies such as ocular hydrogels, topical ocular inserts, and ointments have demonstrated increased drug residence in the cul-de-sac (Fathi et al., 2015; Jain et al., 2016; Adelli et al., 2017; Balguri et al., 2017). Lately, in situ hydrogels have been demonstrated to enhance the precorneal residence of topically instilled pharmaceutical compounds, and thereby increase the ocular bioavailability (Mundada and Avari, 2009; Sheshala et al., 2015). These systems undergo rapid sol-to-gel transformation in response to stimuli such as pH, electrolytes, temperature, and photoradiation (Mundada and Avari, 2009; Sheshala et al., 2015). Tears are rich in electrolytes, hence, the ion sensitive in situ gel system rapidly transforms to a hydrogel in the ocular milieu, even at lower polymer concentrations (Rupenthal et al., 2011; Kushwaha et al., 2012).
Drug penetration into the inner ocular tissues is restricted by the cornea due to its distinct anatomic organization of epithelium, stroma, and endothelium (Ali and Byrne, 2008; Mun et al., 2014). Nanotechnology-based formulations such as polymeric nanoparticles or solid lipid nanoparticles, liposomes, niosomes, and micelles have been reported to enhance transcorneal drug permeability (Abdelkader et al., 2012; Agarwal et al., 2016; Balguri et al., 2016; Duxfield et al., 2016; Ikuta et al., 2017). Recently, a few reports in the literature have shown the utility of advanced vesicular systems such as bilosomes and transfersomes, which are ultra-deformable and flexible vesicles, to enhance the permeability of drugs across the ocular membranes (Abdelbary et al., 2016; Garg et al., 2017). These vesicles consist of an edge activator, a hydrophilic/amphiphilic single chain surfactant (replacing/along with cholesterol or phospholipid), which imparts them the superior transmembrane permeability characteristics (Garg et al., 2017).
Several nanocarrier-loaded stimuli-responsive (pH/temperature) in situ gel systems, such as solid lipid nanoparticles, polymeric nanoparticles, and nanoemulsions, which are vesicular system laden in situ gels, were reported to prolong drug residence in the precorneal space and improve permeability across the cornea (Kumar et al., 2013; Ibrahim et al., 2016; Pandurangan et al., 2016; Morsi et al., 2017; Paradkar and Parmar, 2017). Recently, we demonstrated the success of an ion-activated sol-to-gel–transforming system of bilosomes as a suitable ocular drug delivery platform (Janga et al., 2018).
Gellan gum–based, electrolyte sensitive, in situ gel systems of transfersomes have not yet been investigated. Thus, for the first time, the current research aimed to formulate and evaluate the electrolyte-sensitive in situ hydrogels of transfersomes as an effective ocular drug delivery platform. D-alpha tocopheryl polyethylene glycol 1000 succinate [tocopheryl polyethylene glycol succinate (TPGS)] was used as an edge activator. Natamycin (NT), a macrolide polyene antifungal agent, was selected as a model drug due to its shortcomings in terms of precorneal residence, aqueous solubility, and corneal permeability. NT was approved by the US Food and Drug Administration for the treatment of ocular fungal infections, such as fungal keratitis, and it is commercially available as Natacyn (5% w/v) ophthalmic suspension (Tanure et al., 2000). To confirm the feasibility of electrolyte-responsive sol-to-gel–transforming NT transfersomes as a suitable platform for ocular drug delivery, ocular safety, cytocompatibility, in vitro transcorneal permeability, and ocular drug disposition, studies in New Zealand male albino rabbits were conducted.
Materials and Methods
NT was purchased from Cayman Chemical (Ann Arbor, MI). Phospholipon (PL) 90H and Kolliphor TPGS (D-alpha tocopheryl polyethylene glycol 1000 succinate) were obtained from Lipoid, LLC (Newark, NJ) and BASF Corporation (Florham Park, NJ), respectively. Sorbitan monostearate [Span 60 (S60)] and methyl thiazolyl tetrazolium reagent (methyl thiazolyl diphenyl-tetrazolium bromide) were purchased from Sigma Aldrich (St. Louis, MO). Gellan gum (GG) was obtained from MP Biomedicals, LLC (Santa Ana, CA). Dulbecco’s modified Eagle’s medium/nutrient mixture F-12 was ordered from Mediatech, Inc. (Manassas, VA). Glycerin, Amicon ultracentrifugal filters (100 kDa regenerated cellulose membrane), solvents [high-performance liquid chromatography (HPLC) grade], and other analytical grade chemicals were purchased from Fisher Scientific (Hampton, NH). Whole eyes of New Zealand male albino rabbits were procured from Pel-Freez Biologicals (Rogers, AR). New Zealand male albino rabbits were ordered from Harlan Laboratories (Indianapolis, IN).
Quantification of Natamycin.
A previously reported HPLC-UV method, with few changes, was used to determine the amount of NT in the samples (Thangabalan and Kumar, 2013). Briefly, a Luna C18(2) 100 Å phenomenex column (4.6 mm × 250 mm; 5µ particle size) was connected to the Waters 600 controller pump in the HPLC system. A mixture of 30 volumes of acetonitrile and 70 volumes of 0.02 M potassium dihydrogen phosphate (pH 5.5) was used as the mobile phase at a flow rate of 1.0 ml/min. With the help of a Waters 717 plus Autosampler, a sample of 20 µl was injected into the column. The drug was detected at a λmax value of 304 nm on a Waters 2487 Dual λ Absorbance detector. The peak response was recorded using Agilent 3395 Integrator.
Preparation of Natamycin Transfersomes and In Situ Gel Formulations.
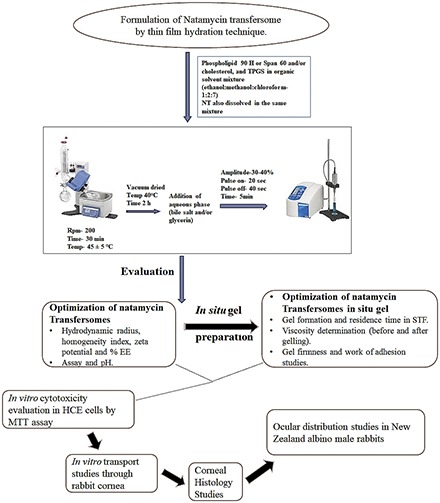
The NT transfersome formulations (FNs) were prepared by the film hydration technique (Abdelkader et al., 2011; Chen et al., 2016; Pitta et al., 2018). All formulation components were accurately weighed and dissolved in a chloroform, ethanol, and methanol (7:1:2 v/v/v) solvent mix taken in a round bottom flask (Table 1). It was then fixed to a rotary flash evaporator (Laborota 4000; Heidolph, Germany) and operated for 30 minutes at 200 rpm to evaporate the solvent mix, at 45 ± 5°C, to form a dry residual lipid film. Deionized water (8–10 ml) with glycerin (2.25% w/v), maintained at 60 ± 5°C, was added to this round bottom flask and agitated to form transfersomes. The FN-loaded formulation (FNG) was prepared by mixing fixed volumes of selected FN and GG solution, maintained at 60 ± 5°C (Table 2). Both FNs and FNGs were placed in screw-capped glass vials, allowed to attain room temperature, and stored for further characterization.
TABLE 1.
Composition and physicochemical properties of natamycin transfersomes (mean ± S.D., n = 3)
A total of 250 µM of lipid mixture was used in all preparations. Ten milliliters of each formulation contained 10 mg of natamycin and 225 mg of glycerin.
| Component/Evaluation Parameter | Formulation |
|||||
|---|---|---|---|---|---|---|
| FN 1 | FN 2 | FN 3 | FN 4 | FN 5 | FN 6 | |
| Molar ratio (Phospholipid 90H:Span60) | 2:1 | 1:1 | 1:2 | 2:1 | 1:1 | 1:2 |
| Phospholipid 90H (mg) | 91 | 122 | 136 | 82 | 109 | 123 |
| Span60 (mg) | 52 | 36 | 27 | 46 | 31 | 23 |
| TPGS (mg) | 10 | 10 | 10 | 50 | 50 | 50 |
| PS (nm) | 192.1 ± 8.6 | 145.2 ± 2.9 | 165.2 ± 2.9 | 171.4 ± 3.9 | 137.3 ± 3.0 | 158.2 ± 6.1 |
| PDI | 0.33 ± 0.12 | 0.20 ± 0.01 | 0.21 ± 0.1 | 0.41 ± 0.1 | 0.32 ± 0.01 | 0.40 ± 0.3 |
| ZP (mV) | −14.4 ± 2.4 | −17.0 ± 1.5 | −20.9 ± 3.7 | −13.2 ± 2.6 | −15.3 ± 1.5 | −18.3 ± 3.1 |
| %EE | 74.1 ± 4.2 | 84.8 ± 4.8 | 69.4 ± 2.4 | 80.7 ± 1.3 | 91.4 ± 2.7 | 75.4 ± 1.5 |
| Drug content (%) | 94.7 ± 2.2 | 95.2 ± 1.6 | 97.1 ± 3.0 | 98.1 ± 1.1 | 98.3 ± 2.3 | 95.6 ± 1.2 |
| pH | 6.3 ± 0.4 | 6.1 ± 0.7 | 6.9 ± 0.1 | 6.2 ± 0.5 | 6.1 ± 0.4 | 6.9 ± 0.1 |
TABLE 2.
Composition and characterization of FN 2 in situ hydrogel formulations (mean ± S.D.; n = 3)
A total of 250 µM of lipid mixture was used in all preparations. Ten milliliters of each formulation contained 10 mg of natamycin and 225 mg of glycerin.
| Component/Evaluation Parameter | Formulation |
|||
|---|---|---|---|---|
| FN 2 | FNG 1 | FNG 2 | FNG 3 | |
| Molar ratio (Phospholipid 90H:Span60) | 1:1 | 1:1 | 1:1 | 1:1 |
| Phospholipid 90H (mg) | 122 | 122 | 122 | 122 |
| Span 60 (mg) | 36 | 36 | 36 | 36 |
| TPGS (mg) | 10 | 10 | 10 | 10 |
| GG (mg) | — | 10 | 20 | 30 |
| Viscosity (cP) (formulation) | 16.8 ± 3.1 | 18.7 ± 1.5 | 27.5 ± 1.4 | 39.6 ± 2.6 |
| GFT (s) | — | <5 | <5 | <5 |
| GRT (h) | — | <1 | 3 to 4 | 6 to 7 |
| Viscosity (cP) (Hydrogel) | — | 94.1 ± 2.5 | 206.9 ± 4.1 | 651.3 ± 1.7 |
| Work of adhesion (g. s) | — | 0.56 ± 0.05 | 0.94 ± 0.02 | 1.33 ± 0.04 |
—, indicates not tested.
g. s, gram. sec.
Morphometric Properties.
The hydrodynamic radius or particle size (PS) and homogeneity index [polydispersity index (PDI)] of the transfersomes were evaluated by a Zetasizer Nano ZS Zen3600 analyzer (Malvern Instruments, UK). Double-distilled water was filtered through 0.2 μm nylon filter and used to dilute (1000 times) the formulations. The diluted formulations were taken in disposable clear cells and subjected to dynamic light scattering at 25°C, utilizing a helium-neon laser beam of 633 nm at 173° angle of detection. Zeta potential (ZP) readings were recorded with the laser Doppler velocimetry option in the Zetasizer.
Drug Content and Entrapment Efficiency.
For drug content analysis, the formulation and solvent mixture [methanol and 190-proof alcohol (70:30 %v/v)] were mixed in a 1:10 ratio and centrifuged (AccuSpin 17R centrifuge; Fisher Scientific) for 20 minutes at 13,000 rpm. The supernatant was collected and drug content in the supernatant was estimated using HPLC.
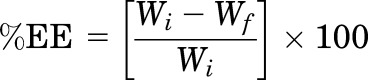
To determine the percentage of drug entrapment efficiency (%EE), an ultra-filtration technique was adopted. A 500 μl formulation was loaded in an Amicon ultra-centrifugal filter (Fisher Scientific), centrifuged for 10 minutes at 5000 rpm (AccuSpin 17R centrifuge; Fisher Scientific), and the aqueous filtrate was collected and quantified for the amount of NT using HPLC. Equation 1 was used to calculate the %EE
 |
(1) |
where Wi = total amount of drug in the formulation, and Wf = drug amount in the aqueous phase.
Sol-To-Gel Characteristics.
In situ hydrogel formation time [gel formation time (GFT)] and intact gel residence time (GRT) were evaluated to determine the gelling properties of the FNGs. To determine the GFT, 50 µl FNG was added to simulated tear fluid [(STF), 2 ml] in glass vials. The vials were placed in a reciprocating water bath (Precision; Fisher Scientific), operated at 100 rpm and at 34°C, and the time taken to form hydrogel was recorded. These vials were inspected visually every hour, for 12 hours, and the time point where the hydrogel dissolved or broke was recorded as the GRT (Nagesh et al., 2012; Paradkar and Parmar, 2017; Janga et al., 2018).
Viscosity Determination.
The rheological properties of the FNs and FNGs and the in situ gels (formed from the corresponding FNGs) were measured using a Brookfield viscometer [LVDV-II+ Pro Viscometer (cone and plate type), Middleboro, MA]. Then, 50 µl of the FN/FNG was taken in the sample holder, the gap from CP-40 spindle to the sample holder plate was adjusted, and the viscometer was operated at 0.1, 1, and 10 rpm, at 25°C. The viscosity measurements were recorded from Rheocalc software (Brookfield Engineering Laboratories, Inc., MA). Similarly, the hydrogel viscosity was determined by adding 500 µl mixture of FNG and STF (50:7) in the sample holder plate (Morsi et al., 2017; Janga et al., 2018).
Texture Properties Determination.
The texture properties of in situ gels from corresponding FNGs were measured on a TA.XT2i texture analyzer (Texture Technologies Corp.) that operated in the compression mode (Tai et al., 2014). A soft matter holder (TA-275) that was loaded with hydrogel was situated under a 1-inch-diameter probe (TA-3), which was operated at a 0.50 mm/s test speed with 3g trigger force until it penetrated 1 mm deep into the hydrogel. The data were recorded at 500 points per second acquisition rate (n = 3).
Morphology of NT Transfersomes.
Transmission electron microscopy (JEOL JEM1200EX II electron microscope) studies were used to examine the morphology of the vesicles in the optimized formulations (FN 2 and FNG 3) according to the earlier protocol with some modifications (Ibrahim et al., 2013). Briefly, FN 2 and FNG 3 were centrifuged at 25,000 rpm, at 15°C, for 1 hour (WX Ultra Series Centrifuge; SORVALL). The transfersome pellet was separated, and then suspended in 5 ml of deionized water and centrifuged at 2000 rpm and 15°C for 5 minutes (Eppendorf AG centrifuge, Hamburg, Germany). The supernatant vesicular suspension was separated and diluted (1:100) with deionized water. On a copper grid (400 mesh), 2 μl of the diluted suspension was taken and Formvar film (Electron Microscopy Sciences EMS, Hatfield, PA) was placed over it. The grids were kept in a desiccator overnight to dry, and then observed under a JEOL 2000EX transmission electron microscope fixed with a high-resolution digital camera and monitor.
Stability Studies.
The glass vials with the optimized formulations were covered with aluminum foil and stored under refrigerated conditions (2–8°C) and at 25°C for 60 days. The samples were withdrawn at preset time points (0, 30, and 60 days) and the morphometric properties, %EE, and drug content were evaluated to determine the stability of the formulations under storage conditions.
Human Corneal Limbal Epithelial Cell Cytotoxicity.
A methyl thiazolyl tetrazolium assay was employed to evaluate the cytotoxicity of FN 2, FN 5, and FNG 3 using human corneal limbal epithelial (HCLE) cells. Briefly, 100 μl per well of HCLE cell suspension (15 × 104 cell/ml) was placed in a 96-well plate (Costar 3596; Corning Inc., Corning, NY) filled with Dulbecco’s modified Eagle’s medium/nutrient mixture F-12 (50:50), containing 10% calf serum and 1% penicillin/streptomycin in the culture medium. The plate was incubated at 37°C in an incubator supplied with 5% CO2 for 24 hours. Then, the medium was replaced by 100 μl of diluted formulations (i.e., 50 μl of each sample and the culture medium), normal saline (negative control), or triton-X-100 (positive control). The cells were washed twice with culture medium after the incubation to ensure complete removal of formulation. To each well, 100 μl of 1 mg/ml methyl thiazolyl tetrazolium reagent was added in the culture medium (without serum). The plates were incubated for 4 hours at 37°C and 5% CO2. After incubation, the formazan crystals (formed during the incubation) were dissolved by replacing the medium with 100 μl DMSO. The color intensity was measured at 570 nm using the µ-Quant universal microplate spectrophotometer (Bio-Tek Instruments, Inc., Winooski, VT). The percentage of cell viability following exposure to the test formulations was calculated relative to that of the negative control (Janga et al., 2018).
Transcorneal Permeability.
Transcorneal permeability studies were conducted across rabbit corneas, excised with some scleral portion, from rabbit whole eyes procured from Pel-Freez Biologicals. Valia-Chien diffusion cells (PermeGear, Inc.), which were specially designed for corneal transport/permeation studies, were used for these studies. Unlike flat mount cells (side-by-side diffusion cells), Valia-Chien cells are shaped like a ball and socket joint that couples the donor and receiver cells. The cornea is mounted on the ball joint, which helps maintain the natural shape of the cornea. The two cells are then locked together and the central part of the cornea spreads flat across the orifice in the center of the spherical joint. This rules out variations in the diffusion surface area that could occur with the side-by-side cells because of changes in the size and shape of the corneas. The corneas were securely mounted onto the diffusion cells and maintained at 34°C, such that the endothelial side faced the receiver chamber and the epithelial side faced the donor chamber. Then, 200 μl of the formulations [control (Natacyn), FN 2, FN 5, and FNG 3] was placed in the donor chamber. To allow hydrogel formation from FNG 3, 50 µl of Dulbecco’s PBS (DPBS) was added to the donor chamber of the cell, along with the formulation. The control (Natacyn) suspension was diluted to drug content equivalent to the tested formulations. Since solubility of NT in DPBS (pH 7.4) with 2.5% w/v of random methyl-beta-cyclodextrin was higher than that in DPBS or isotonic PBS alone, it was used as the receiving medium in the study. At predetermined time intervals, 600 µl of the sample was collected from the receiver cell and the same volume of fresh medium was replaced every time to maintain a constant 5 ml of volume for 3 hours. The drug content in the samples was analyzed using HPLC.
Transcorneal Permeability Data Analysis.
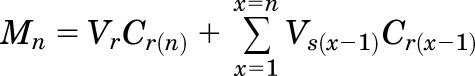
The cumulative amount of drug permeated (M), steady-state flux (J), and apparent permeability (Papp) coefficient are the parameters that determine trancorneal permeation of NT across the rabbit cornea (Majumdar and Srirangam, 2009; Janga et al., 2018). Here, Mn was computed from the following equation:
 |
(2) |
where n, Vr, Vs, and Cr(n) represent the sample time point, receiver chamber media volume, sample volume withdrawn at any time point (in milliliters), and drug concentration in the receiver chamber’s media at a given time point (micrograms per milliliter), respectively.
The rate of drug permeation across the rabbit cornea was measured as the slope derived from the graph between M and time (t). The transcorneal flux (J) of the drug was computed from the following equation (Liu et al., 2018):
| (3) |
where A specifies the cornea surface area (0.636 cm2).
The Papp coefficient of the drug was calculated as the ratio of the transcorneal flux (J) and initial drug concentration in the donor half-cell (Cd) from the following equation (Majumdar and Srirangam, 2009; Balguri et al., 2016):
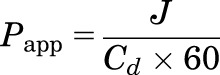 |
(4) |
Histology Study of the Cornea.
The corneas used in the in vitro corneal transport studies were subjected to histology evaluation to determine any changes in corneal anatomy. Immediately after the transcorneal permeation experiment, corneas were stored in 4% paraformaldehyde. After embedding them in paraffin wax, these corneas were sliced into cross sections (5 μm) with a microtome (American Optical 820 Rotary Microtome). These slices of corneal cross sections were taken on a glass slide and placed in the oven for overnight drying. The paraffin traces on the slide were removed by washing with xylene and the tissue was rinsed with water and alcohol. Then, the tissue was washed for 10 minutes using Gill III hematoxylin nuclear dye (StatLab Medical) for staining and eosin for counterstaining. To remove the excess staining, the slide was again washed (with alcohol, water, and xylene). Next, a cover slip was placed on the slide and the tissue was observed through a microscope (Nikon Eclipse 800 microscope). With the aid of PictureFrame 3.0 software (Optronics), the tissue section images were captured.
Ocular Distribution Study.
Conscious New Zealand male albino rabbits (2.5–3.0 kg) were used to determine the ocular distribution of NT from the control (Natacyn) suspension, FN 2, and FNG 3. The study was performed as per the approved protocol of the University of Mississippi Institutional Animal Care and Use Committee and the Association for Research in Vision and Ophthalmology statement. The rabbits were randomly placed into three groups according to the treatment regimen (n = 8). The right eye of each rabbit received 50 µl (topical administration) of the corresponding formulations (Natacyn, FN 2, or FNG 3). At predetermined time points (2 and 6 hours), four rabbits from each group were anesthetized by ketamine and xylazine combination intramuscular injection and sacrificed by an overdose of pentobarbital injected through the marginal ear vein. The treatment eye was washed with a small volume of ice cold isotonic PBS. Then, the eyes were enucleated, and the individual ocular tissues were carefully separated and stored (−80°C).
Extraction of NT from Ocular Tissues.
A protein precipitation technique was employed to extract the NT from the different ocular tissues, such as cornea (Cr), iris-ciliary (IC), aqueous humor (AH), sclera (Sc), vitreous humor (VH), and retina-choroid (RC). Briefly, in separate eppendorf tubes, Cr, IC, Sc, and RC tissues were minced and 1 ml cold methanol (0.1% w/v formic acid) was added. Then, 500 and 200 µl of cold acetonitrile (0.1% w/v formic acid) were introduced into eppendorf tubes containing 500 µl of VH and 200 µl of AH, respectively. All of these samples were vortexed for 30 seconds, sonicated for 10 minutes in a bath sonicator (Fisher Scientific), and centrifuged for 30 minutes at 13,000 rpm. In a separate vial, the supernatant was carefully collected and stored (at −80°C). The amount of NT in the supernatant was quantified by the HPLC method described previously (Thangabalan and Kumar, 2013). A Waters 2487 Dual λ absorbance detector, set to a sensitivity of 0.05 ABSORBANCE UNITS (FULL SCALE), (AUFS), was used to determine the NT content in the various ocular tissues. The calibration plots were linear [coefficient of determination (r2) ≥ 0.95] in all of the ocular tissues. The extraction efficiency, limit of detection, and limit of quantification in the various ocular tissues were 80%, 10 ng/ml, and 20 ng/ml, respectively.
Statistical Analysis.
The data were subjected to one-way ANOVA with Tukey’s Honestly Significant Difference (HSD) (GraphPad version 5.00; GraphPad Software, San Diego, CA) to determine the level of statistical significance of difference, set at P < 0.05, between the formulations.
Results and Discussion
The NT-loaded transfersome formulations were developed successfully using S60 and PL as vesicle-forming components, which are critical in order to obtain stable vesicles with high drug entrapment (Rother et al., 2007; Al-Mahallawi et al., 2015; Chen et al., 2016). Earlier reports suggested the formation of small-sized niosomes with S60 (nonionic surfactant) and stable liposomes with PL, a saturated phospholipid that avoids lipid oxidation-related instability of vesicles (Kulkarni et al., 1995). In recent times, it has been demonstrated that the incorporation of a suitable hydrophilic/amphiphilic nonionic surfactant in the bilayer structure as an edge activator imparted flexibility and deformability characteristics to the vesicles (Shamma and Elsayed, 2013). Hence, TPGS (an amphiphilic surfactant) was used as an edge activator in the transfersomes. All of the FNs (pH 6.1–6.9) showed drug content in the range from 94.7% ± 7.2% to 97.9% ± 4.1% and demonstrated uniform distribution of drug in the formulations (Table 1).
Morphometric Properties and %EE of the FN.
The formulation components in the vesicular systems influence their morphometric properties such as the PS, PDI, and ZP as well as the %EE. Hence, the impact of the PL-to-S60 molar ratio and TPGS quantity on the properties of the transfersomes was investigated. The PS, PDI, ZP, and %EE values of the FNs were in the range from 137.3 ± 3.0 to 192.1 ± 8.6 nm, 0.20 ± 0.01 to 0.41 ± 0.1, −13.2 ± 2.6 to −20.9 ± 3.7 mV, and 69.4% ± 2.4% to 91.4% ± 2.7%, respectively (Table 1).
The transfersomes in the FNs with a 1:1 molar proportion of PL:S60 (FN 2 and FN 5) were smaller compared with the formulations with different molar ratios (Table 1). Close packing of the bilayer in the vesicles due to the strong hydrophobic interactions between the S60 and fatty acid chains of PL may result in transfersomes with a smaller hydrodynamic radius (Shukla et al., 2016; Paradkar and Parmar, 2017). Thus, these formulations showed higher %EE owing to low drug leaching from the transfersomes with tight bilayer packing (Table 1) (Shukla et al., 2016). On the other hand, the transfersomes (FN) preparations with 2:1 and 1:2 molar proportion of PL:S60 were bigger with low %EE, suggesting drug expulsion from the loosely packed vesicles, which could be due to the perturbation of bilayer as the result of an insufficient hydrophobic interaction between lipid (PL) and surfactant (S60) (Shukla et al., 2016; Paradkar and Parmar, 2017). Interestingly, the quantity of edge activator (TPGS) influenced the PDI and %EE, but not the PS and ZP, in the FNs (Table 1).
At any given PL:S60 molar ratio, the %EE and PDI of the transfersomes increased with an increase in the amount of TPGS, which could be attributed to the formation of drug entrapped micelles by the excess amount of TPGS that leaked into the dispersion medium from the bilayer of the transfersomes, and thereby resulted in increased PDI (Table 1) (Rother et al., 2007; Abdelbary et al., 2016). The FNs with lower PDI, smaller size, and higher %EE were considered for further investigations.
Characterization of FN In Situ Gel Systems.
Gellan gum is an anionic polysaccharide polymer with sol-to-gel transformation characteristics in the presence of cations, and thus is used as an electrolyte-sensitive gelling agent. The FNGs were prepared by mixing FN 2 in the solution with GG (0.1%–0.3% w/v). The concentrations of GG tested were well below the value given in the US Food and Drug Administration inactive ingredients database (https://www.accessdata.fda.gov/scripts/cder/iig/index.cfm). GG has a thickening property owing to the formation of double helices with van der Waals forces in the aqueous environment (Morsi et al., 2017). Hence, it was essential to evaluate the viscosity of FNGs. A linear relationship between the concentration of GG and the viscosity of the formulation was observed. The viscosity of the formulations was below 50 cP, which would facilitate administration of topical ophthalmic solutions (Table 2) (Uddin et al., 2017).
The GFT and GRT are critical properties that determine the efficiency of ocular in situ gel systems (Kushwaha et al., 2012; Kumar et al., 2013; Morsi et al., 2017). The GFT of <5 seconds indicated the immediate sol-to-gel phase transition of the FNG in the ocular milieu. The GRT of the hydrogel formed from the FNG increased from <1 to 6 or 7 hours as the concentration of GG increased from 0.1 to 0.3% w/v, respectively (Table 2). An abundance of cations (mono or divalent) in the tear fluid results in the rapid formation of an intact hydrogel matrix by crosslinking GG to form double helix aggregates (Rupenthal et al., 2011; Kumar et al., 2013; Morsi et al., 2017; Pandurangan et al., 2016). Hence, the viscoelastic and work of the adhesion properties of the hydrogels increased linearly with the concentration of GG in the FNGs, suggesting longer precorneal residence (Table 2) (Dintzis et al., 1970; Morsi et al., 2017).
FNG 3 with viscosity of 39.6 ± 2.6 cP showed rapid sol-to-gel transformation in the STF. The resulting hydrogel was intact for >6 hours and was considered for further studies. Furthermore, transmission electron microscopy images of the transfersomes confirm the smooth vesicular-layered structure in FN 2 and FNG 3 (Fig. 1).
Fig. 1.

Transmission electron micrographs depicting the layered morphology of transfersomes for FN 2 (A) and FNG 3 (B).
Cytotoxicity in HCLE Cells.
In vitro cytotoxicity of FN 2, FN 5, and FNG 3 was assessed in HCLE cells. The percentages of cell viability of cells treated with FN 2 and FN 5 were 67.5 ± 4.8 and 17.7 ± 5.4, respectively, which were considerably lower than that observed in the negative control group (saline). The positive control group treated with Triton-X-100 (1%), a nonionic surfactant, showed 6.9% ± 2.5% cell viability. Hence, the drop in the percentage of cell viability of the groups exposed to FN 2 and FN 5 might be related to the overall nonionic surfactant composition (TPGS and S60) in the formulations. The group treated with FN 2 (0.45% w/v of nonionic surfactant) showed a considerably higher percentage of cell viability compared with FN 5 (0.86% w/v of nonionic surfactant). Hence, it is presumed that the higher nonionic surfactant concentration might have contributed to the lower percentage of cell viability. However, no reports in the literature have demonstrated the corneal toxicity of the combination of S60 and TPGS.
The higher percentage of cell viability in the FNG 3 group suggested that the in situ hydrogels of FN 2 are well tolerated by corneal epithelial cells (Table 3). In the cytotoxicity studies, the HCLE cells were exposed to the formulations for 24 hours; however, most topical ophthalmic formulations will be in contact with the cornea for a very short period of time owing to rapid precorneal clearance. Thus, to further examine if the transfersomes have any toxic effects on corneal anatomy, the histology of the corneas from the in vitro transcorneal permeability studies was examined.
TABLE 3.
Percentage of cell viability of HCLE cells treated with FN 2, FN 5, and FNG 2 in vitro cytotoxicity assay (mean ± S.E.M.; n = 6)
| Sample Number |
Treatment Group |
Cell Viability |
|---|---|---|
| % | ||
| 1 | Negative control | 100.0 ± 5.1 |
| 2 | FN 2 | 67.5 ± 4.8 |
| 3 | FN 5 | 17.7 ± 5.4 |
| 4 | FNG 3 | 93.0 ± 6.7 |
| 5 | Positive control | 6.9 ± 2.5 |
Histology of Corneal Anatomy.
The anatomic features of the corneas tested in the corneal transport studies are shown in Fig. 2. The intact cornea shows the stroma layer (SL) sandwich between the epithelial layer (EPL) and endothelial layer. Bowman’s membrane separates the EPL from the SL, while Descemet’s membrane parts the SL from the endothelial layer. Signs of corneal structural damage include shrinking, breaking, or complete loss of the EPL; a gap between the EPL, Bowman’s membrane, and the SL; and vacuoles in the SL. In the current study, no signs of structural damage were noticed in the corneas exposed to FN 2 and FNG 3 in the transcorneal permeation studies (Fig. 2). Furthermore, the absence of remarkable structural variation between these corneas and those treated with control (NT suspension) and DPBS indicated that both FN 2 and FNG 3 did not induce any toxic effects or damage to corneal architecture (Fig. 2). On the other hand, the corneas exposed to FN 5 (0.86% w/v of non-ionic surfactant) showed loss of the EPL and confirmed the corneal toxicity observed in the in vitro cytotoxicity.
Fig. 2.

Histology images of rabbit corneas exposed to DPBS (A), control (B), FN 2 (C), FN 5 (D), and FNG 3 (E).
Transcorneal Permeation Studies.
In vitro transcorneal transport of NT from control, FN 2, FN 5, and FNG 3 is illustrated in Fig. 3, where about 6.3- to 9.0-fold enhancement in the transcorneal steady-state flux of the drug from FN 2 and FNG 3 is observed (Fig. 3B). Furthermore, the Papp coefficient of NT from these formulations was significantly higher than the control suspension (P < 0.05) (Fig. 3C). These results demonstrated the ability of the transfersomes to enhance the NT permeability through the cornea. This is consistent with previous literature reports that illustrate the penetration of non-ionic surfactant-based vesicles across the cornea through the fluidization of lipid constructs in the cornea (Dai et al., 2013; Abdelbary et al., 2016).
Fig. 3.

In vitro transcorneal amount permeated vs. time (A), flux (B), and Papp (C) of natamycin from control, transfersomes, and transfersomes in situ gel formulations (mean ± S.D.; n = 3); * significantly different from control (P < 0.05); ¥ significantly different from any formulation group (P < 0.05).
Interestingly, ∼16-fold higher transcorneal flux of NT from FN 5 was seen over the control suspension with Papp = 3.9 × 10⁻⁵ Cm/s. Moreover, the transcorneal permeation parameters of FN 5 were significantly superior compared with those observed from FN 2 and FNG 3 (P < 0.05) (Fig. 3). In this experiment, a sudden increase in the percentage of the cumulative amount of drug permeated was noticed for FN 5 after the 1-hour time point (Fig. 3A). This could be attributed to corneal damage, and thus cornea anatomy was investigated.
Ocular Drug Disposition Studies.
Based on the cytotoxicity, histology, and transcorneal permeability studies, FN 2 and FNG 3 were selected for ocular distribution studies in New Zealand male albino rabbits. In the ocular drug deposition studies, undiluted Natacyn suspension was used as a control formulation to ensure no underestimation of the marketed product performance. Since the dose of the NT administered as FN 2 and FNG 3 was 50 times lower than the undiluted control, the mean dose-normalized NT concentrations were calculated in the rabbit ocular tissues to compare the ocular permeability of drug from these different formulations (Fig. 4).
Fig. 4.

Mean dose normalized natamycin levels in rabbit ocular tissues from control, transfersomes (FN 2), and transfersomes in situ gel formulations (FNG 3), at 2-hour (A) and 6-hour (B) time points (mean ± S.E.M.; n = 4). ND, not detected; * significantly different from control (P < 0.05); ǂ significantly different from corresponding in situ gel formulation group (P < 0.05); ¥ significantly different from any formulation group (P < 0.05).
In the Cr and AH tissues of the rabbits administered with FN 2 and FNG 3, the mean dose-normalized NT concentrations observed at the end of 2 hours were considerably higher compared with that found in the rabbits treated with NT suspension, suggesting enhancement in the permeation of drug through the Cr (P < 0.05) (Fig. 4A). The advanced vesicles with increased amphiphilic nature, such as bilosomes and transfersomes, owing to the presence of the edge activator intercalates with the lipids in the corneal EPL, partitions into the hydrophilic SL, and thereby penetrates across the endothelial layer into the AH (Shamma and Elsayed, 2013; Morsi et al., 2017; Janga et al., 2018). The poor aqueous solubility limited permeability of NT from the control suspension could have resulted in the low dose-normalized drug concentration in the AH.
The mean dose-normalized concentrations of NT in the Sc of the rabbits administered with FN 2 and FNG 3 were significantly higher compared with that noticed in the rabbit group treated with the NT suspension (Barar et al., 2009; Al-Halafi, 2014). This suggests the depot formation of transfersomes in the sclera. Moreover, the drug levels alone in the RC of the FN 2–treated rabbit group confirm the penetration of the transfersomes across the scleral surface and thereby into the RC (Rother et al., 2007; Chen et al., 2016) (Fig. 4). It has been reported that the scleral tissue, in contrast to the cornea, is 10-fold more permeable to hydrophobic than hydrophilic compounds. Hence, the higher NT concentration in the RC could be attributed to the higher permeability (P < 0.05) of the transfersomes due to their amphiphilic nature. The mean dose-normalized NT levels in the IC of the FN 2– and FNG 3–treated rabbits were significantly higher than the control group rabbits, which demonstrates the improved transocular membrane permeability characteristics of the transfersomes (P < 0.05) (Dai et al., 2013; Morsi et al., 2017). At the end of 2 hours, the drug levels noticed in the majority of the ocular tissues in the FN 2–treated rabbits were considerably higher than that administered with FNG 3, which would be due to the sustained release of transfersomes from the hydrogel (P < 0.05) (Bhatta et al., 2012; Abdelbary et al., 2016).
At the 6-hour time point, in the majority of the ocular tissues (except Sc) of the rabbit group treated with FN 2, the NT levels were below detectable limits (Fig. 4B). However, NT was seen in the Cr, IC, and Sc of rabbits in the control group, which could be due to superior retention of the suspension in the conjunctival sac and/or because of drug reservoir (depot) formation in the Cr and/or Sc tissue. However, NT was not detected in the RC, VH, and AH tissues. These results corroborate with a previous study that demonstrated low NT concentrations (<800 ng/ml) in rabbit tears 5 hours post-treatment with the marketed suspension (Bhatta et al., 2012). In contrast to FN 2, considerable mean dose-normalized NT concentrations in most of the ocular tissues (except VH) in rabbits treated with FNG 3 confirmed increased residence of the NT-loaded transfersome in situ gel in the precorneal space. Higher mucoadhesion of polymer with cellular glycoproteins, which could be attributed to the increased hydrophobic interactions or ionic or hydrogen bonding, leads to longer contact time of hydrogel with the biologic membrane (Yu et al., 1993). These results demonstrate the potential of transfersome-loaded electrolyte-responsive sol-to-gel–transforming systems as a reliable platform for sustained ocular drug delivery.
Stability Studies.
The physical stability data of FN 2 and FNG 3 stored at 4°C and 25°C for 60 days are presented in Table 4. No significant changes were observed in the morphometric properties and the %EE of both FN 2 and FNG 3 stored under both temperature conditions. However, at the end of 60 days the PS, PDI, ZP, and %EE of FN 2 stored at 25°C were statistically different from those observed with the freshly prepared formulation (P < 0.05). This could be due to the aggregation of the vesicles and drug leakage from the vesicles. No significant variations were noticed in the properties of the FNG 3, which could be due to the low or no aggregation of transfersomes. The higher stability of FNG 3 may be due to the presence of the GG polymer, which has a network-like structure and could have prevented the aggregation of transfersomes (Liu et al., 2008). Both formulations, when stored under refrigerated conditions (4°C) for 60 days, did not show significant differences in the physicochemical properties.
TABLE 4.
Physical stability of optimized natamycin transfersomes and transfersomes in situ gel formulations stored at 4°C and 25°C for 60 days (mean ± S.D.; n = 3)
| Formulation |
Storage Temperature |
Time |
PS |
ZP |
PDI |
EE |
Drug Content |
|---|---|---|---|---|---|---|---|
| °C | Days | nm | mV | % | % | ||
| FN 2 | Initial | 145.3 ± 2.9 | −20.0 ± 1.5 | 0.20 ± 0.01 | 84.8 ± 4.8 | 95.2 ± 1.6 | |
| 4 | 30 | 146.2 ± 3.4 | −19.4 ± 3.9 | 0.23 ± 0.02 | 82.4 ± 1.6 | 97.3 ± 2.0 | |
| 60 | 148.4 ± 4.2 | −18.6 ± 1.3 | 0.22 ± 0.02 | 80.4 ± 3.6 | 94.5 ± 3.3 | ||
| 25 | 30 | 149.0 ± 3.7 | −16.4 ± 2.4 | 0.25 ± 0.01 | 83.1 ± 3.2 | 96.4 ± 2.1 | |
| 60 | 164.5 ± 10.9a | −12.2 ± 1.7a | 0.38 ± 0.02a | 81.9 ± 1.9a | 97.9 ± 2.0 | ||
| FNG 3 | Initial | 148.9 ± 2.1 | −18.1 ± 3.5 | 0.22 ± 0.01 | 87.5 ± 3.2 | 98.9 ± 1.7 | |
| 4 | 30 | 149.7 ± 2.3 | −17.8 ± 1.4 | 0.21 ± 0.01 | 86.5 ± 1.3 | 97.1 ± 2.5 | |
| 60 | 150.2 ± 4.4 | −16.7 ± 2.4 | 0.27 ± 0.07 | 86.4 ± 2.2 | 98.1 ± 3.1 | ||
| 25 | 30 | 151.4 ± 4.1 | −17.5 ± 2.2 | 0.25 ± 0.01 | 84.3 ± 3.7 | 96.2 ± 3.9 | |
| 60 | 157.2 ± 9.3 | −16.7 ± 6.2 | 0.29 ± 0.11 | 82.9 ± 4.2 | 98.1 ± 6.5 |
Indicates significant difference (P < 0.05) between FN 2 or FNG 3 at 25°C for 60 days and fresh FN 2 or FNG 3 under initial conditions (day 0 at room temperature).
Conclusions
NT transfersomes and a relevant sol-to-gel–forming system were successfully developed. The FN composition, with a similar molar ratio of vesicle-forming materials and lower concentration of the edge activator (TPGS), resulted in transfersomes with smaller size and higher %EE. The in situ gel, containing 0.3% w/v GG, immediately formed a hydrogel matrix in the STF, with superior viscoelastic behavior and adhesive properties. The corneal compatibility and safety of these formulations were evident from the in vitro HCLE cytotoxicity and corneal histology studies. These studies also revealed that the transfersomes prepared with 0.45% w/v nonionic surfactants were safe and compatible for ocular drug delivery. The transcorneal permeability studies demonstrated improved permeability of NT from the transfersome formulations in comparison with the control suspension. Furthermore, the amount of NT in the different ocular tissues from the FNGs at 6 hours was significantly higher than the control suspension. The overall results demonstrate the effectiveness of GG-based in situ hydrogels of transfersomes as a suitable drug delivery platform for enhanced topical ocular pharmacotherapy. Further studies investigating the ocular disposition of NT from FNs with higher drug loads is warranted.
Acknowledgments
We thank the National Institutes of Health National Eye Institute and Hamilton Eye Institute for supporting this research through grants.
Abbreviations
- AH
aqueous humor
- Cr
cornea
- DPBS
Dulbecco’s phosphate-buffered saline
- %EE
percentage of drug entrapment efficiency
- EPL
epithelial layer
- FN
natamycin transfersome formulation
- FNG
gellan gum-based FN-loaded formulation
- GFT
gel formation time
- GG
gellan gum
- GRT
gel residence time
- HCLE
human corneal limbal epithelial
- HPLC
high-performance liquid chromatography
- IC
iris-ciliary
- NT
natamycin
- Papp
apparent permeability
- PDI
polydispersity index
- PL
phospholipon
- PS
particle size
- RC
retina-choroid
- Sc
sclera
- S60
sorbitan monostearate (Span 60)
- SL
stroma layer
- STF
simulated tear fluid
- TPGS
tocopheryl polyethylene glycol succinate
- VH
vitreous humor
- ZP
zeta potential
Authorship Contributions
Participated in research design: Janga, Tatke, Majumdar.
Conducted experiments: Janga, Tatke, Balguri.
Contributed new reagents or analytic tools: Ibrahim, Maria.
Performed data analysis: Janga, Dudhipala, Jablonski, Majumdar.
Wrote or contributed to the writing of the manuscript: Dudhipala, Ibrahim, Jablonski, Majumdar.
Footnotes
This project was supported by the National Institutes of Health National Eye Institute [Grant 1R01EY022120] and a Research to Prevent Blindness grant to the Hamilton Eye Institute.
The content of this work is solely the responsibility of the authors and does not necessarily represent the official views of the National Institutes of Health.
The authors report no conflicts of interest.
References
- Abdelbary AA, Abd-Elsalam WH, Al-Mahallawi AM. (2016) Fabrication of novel ultradeformable bilosomes for enhanced ocular delivery of terconazole: in vitro characterization, ex vivo permeation and in vivo safety assessment. Int J Pharm 513:688–696. [DOI] [PubMed] [Google Scholar]
- Abdelkader H, Ismail S, Hussein A, Wu Z, Al-Kassas R, Alany RG. (2012) Conjunctival and corneal tolerability assessment of ocular naltrexone niosomes and their ingredients on the hen’s egg chorioallantoic membrane and excised bovine cornea models. Int J Pharm 432:1–10. [DOI] [PubMed] [Google Scholar]
- Abdelkader H, Ismail S, Kamal A, Alany RG. (2011) Design and evaluation of controlled-release niosomes and discomes for naltrexone hydrochloride ocular delivery. J Pharm Sci 100:1833–1846. [DOI] [PubMed] [Google Scholar]
- Adelli GR, Balguri SP, Bhagav P, Raman V, Majumdar S. (2017) Diclofenac sodium ion exchange resin complex loaded melt cast films for sustained release ocular delivery. Drug Deliv 24:370–379. [DOI] [PMC free article] [PubMed] [Google Scholar]
- Agarwal R, Iezhitsa I, Agarwal P, Abdul Nasir NA, Razali N, Alyautdin R, Ismail NM. (2016) Liposomes in topical ophthalmic drug delivery: an update. Drug Deliv 23:1075–1091. [DOI] [PubMed] [Google Scholar]
- Al-Halafi AM. (2014) Nanocarriers of nanotechnology in retinal diseases. Saudi J Ophthalmol 28:304–309. [DOI] [PMC free article] [PubMed] [Google Scholar]
- Ali M, Byrne ME. (2008) Challenges and solutions in topical ocular drug-delivery systems. Expert Rev Clin Pharmacol 1:145–161. [DOI] [PubMed] [Google Scholar]
- Al-Mahallawi AM, Abdelbary AA, Aburahma MH. (2015) Investigating the potential of employing bilosomes as a novel vesicular carrier for transdermal delivery of tenoxicam. Int J Pharm 485:329–340. [DOI] [PubMed] [Google Scholar]
- Balguri SP, Adelli GR, Majumdar S. (2016) Topical ophthalmic lipid nanoparticle formulations (SLN, NLC) of indomethacin for delivery to the posterior segment ocular tissues. Eur J Pharm Biopharm 109:224–235. [DOI] [PMC free article] [PubMed] [Google Scholar]
- Balguri SP, Adelli GR, Tatke A, Janga KY, Bhagav P, Majumdar S. (2017) Melt-cast noninvasive ocular inserts for posterior segment drug delivery. J Pharm Sci 106:3515–3523. [DOI] [PMC free article] [PubMed] [Google Scholar]
- Barar J, Asadi M, Mortazavi-Tabatabaei SA, Omidi Y. (2009) Ocular drug delivery; impact of in vitro cell culture models. J Ophthalmic Vis Res 4:238–252. [PMC free article] [PubMed] [Google Scholar]
- Bhatta RS, Chandasana H, Chhonker YS, Rathi C, Kumar D, Mitra K, Shukla PK. (2012) Mucoadhesive nanoparticles for prolonged ocular delivery of natamycin: in vitro and pharmacokinetics studies. Int J Pharm 432:105–112. [DOI] [PubMed] [Google Scholar]
- Chen H, Pan H, Li P, Wang H, Wang X, Pan W, Yuan Y. (2016) The potential use of novel chitosan-coated deformable liposomes in an ocular drug delivery system. Colloids Surf B Biointerfaces 143:455–462. [DOI] [PubMed] [Google Scholar]
- Dai Y, Zhou R, Liu L, Lu Y, Qi J, Wu W. (2013) Liposomes containing bile salts as novel ocular delivery systems for tacrolimus (FK506): in vitro characterization and improved corneal permeation. Int J Nanomedicine 8:1921–1933. [DOI] [PMC free article] [PubMed] [Google Scholar]
- Dintzis F, Babcock G, Tobin R. (1970) Studies on dilute solutions and dispersion of the polysaccharide from Xanthomonas campestris NNRL B-1459. Carbohydr Res 13:257–267. [Google Scholar]
- Duxfield L, Sultana R, Wang R, Englebretsen V, Deo S, Swift S, Rupenthal I, Al-Kassas R. (2016) Development of gatifloxacin-loaded cationic polymeric nanoparticles for ocular drug delivery. Pharm Dev Technol 21:172–179. [DOI] [PubMed] [Google Scholar]
- Fathi M, Barar J, Aghanejad A, Omidi Y. (2015) Hydrogels for ocular drug delivery and tissue engineering. Bioimpacts 5:159–164. [DOI] [PMC free article] [PubMed] [Google Scholar]
- Garg V, Singh H, Bimbrawh S, Singh SK, Gulati M, Vaidya Y, Kaur P. (2017) Ethosomes and transfersomes: principles, perspectives and practices. Curr Drug Deliv 14:613–633. [DOI] [PubMed] [Google Scholar]
- Huang D, Chen YS, Rupenthal ID. (2018) Overcoming ocular drug delivery barriers through the use of physical forces. Adv Drug Deliv Rev 126:96–112. [DOI] [PubMed] [Google Scholar]
- Ibrahim MM, Abd-Elgawad AE, Soliman OA, Jablonski MM. (2013) Nanoparticle-based topical ophthalmic formulations for sustained celecoxib release. J Pharm Sci 102:1036–1053. [DOI] [PubMed] [Google Scholar]
- Ibrahim MM, Abd-Elgawad AH, Soliman OA, Jablonski MM. (2016) Stability and ocular pharmacokinetics of celecoxib-loaded nanoparticles topical ophthalmic formulations. J Pharm Sci 105:3691–3701. [DOI] [PubMed] [Google Scholar]
- Ikuta Y, Aoyagi S, Tanaka Y, Sato K, Inada S, Koseki Y, Onodera T, Oikawa H, Kasai H. (2017) Creation of nano eye-drops and effective drug delivery to the interior of the eye. Sci Rep 7:44229 DOI: 10.1038/srep44229. [DOI] [PMC free article] [PubMed] [Google Scholar]
- Jain D, Kumar V, Singh S, Anette M, Daniel BS. (2016) Newer trends in in situ gelling systems for controlled ocular drug delivery. J Anal Pharm Res 2:1–16. [Google Scholar]
- Janga KY, Tatke A, Balguri SP, Lamichanne SP, Ibrahim MM, Maria DN, Jablonski MM, Majumdar S. (2018) Ion-sensitive in situ hydrogels of natamycin bilosomes for enhanced and prolonged ocular pharmacotherapy: in vitro permeability, cytotoxicity and in vivo evaluation. Artif Cells Nanomed Biotechnol 46:S1039–1050. [DOI] [PMC free article] [PubMed] [Google Scholar]
- Kulkarni SB, Betageri GV, Singh M. (1995) Factors affecting microencapsulation of drugs in liposomes. J Microencapsul 12:229–246. [DOI] [PubMed] [Google Scholar]
- Kumar D, Jain N, Gulati N, Nagaich U. (2013) Nanoparticles laden in situ gelling system for ocular drug targeting. J Adv Pharm Technol Res 4:9–17. [DOI] [PMC free article] [PubMed] [Google Scholar]
- Kushwaha SK, Saxena P, Rai A. (2012) Stimuli sensitive hydrogels for ophthalmic drug delivery: a review. Int J Pharm Investig 2:54–60. [DOI] [PMC free article] [PubMed] [Google Scholar]
- Liu W, Hu M, Liu W, Xue C, Xu H, Yang X. (2008) Investigation of the carbopol gel of solid lipid nanoparticles for the transdermal iontophoretic delivery of triamcinolone acetonide acetate. Int J Pharm 364:135–141. [DOI] [PubMed] [Google Scholar]
- Majumdar S, Srirangam R. (2009) Solubility, stability, physicochemical characteristics and in vitro ocular tissue permeability of hesperidin: a natural bioflavonoid. Pharm Res 26:1217–1225. [DOI] [PMC free article] [PubMed] [Google Scholar]
- Morsi N, Ibrahim M, Refai H, El Sorogy H. (2017) Nanoemulsion-based electrolyte triggered in situ gel for ocular delivery of acetazolamide. Eur J Pharm Sci 104:302–314. [DOI] [PubMed] [Google Scholar]
- Mun EA, Morrison PW, Williams AC, Khutoryanskiy VV. (2014) On the barrier properties of the cornea: a microscopy study of the penetration of fluorescently labeled nanoparticles, polymers, and sodium fluorescein. Mol Pharm 11:3556–3564. [DOI] [PubMed] [Google Scholar]
- Mundada AS, Avari JG. (2009) In situ gelling polymers in ocular drug delivery systems: a review. Crit Rev Ther Drug Carrier Syst 26:85–118. [DOI] [PubMed] [Google Scholar]
- Nagesh C, Patil M, Chandrashekar S, Rahul S. (2012) A novel in situ gel for sustained ophthalmic delivery of ciprofloxacin hydrochloride and dexamethasone-design and characterization. Der Pharmacia Lettre 4:821–827. [Google Scholar]
- Pandurangan DK, Bodagala P, Palanirajan VK, Govindaraj S. (2016) Formulation and evaluation of voriconazole ophthalmic solid lipid nanoparticles in situ gel. Int J Pharm Investig 6:56–62. [DOI] [PMC free article] [PubMed] [Google Scholar]
- Paradkar MU, Parmar M. (2017) Formulation development and evaluation of natamycin niosomal in-situ gel for ophthalmic drug delivery. J Drug Deliv Sci Technol 39:113–122. [Google Scholar]
- Patel A, Cholkar K, Agrahari V, Mitra AK. (2013) Ocular drug delivery systems: an overview. World J Pharmacol 2:47–64. [DOI] [PMC free article] [PubMed] [Google Scholar]
- Pitta SK, Dudhipala N, Narala A, Veerabrahma K. (2018) Development of zolmitriptan transfersomes by Box-Behnken design for nasal delivery: in vitro and in vivo evaluation. Drug Dev Ind Pharm 44:484–492. [DOI] [PubMed] [Google Scholar]
- Rother M, Lavins BJ, Kneer W, Lehnhardt K, Seidel EJ, Mazgareanu S. (2007) Efficacy and safety of epicutaneous ketoprofen in transfersome (IDEA-033) versus oral celecoxib and placebo in osteoarthritis of the knee: multicentre randomised controlled trial. Ann Rheum Dis 66:1178–1183. [DOI] [PMC free article] [PubMed] [Google Scholar]
- Rowe-Rendleman CL, Durazo SA, Kompella UB, Rittenhouse KD, Di Polo A, Weiner AL, Grossniklaus HE, Naash MI, Lewin AS, Horsager A, et al. (2014) Drug and gene delivery to the back of the eye: from bench to bedside. Invest Ophthalmol Vis Sci 55:2714–2730. [DOI] [PMC free article] [PubMed] [Google Scholar]
- Rupenthal ID, Green CR, Alany RG. (2011) Comparison of ion-activated in situ gelling systems for ocular drug delivery. Part 1: physicochemical characterisation and in vitro release. Int J Pharm 411:69–77. [DOI] [PubMed] [Google Scholar]
- Shamma RN, Elsayed I. (2013) Transfersomal lyophilized gel of buspirone HCl: formulation, evaluation and statistical optimization. J Liposome Res 23:244–254. [DOI] [PubMed] [Google Scholar]
- Sheshala R, Kok YY, Ng JM, Thakur RR, Dua K. (2015) In situ gelling ophthalmic drug delivery system: an overview and its applications. Recent Pat Drug Deliv Formul 9:237–248. [DOI] [PubMed] [Google Scholar]
- Shukla A, Mishra V, Kesharwani P. (2016) Bilosomes in the context of oral immunization: development, challenges and opportunities. Drug Discov Today 21:888–899. [DOI] [PubMed] [Google Scholar]
- Tai A, Bianchini R, Jachowicz J. (2014) Texture analysis of cosmetic/pharmaceutical raw materials and formulations. Int J Cosmet Sci 36:291–304. [DOI] [PubMed] [Google Scholar]
- Tanure MAG, Cohen EJ, Sudesh S, Rapuano CJ, Laibson PR. (2000) Spectrum of fungal keratitis at Wills Eye Hospital, Philadelphia, Pennsylvania. Cornea 19:307–312. [DOI] [PubMed] [Google Scholar]
- Thangabalan B, Kumar PV. (2013) Analytical method development and validation of natamycin in eye drop by RP-HPLC. Asian J Pharm Clin Res 6:134–135. [Google Scholar]
- Uddin MS, Al Mamun A, Kabir MT, Jinnat RS, Sonia Z, Yesmin B, Shah Amran MD. (2017) Quality control tests for ophthalmic pharmaceuticals: pharmacopoeial standards and specifications. J Adv Med Pharm Sci 14:1–17. [Google Scholar]
- Urtti A. (2006) Challenges and obstacles of ocular pharmacokinetics and drug delivery. Adv Drug Deliv Rev 58:1131–1135. [DOI] [PubMed] [Google Scholar]
- Yu W, do Egito EST, Barratt G, Fessi H, Devissaguet JP, Puisieux F. (1993) A novel approach to the preparation of injectable emulsions by a spontaneous emulsification process. Int J Pharm 89:139–146. [Google Scholar]